TaskMapper Therm
Last updated January 13, 2025
TABLE OF CONTENTS
Introduction to TaskMapper Therm
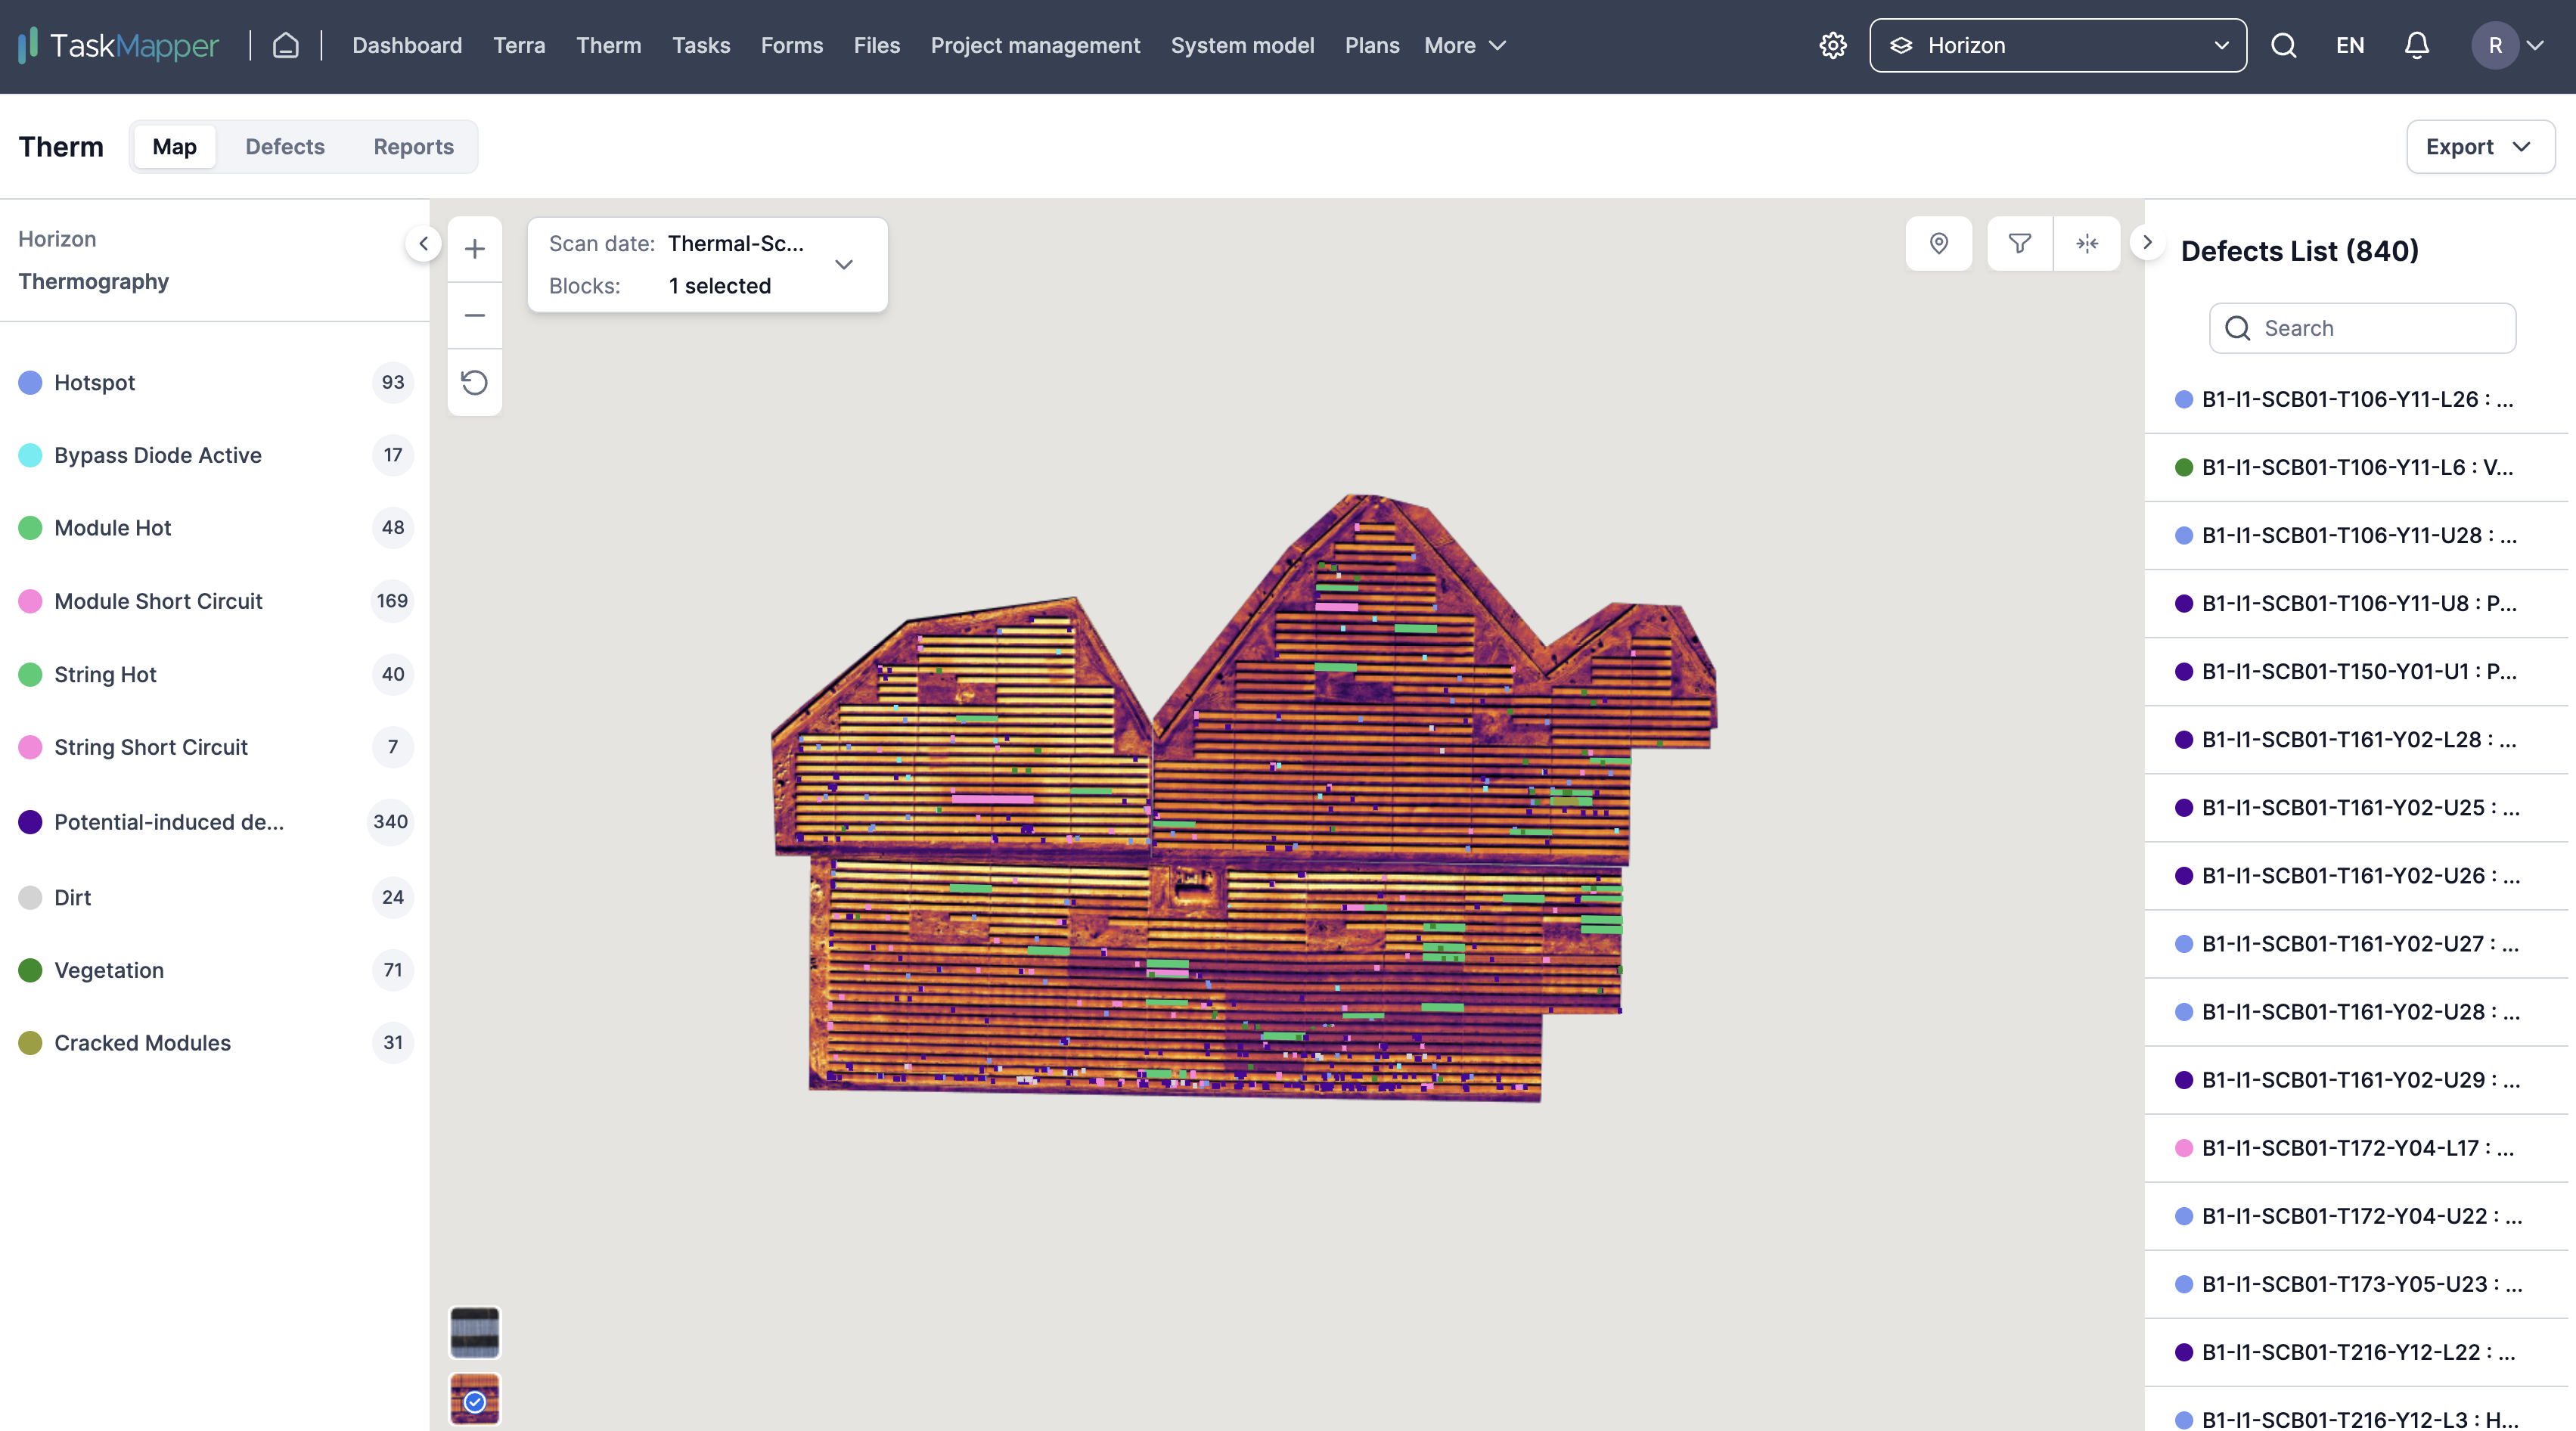
At Therm, we use thermal imagery to keep solar sites healthy. Our intelligent AI algorithm can precisely spot and categorize over 20 defect types. Plus, our seamless integration with the Task productivity suite means quick and easy fixes for any problems in the field using handy mobile task management tools.
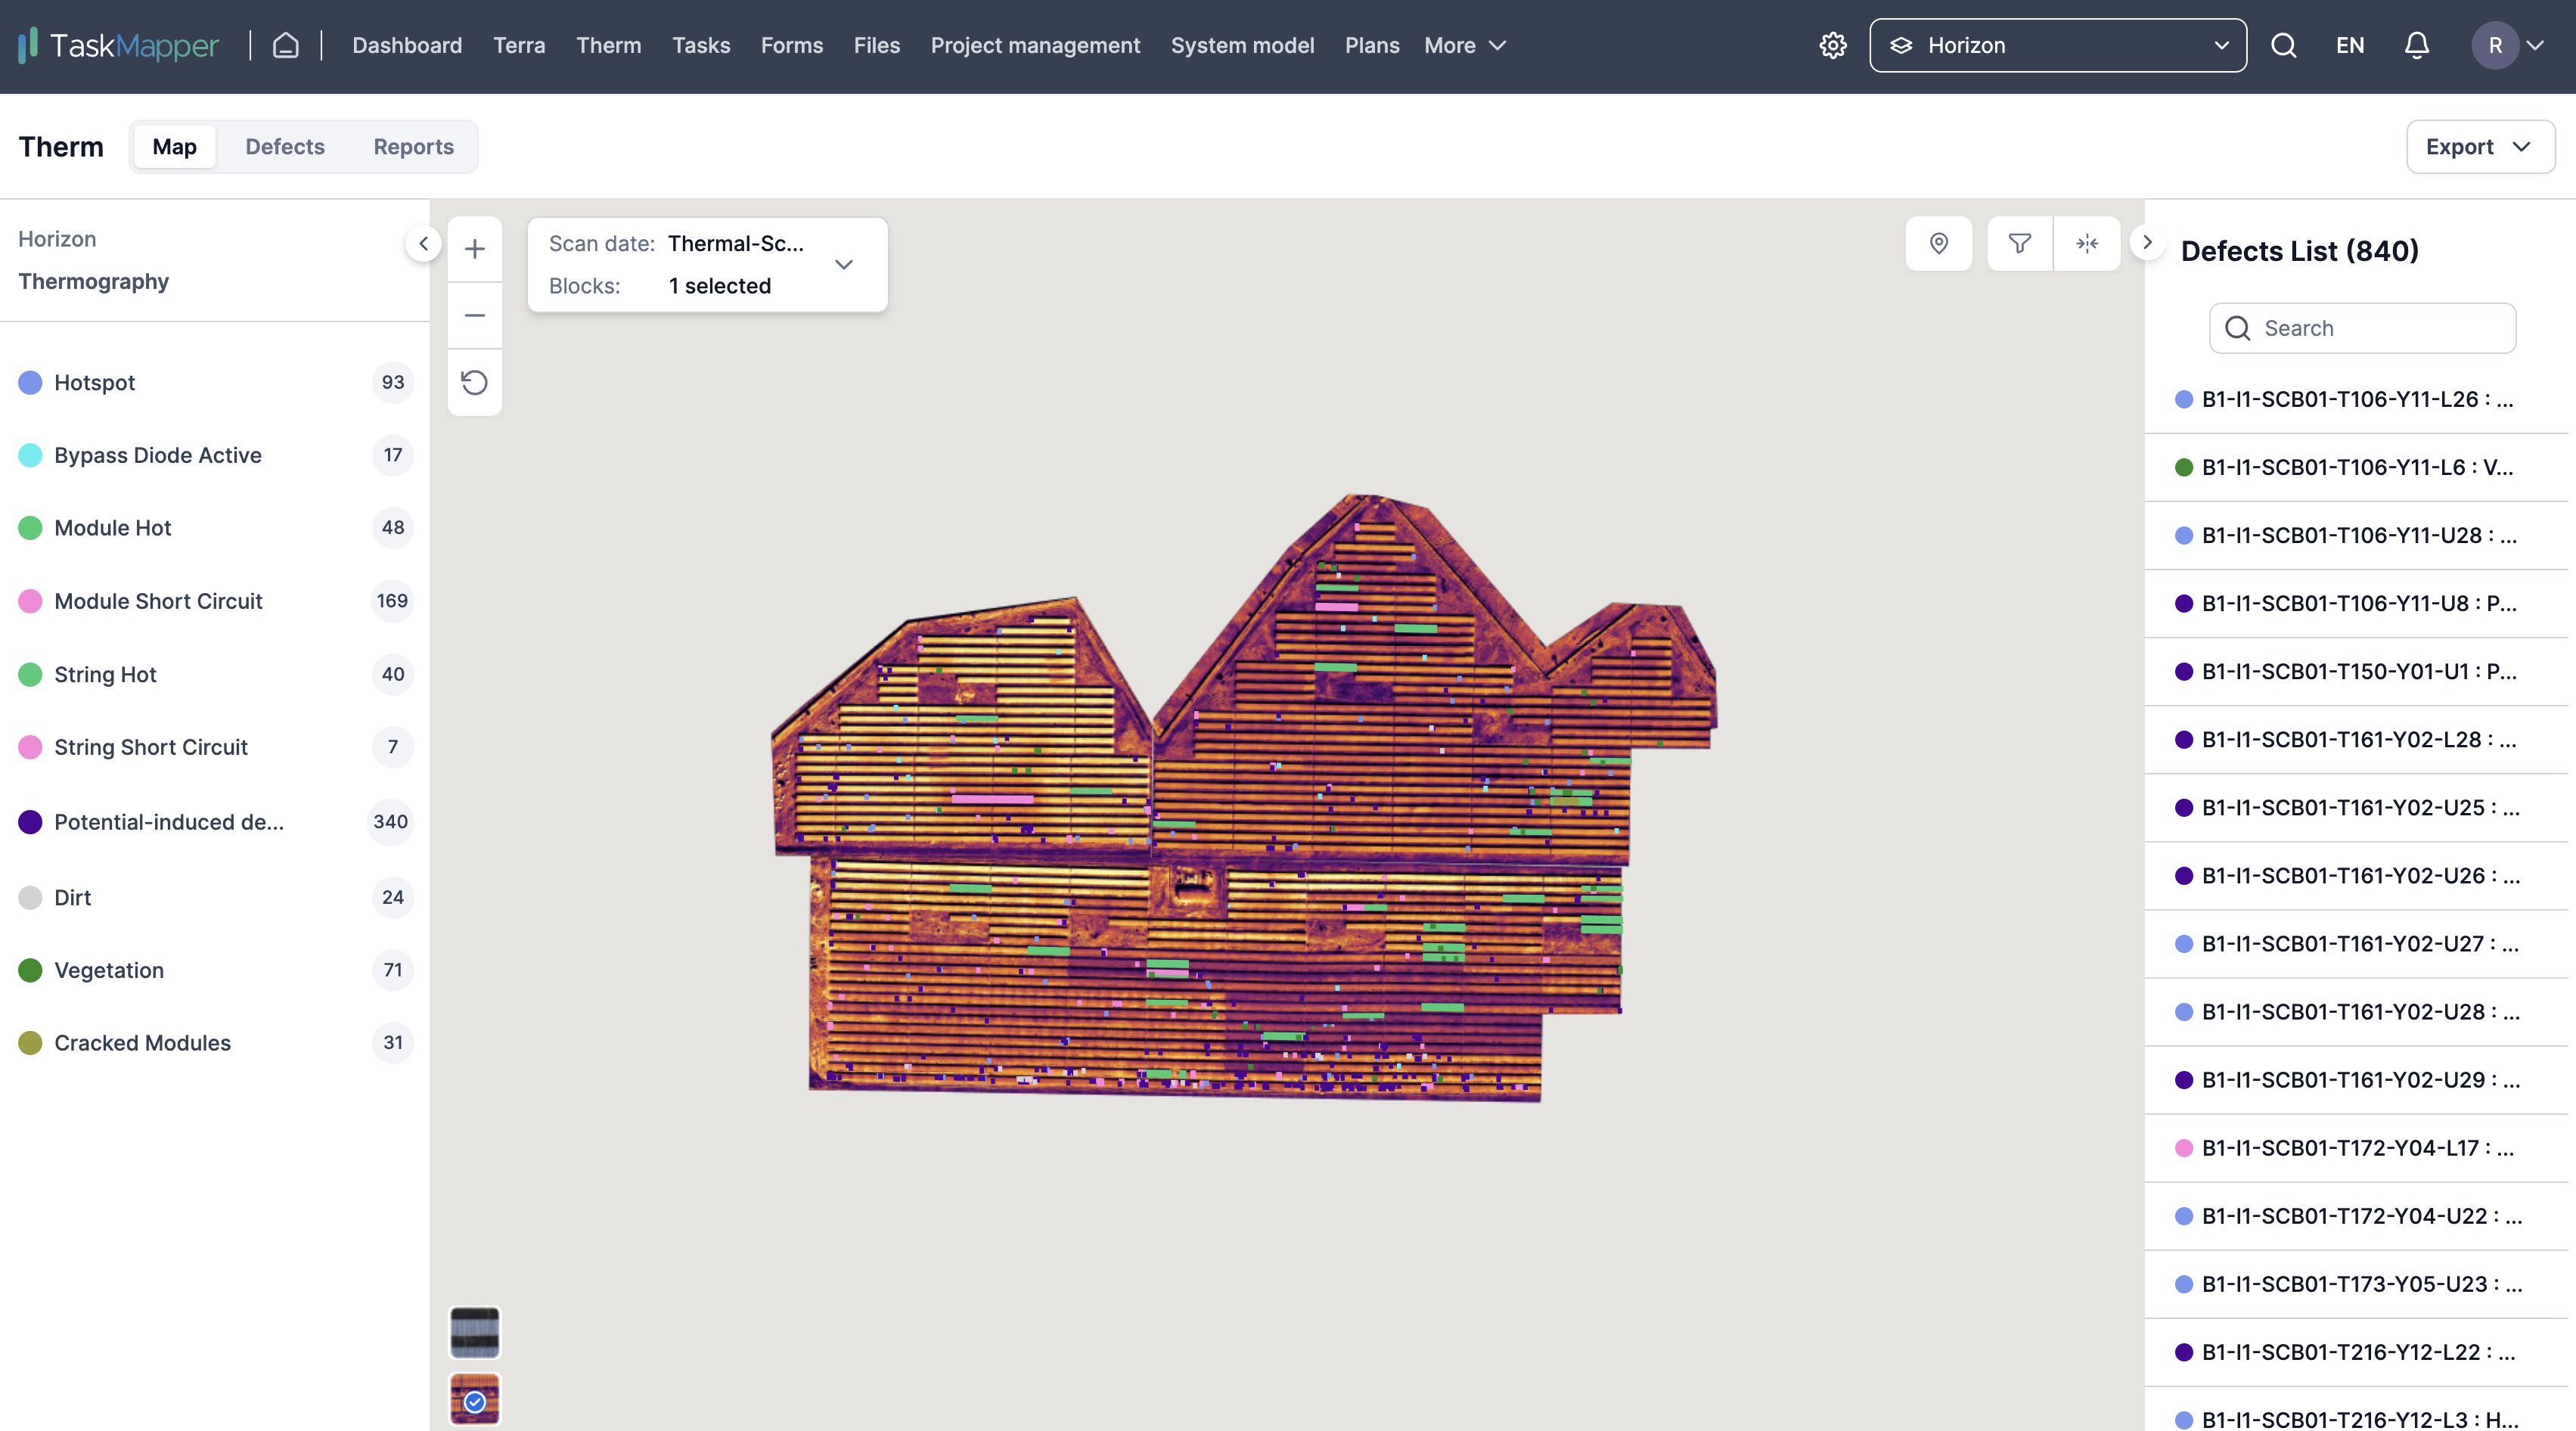
FIGURE 1: THERM DEFECTS CLASSIFICATION
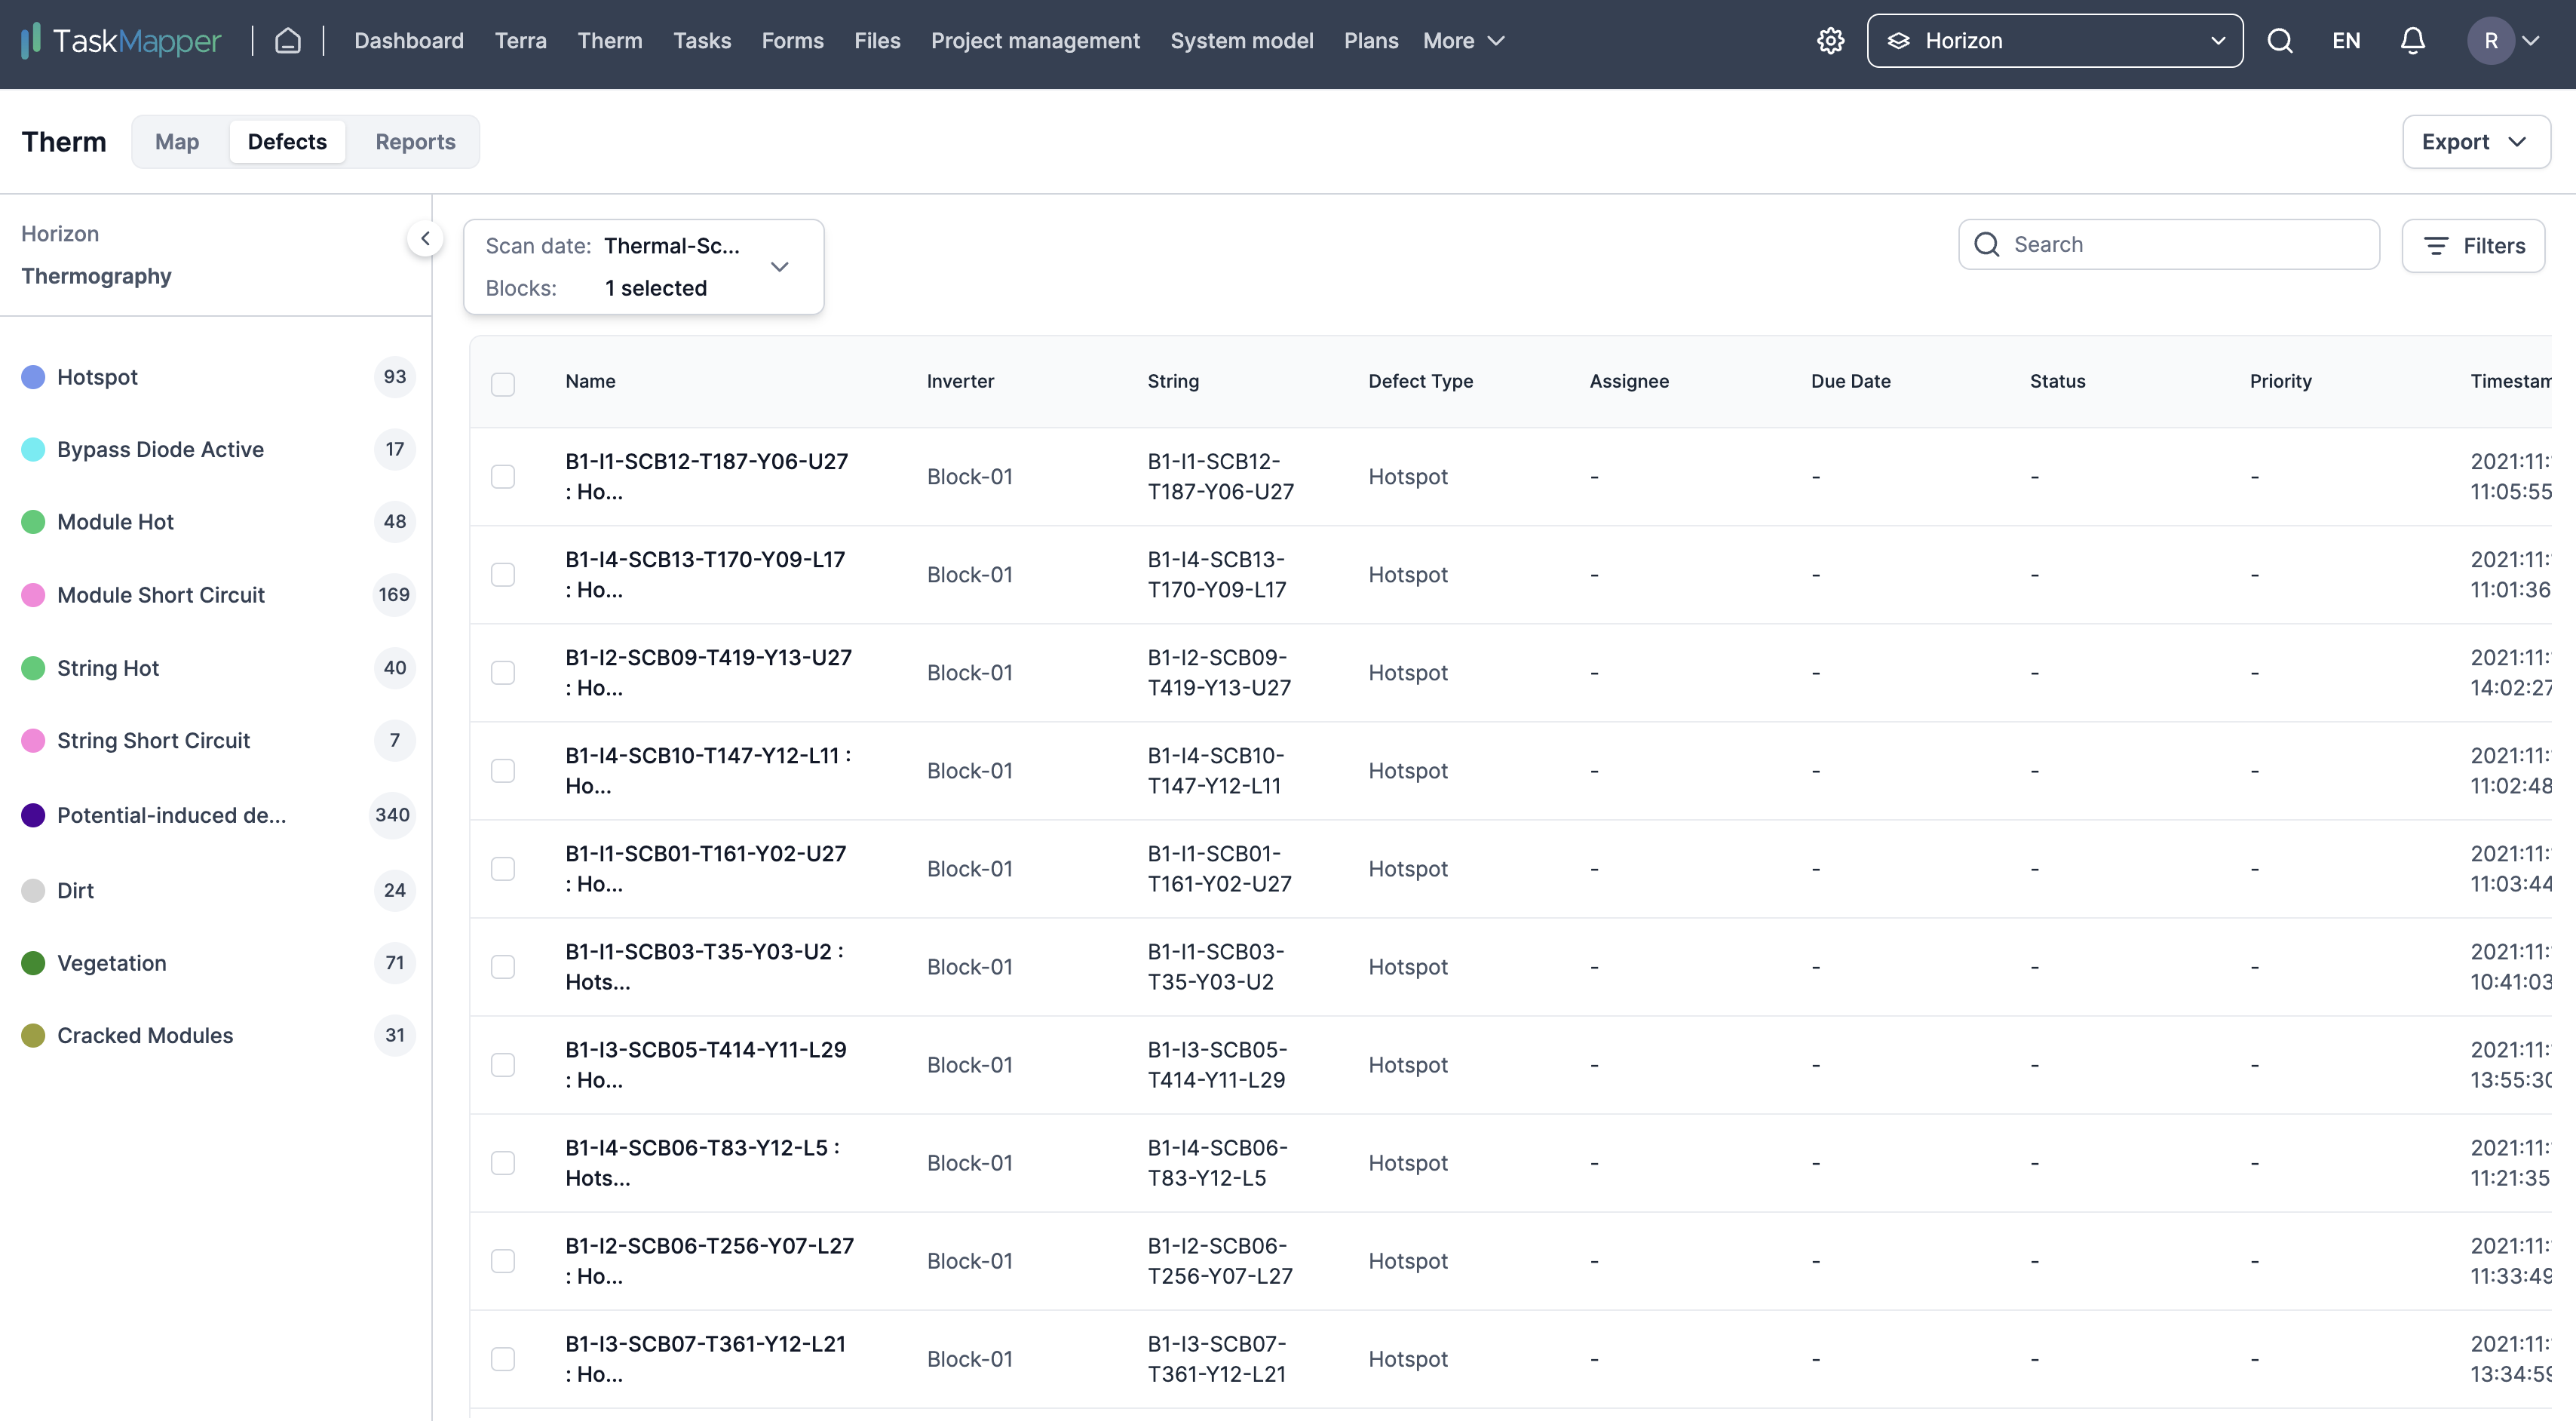
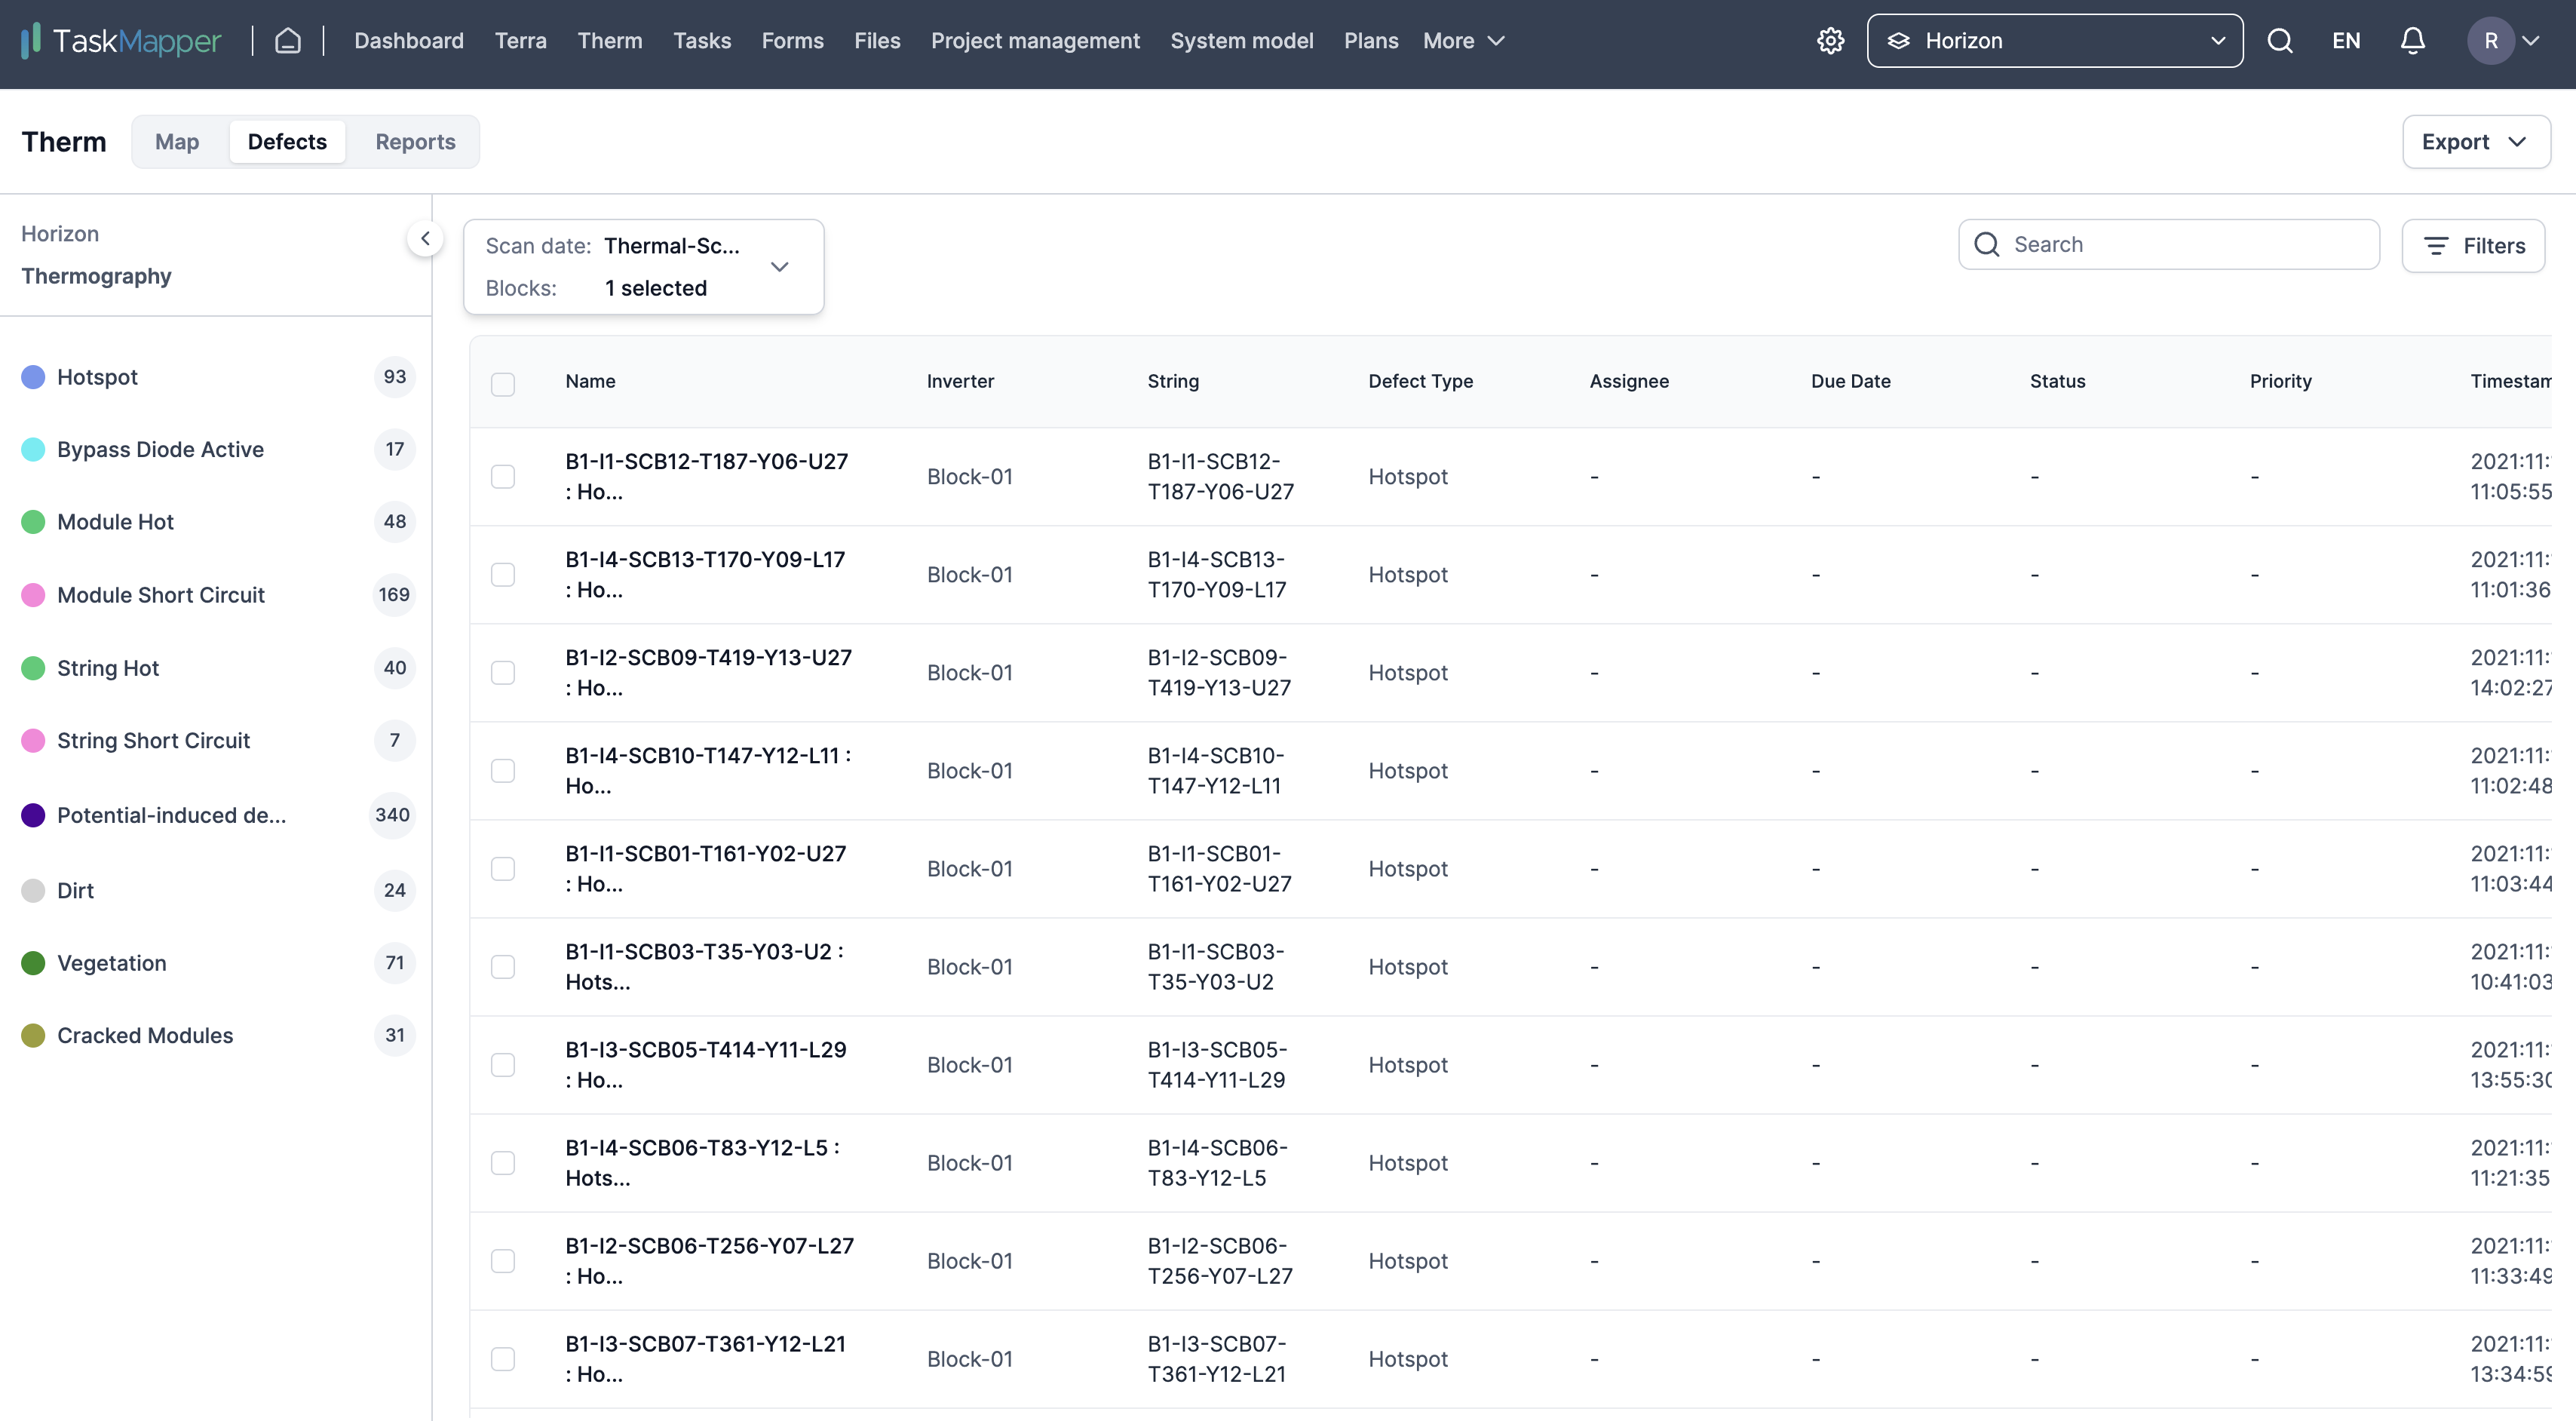
FIGURE 2: DEFECT LIST
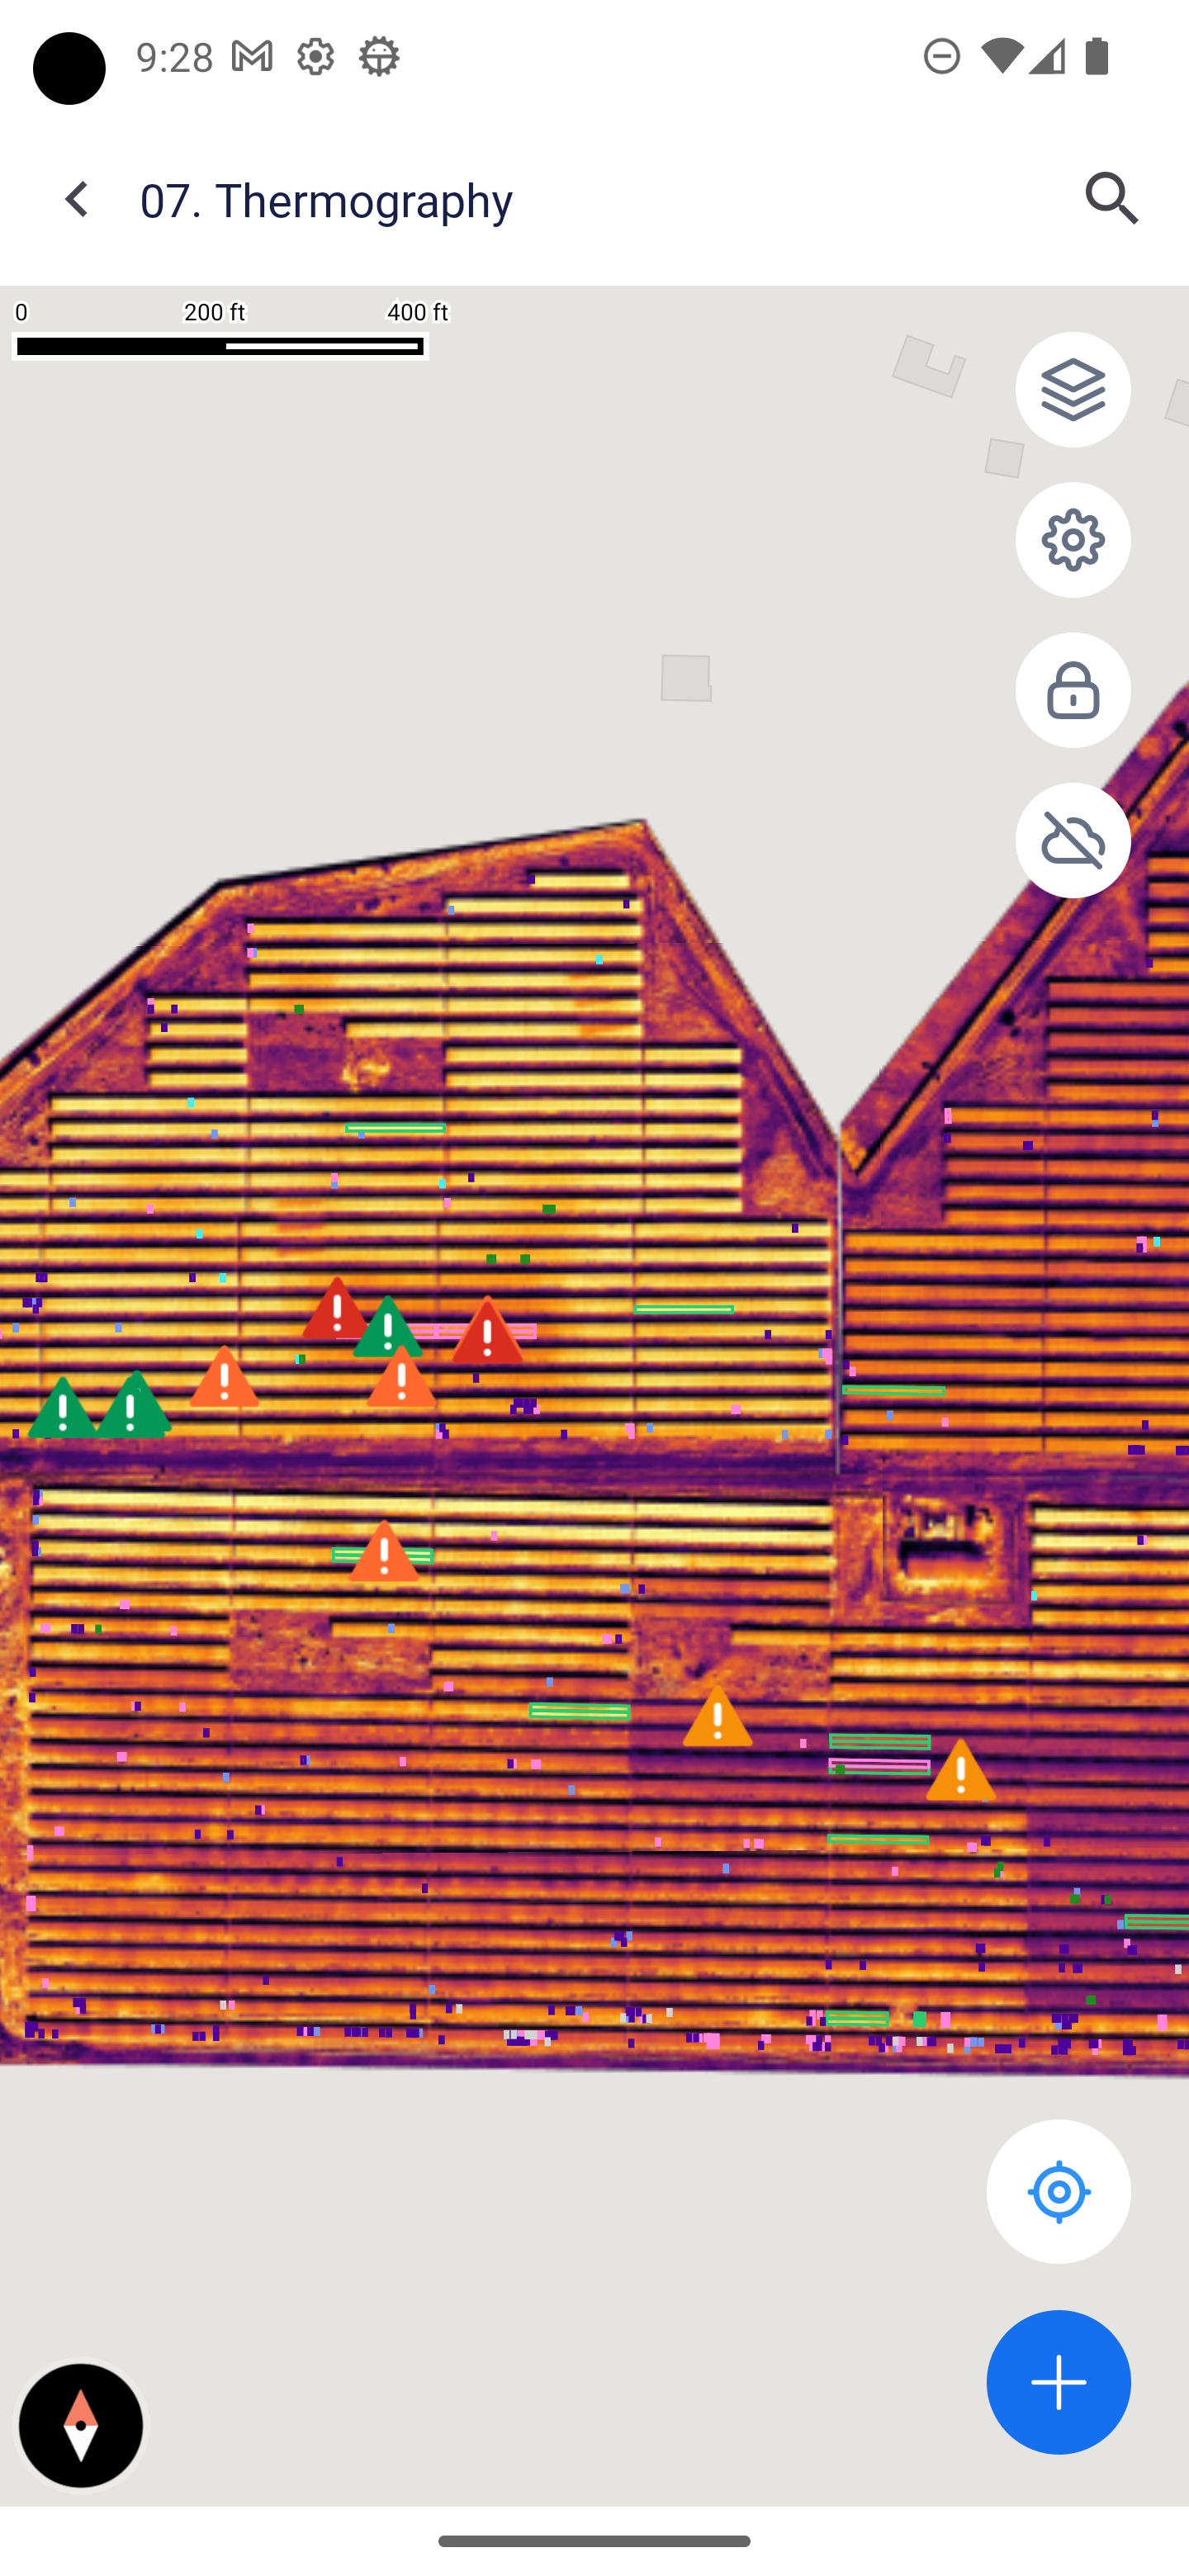
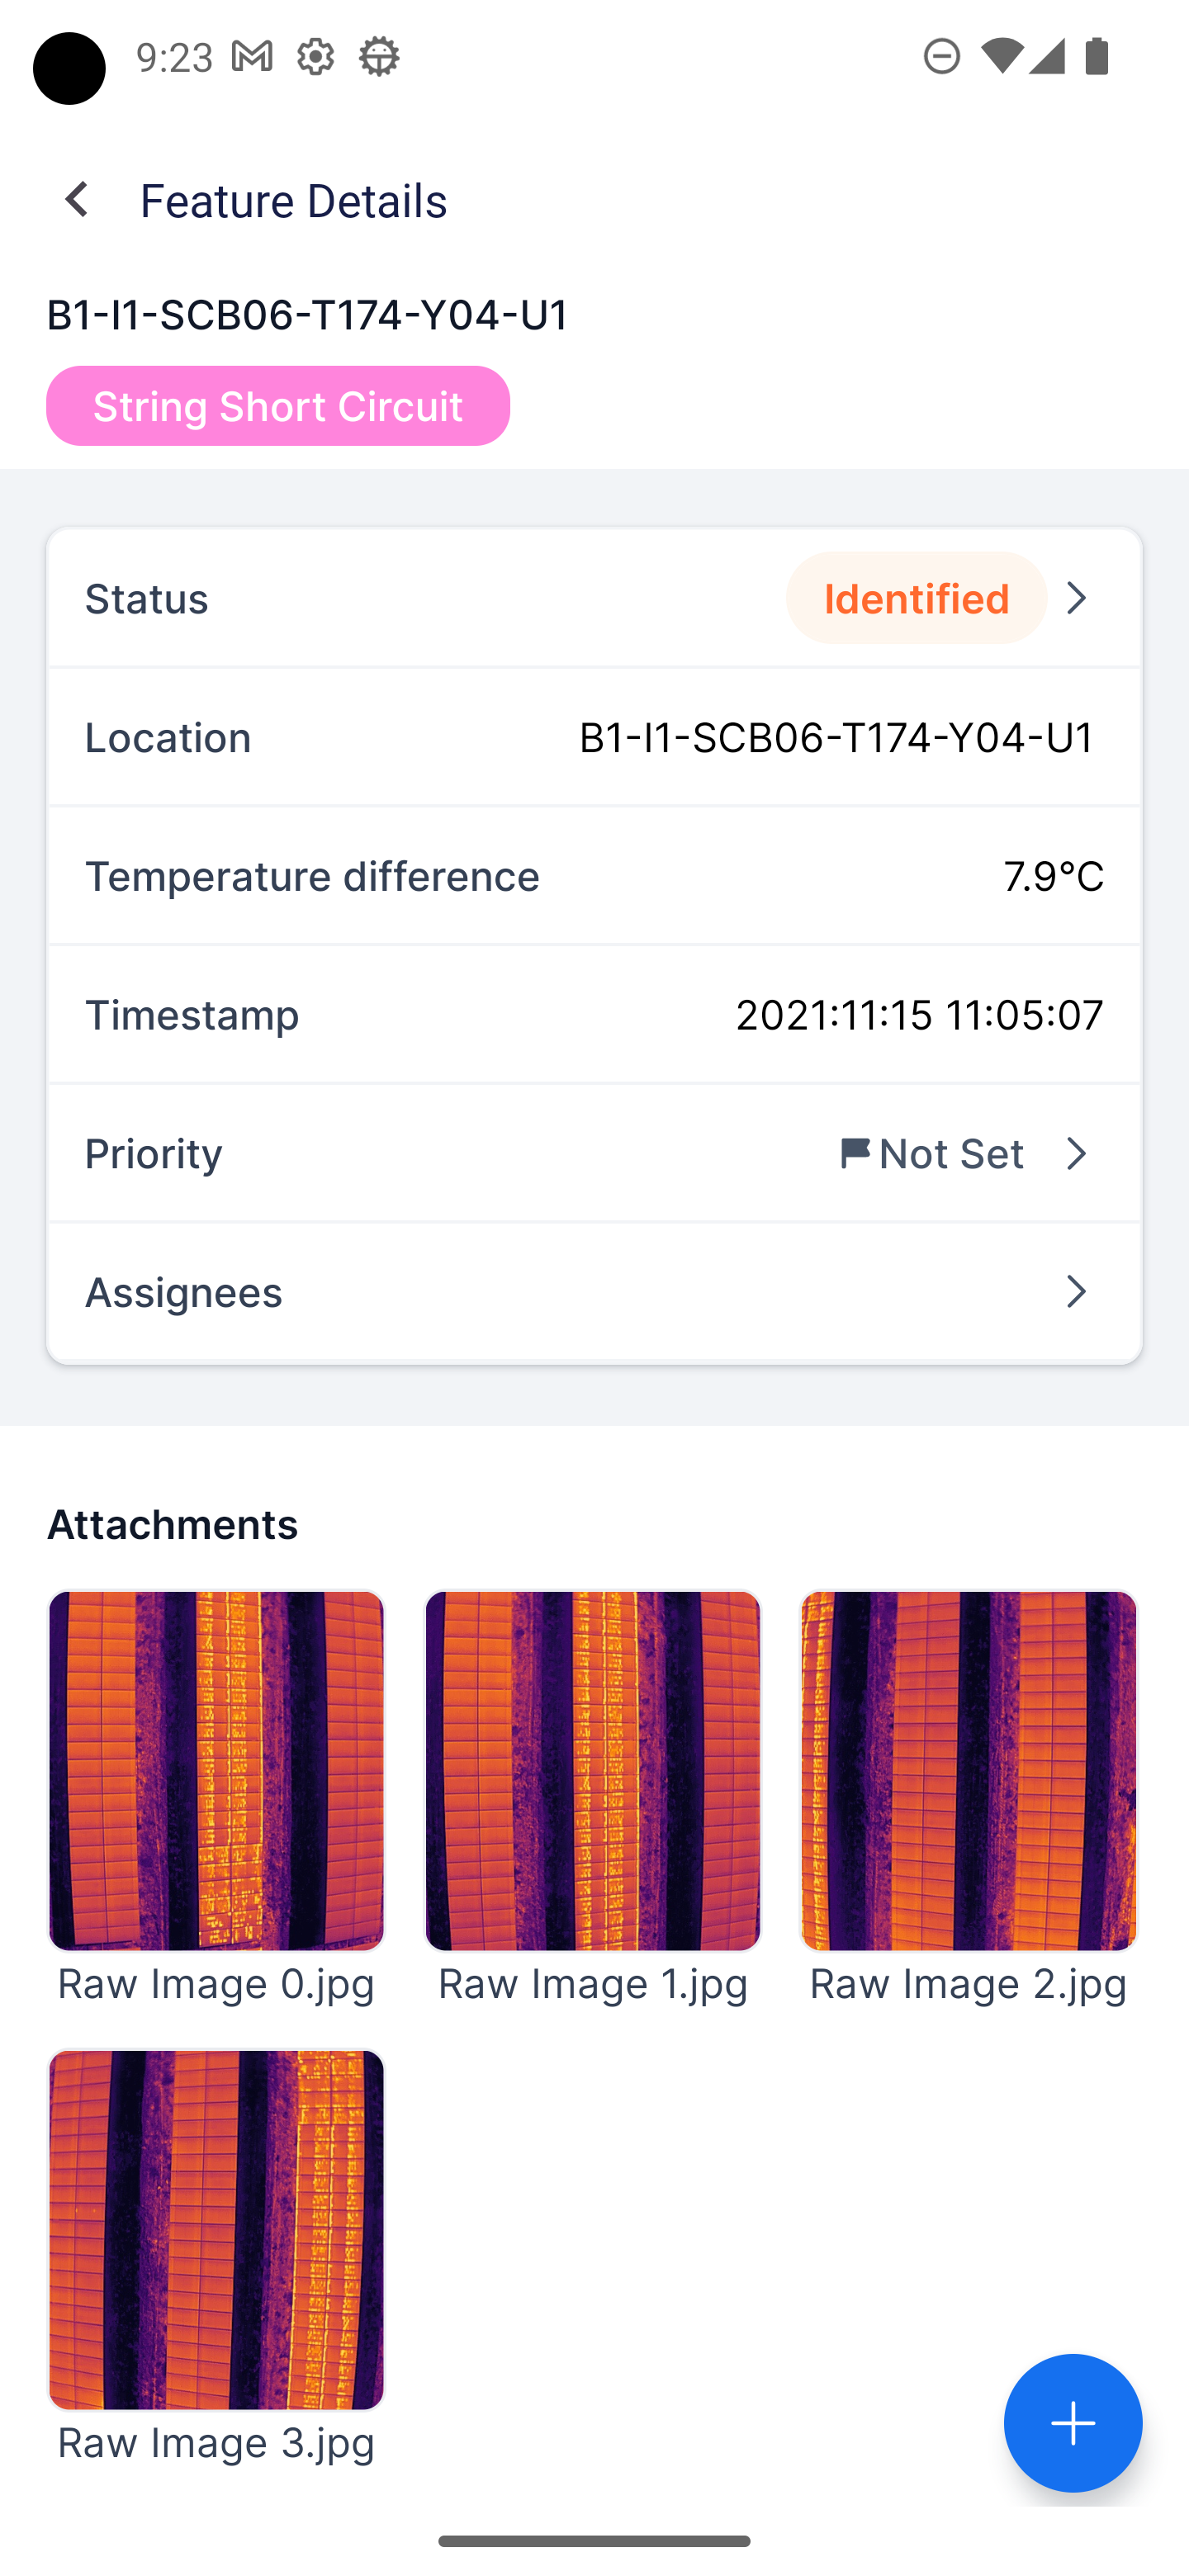
FIGURE 3: DEFECT REMEDIATION WITH TASKMAPPER MOBILE APPLICATION
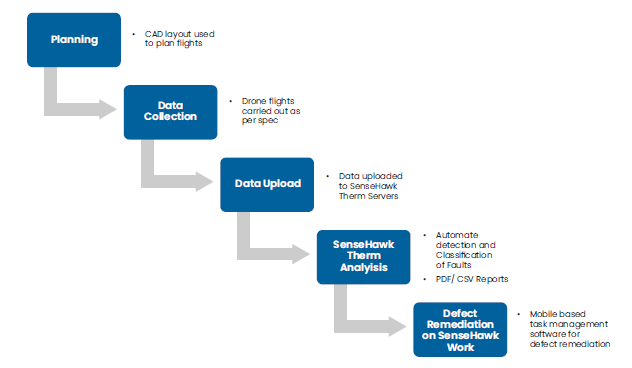
Key Concepts & Methodology
Data setup and defect remediation using Therm.
FIGURE 4: KEY CONCEPTS AND METHODOLOGY
Therm Overview
Maps
The thermal map is the drone-acquired thermal imagery.
FIGURE 5: THERM MAP VIEW
Defects
Our AI algorithm in Therm helps identify defects in the solar array and classify them into specific types, such as Bypass Diode Active, Hotspot, and Module Hot. You can easily view these identified defects on the Map page or track them separately on the Defects page.
FIGURE 6: DEFECTS LIST
Filters
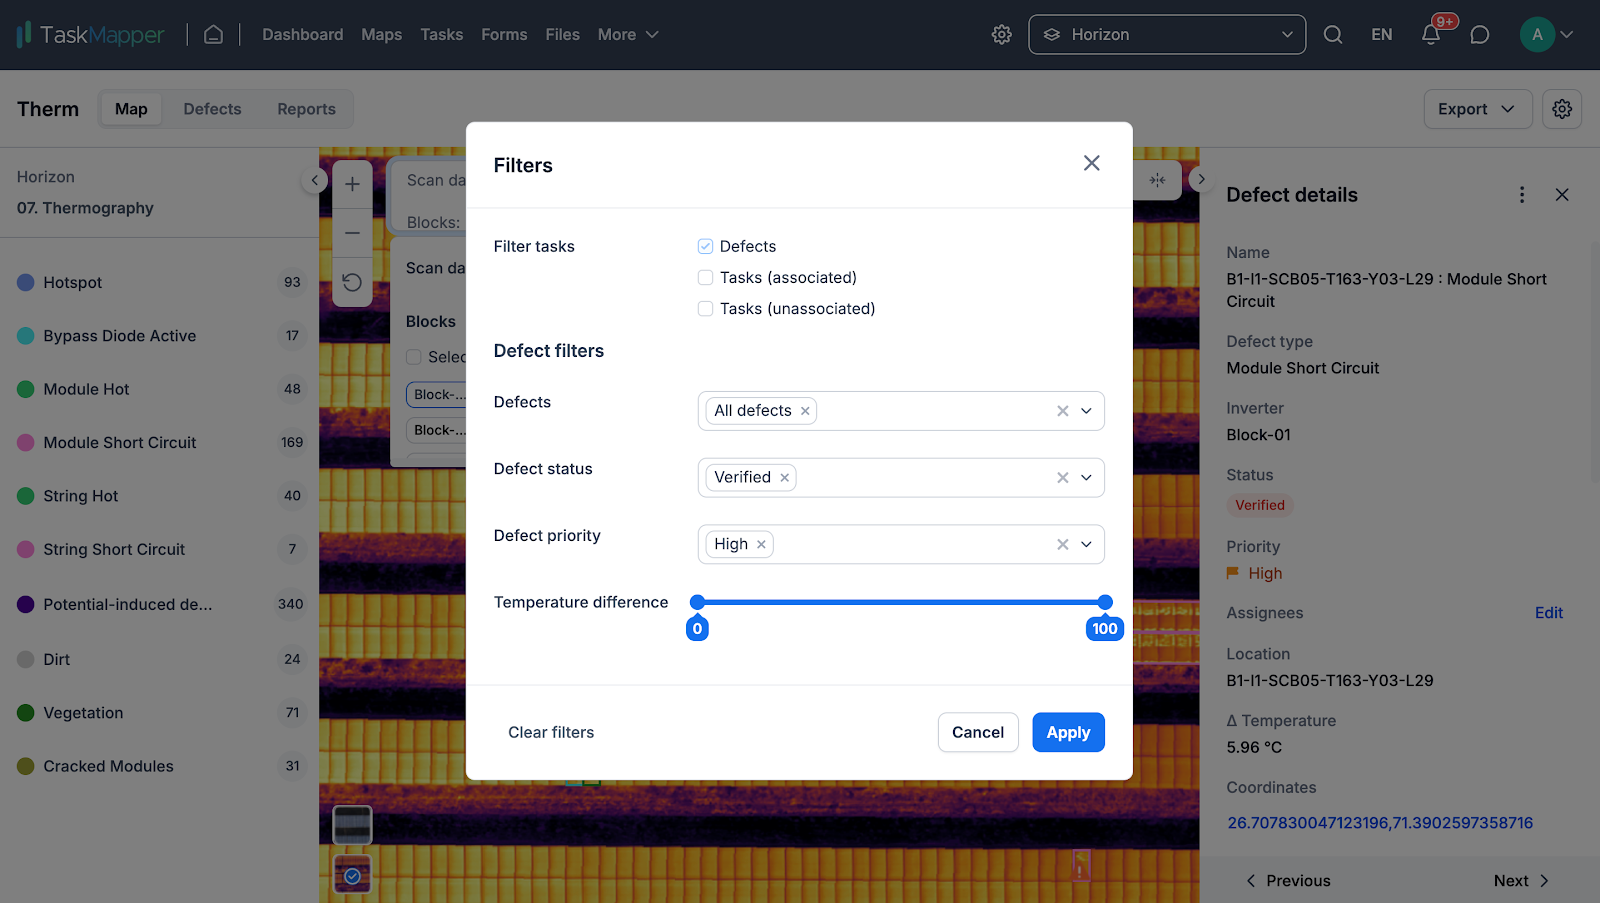
Filters help to quickly narrow down the data displayed to only those records you care about. The set filter will apply to all the pages on the Therm page. Some of the options in the filters are:
Filter by defect type, status, priority, and temperature difference.
FIGURE 7: FILTERS
Defects List & Classifications
We've colour-coded all the thermal issues for your convenience. The left-hand column contains the colour legend and defect types. Just click on a defect to select or deselect the defects you'd like to view on the map.
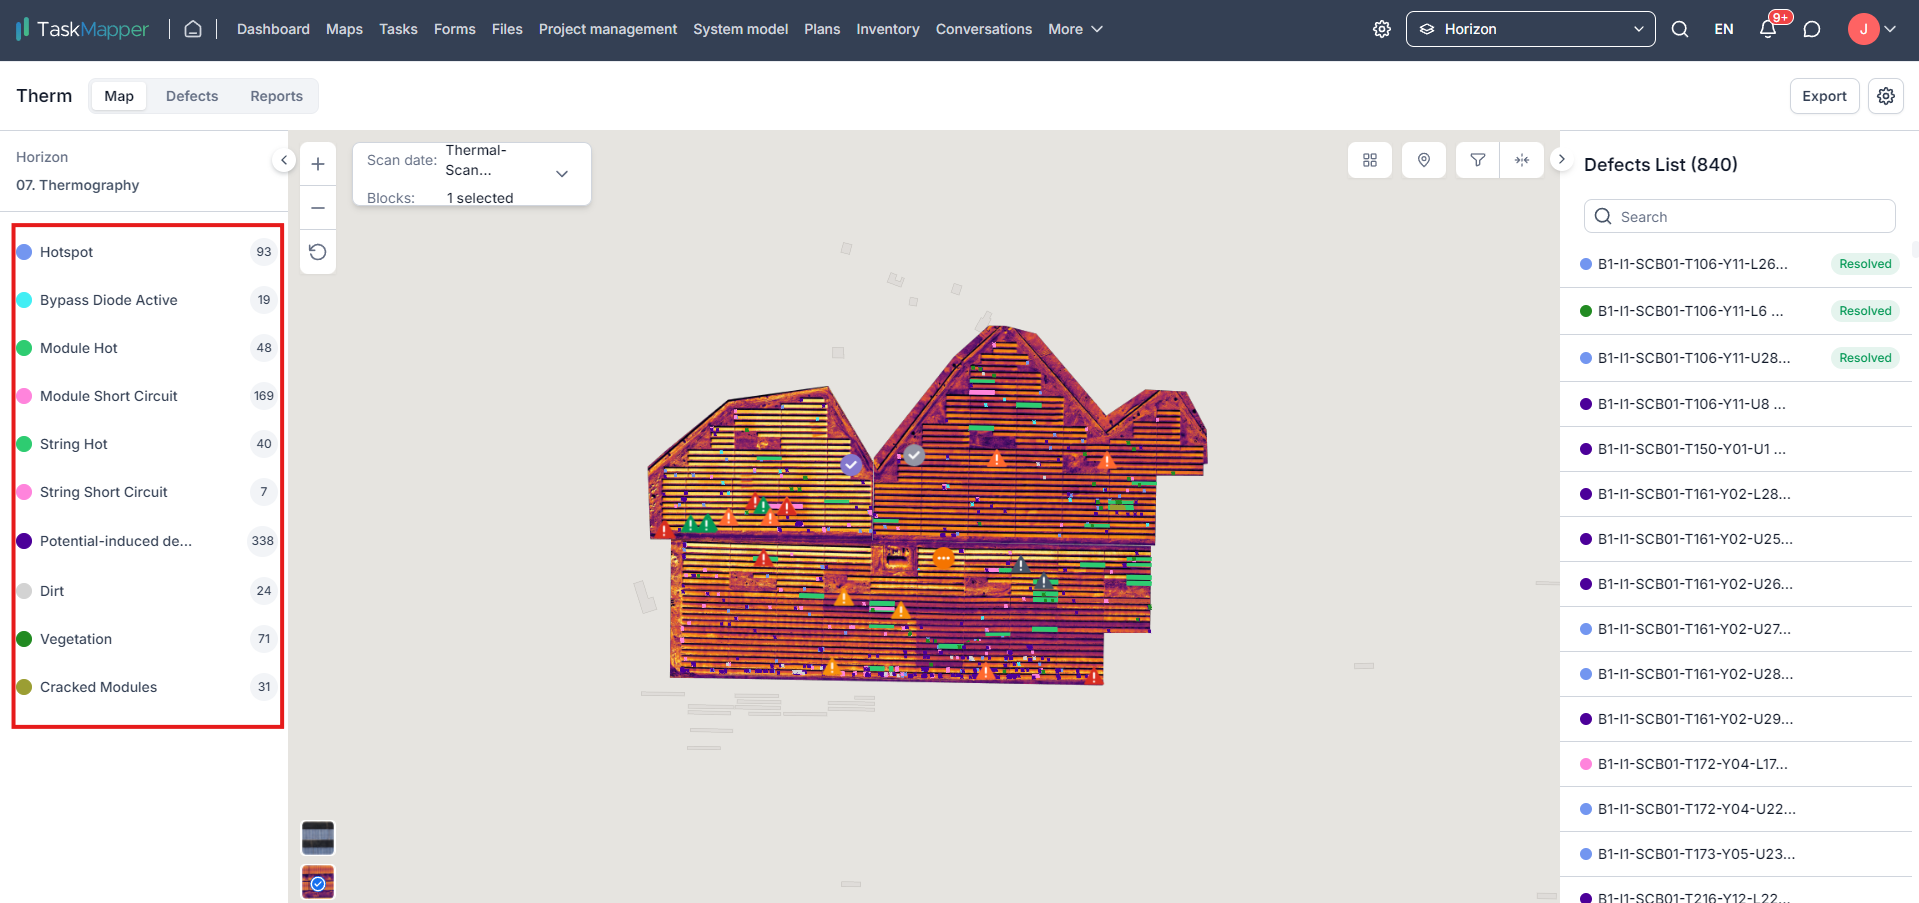
FIGURE 8: DEFECTS CLASSIFICATION
Visual Map layouts
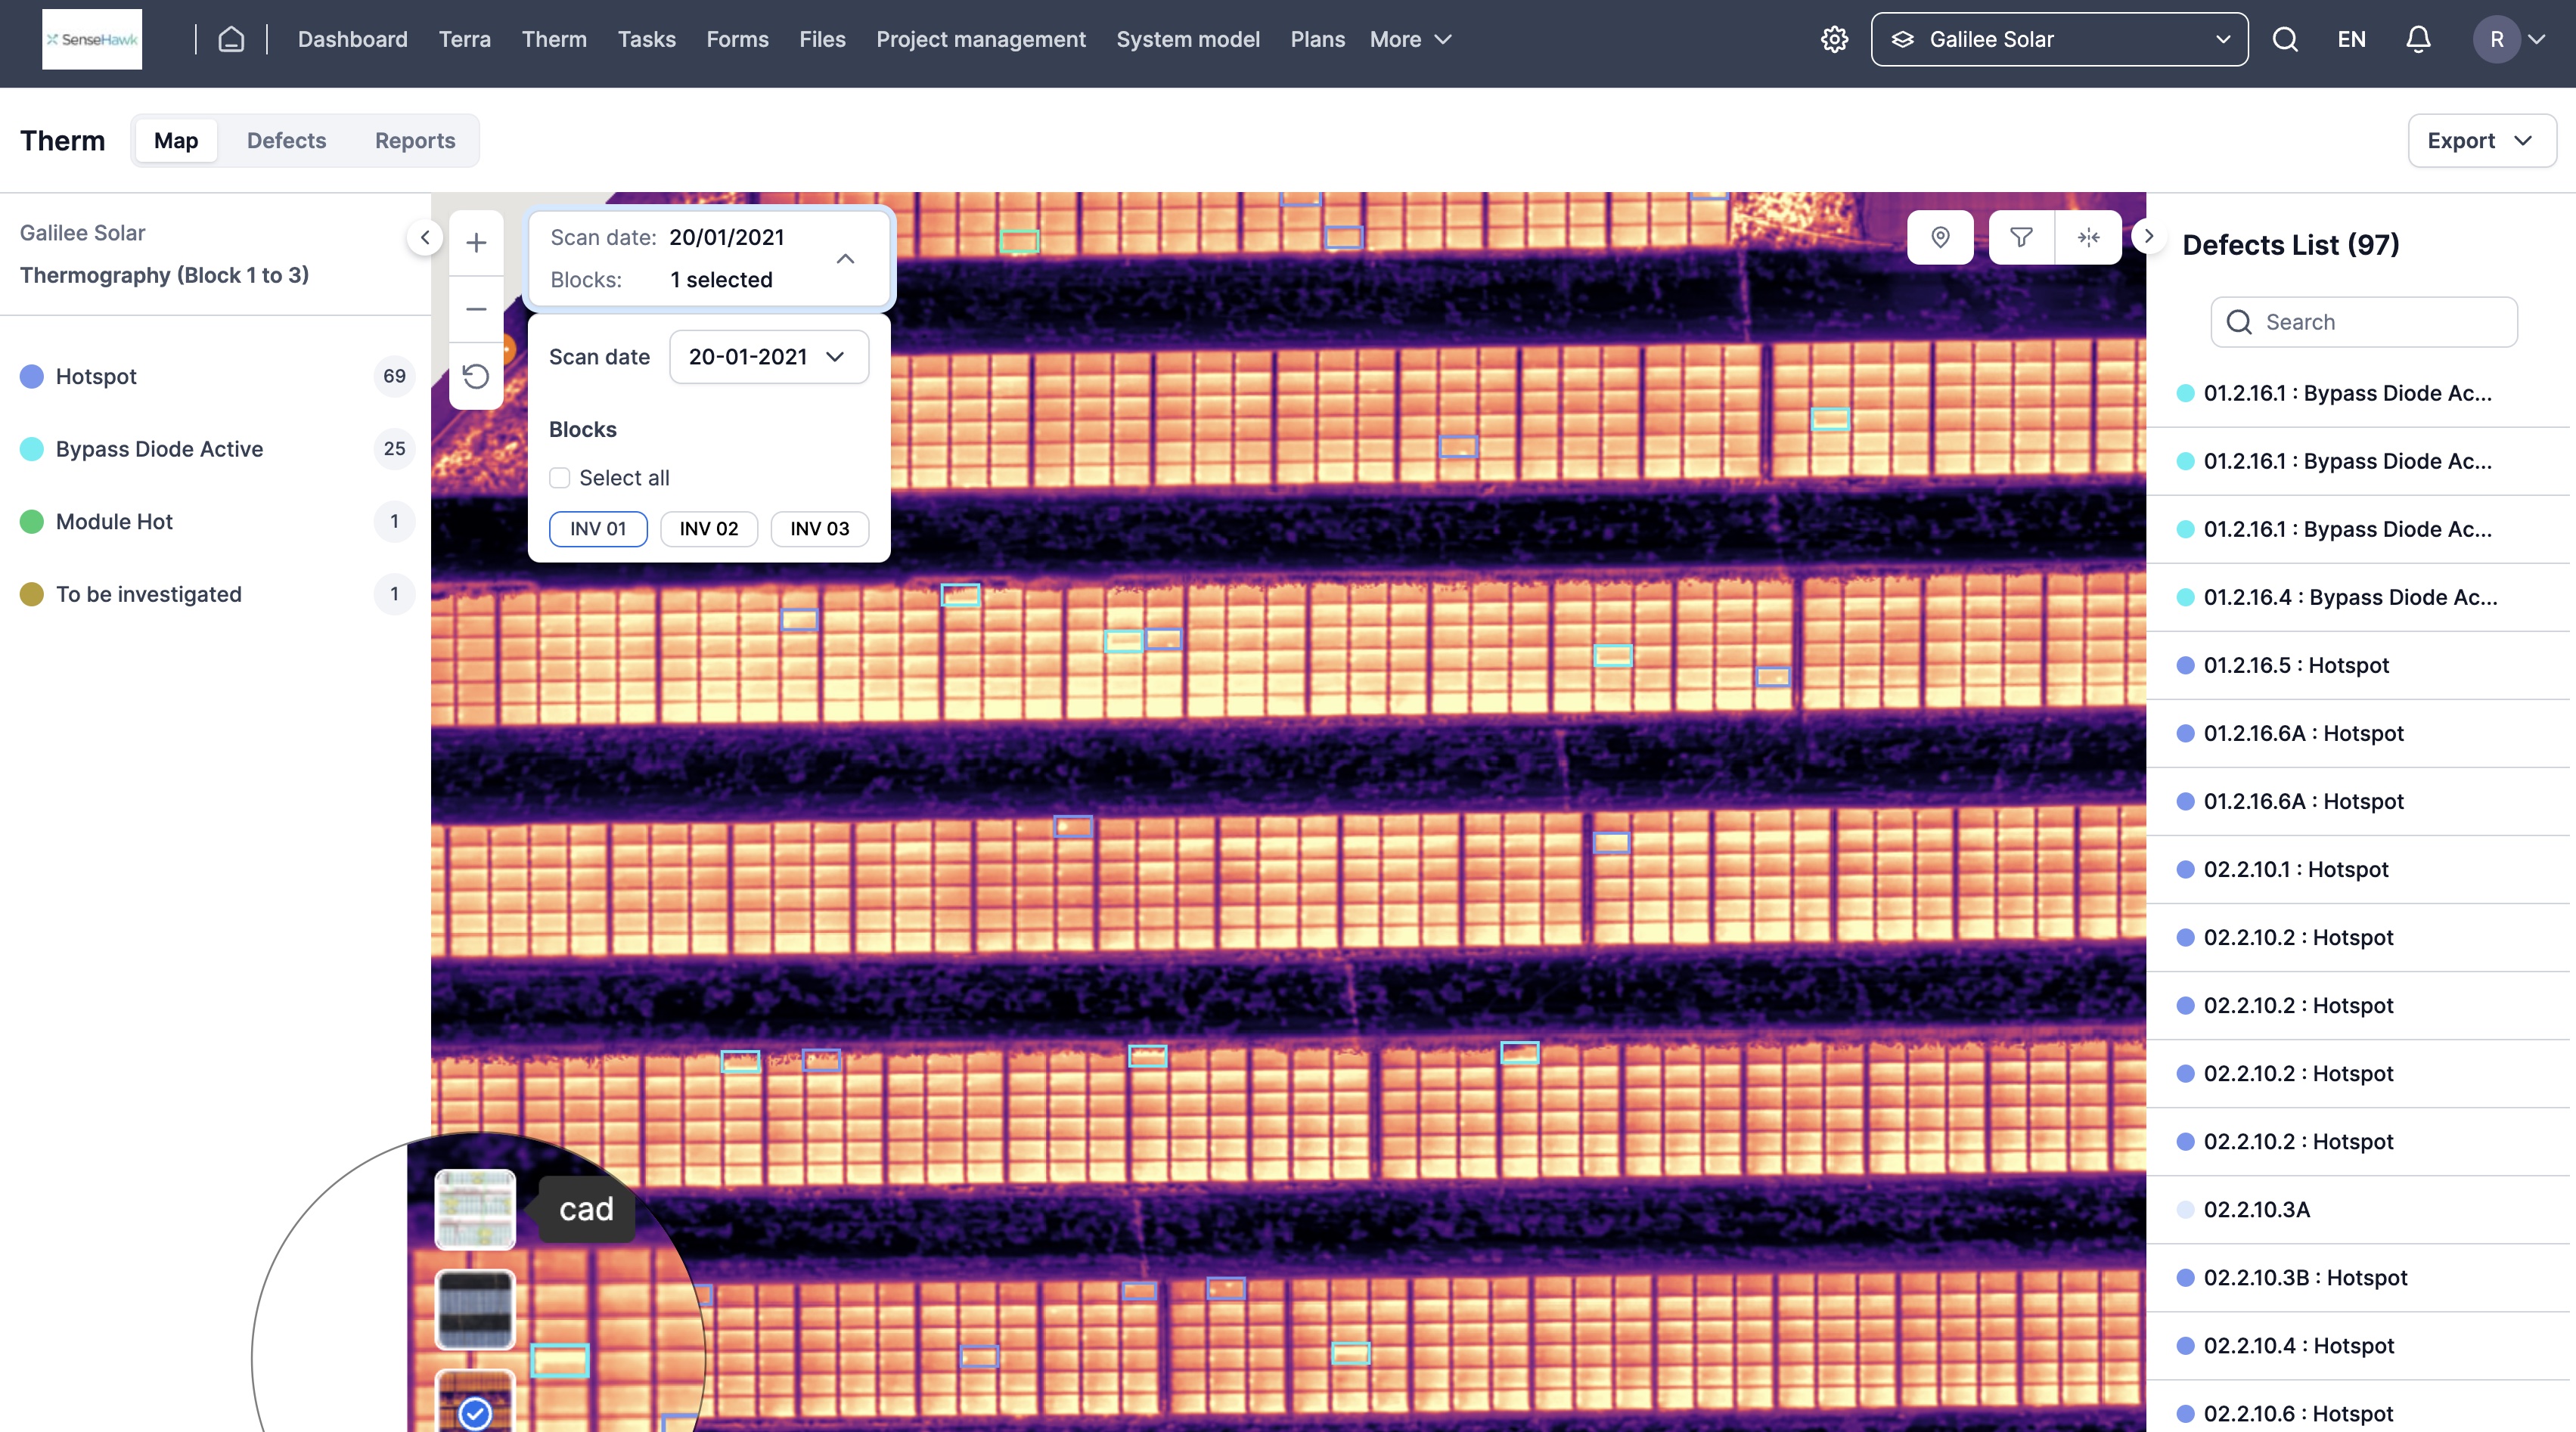
To view the visual map and the AutoCAD layer, just click on the icon at the bottom left of the map. You'll find options like CAD Layout, Visual Layout, and Thermal Layout.
FIGURE 9: MAP LAYOUTS
Defect Details
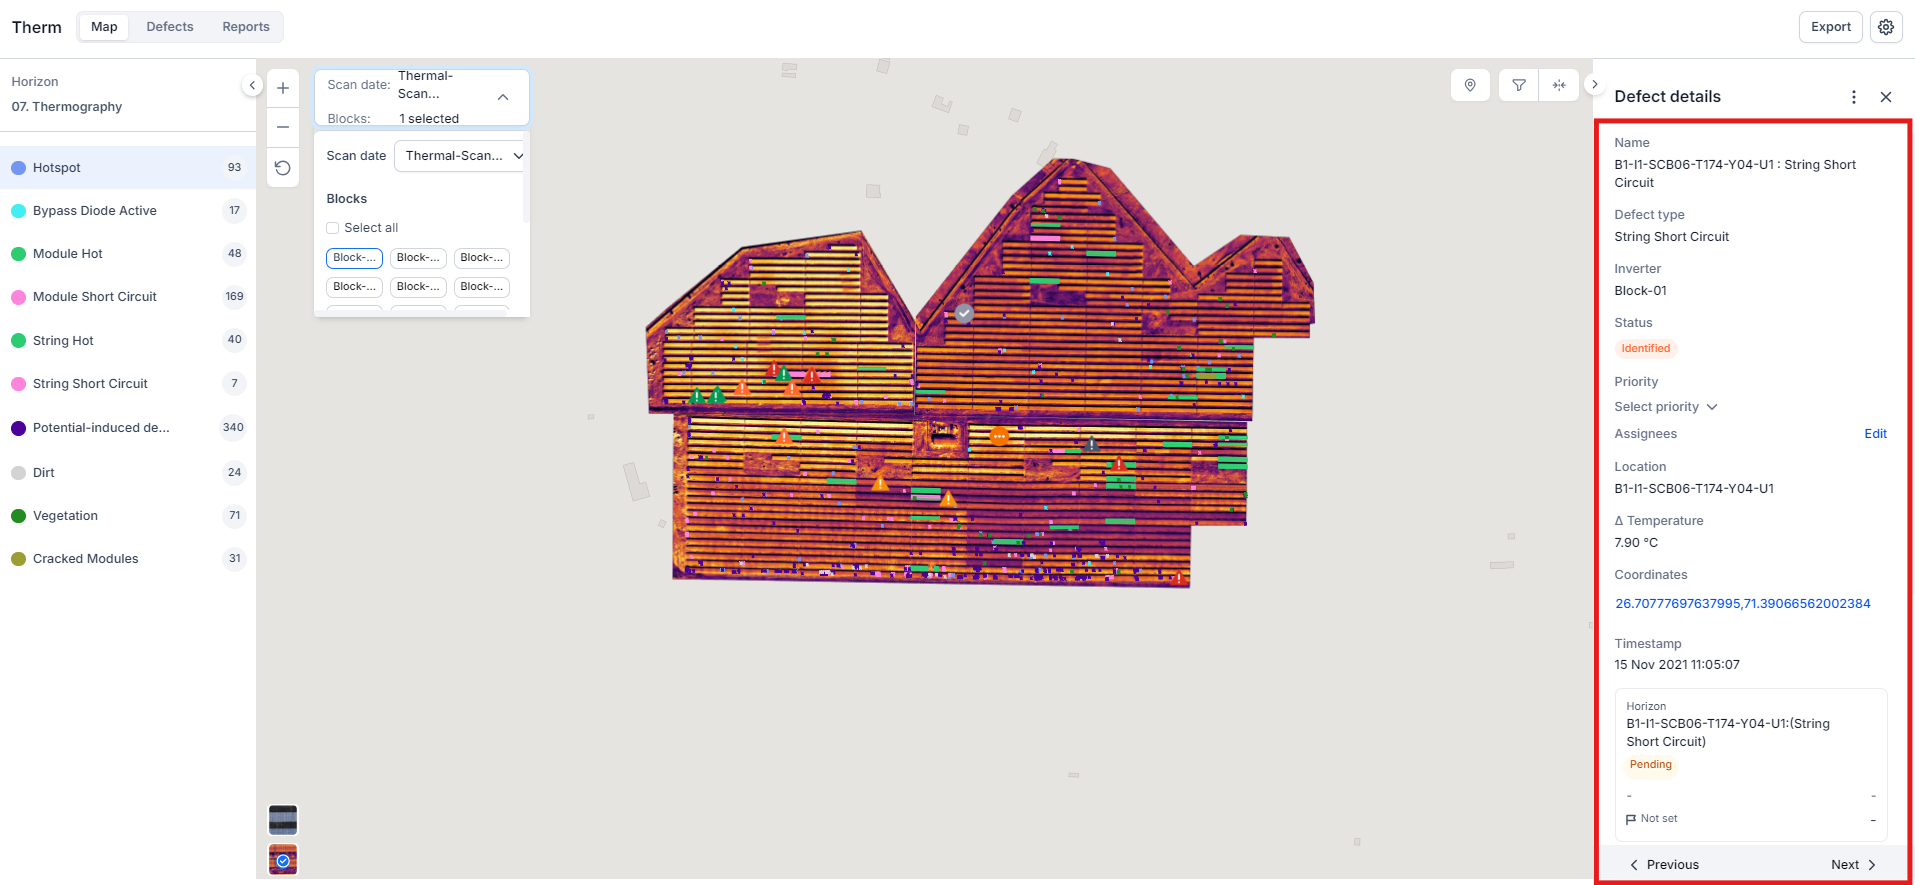
When you click on a defect, you will be taken to its location on the map. The defect details provide helpful information about its status, including Status, Priority, Assignees, Attachments, and notes.
Status
Let's ensure that each defect has the current status. We have some commonly used pre-set status options. These status options also have a clear identifier on the map, which is colour-coded for easier reference.
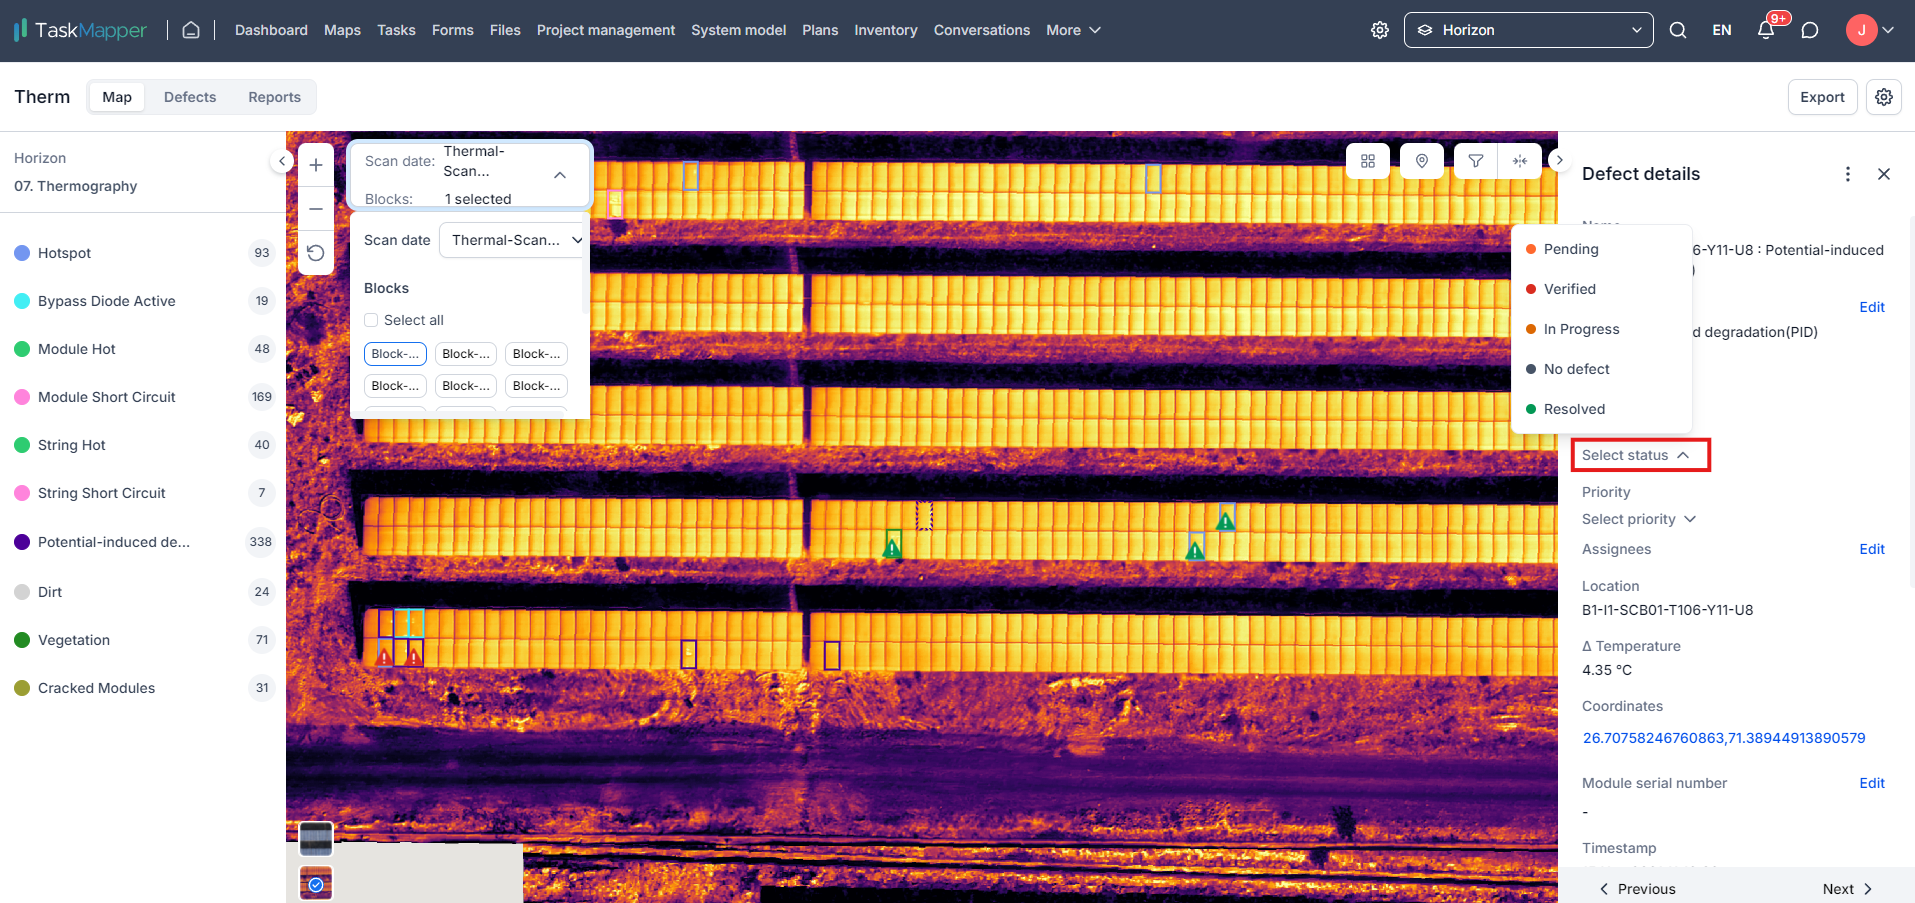
FIGURE 10: STATUS
Assignees
If a specific defect needs more attention or on-site fixing, you can assign it to individual users or teams for further investigation or action.
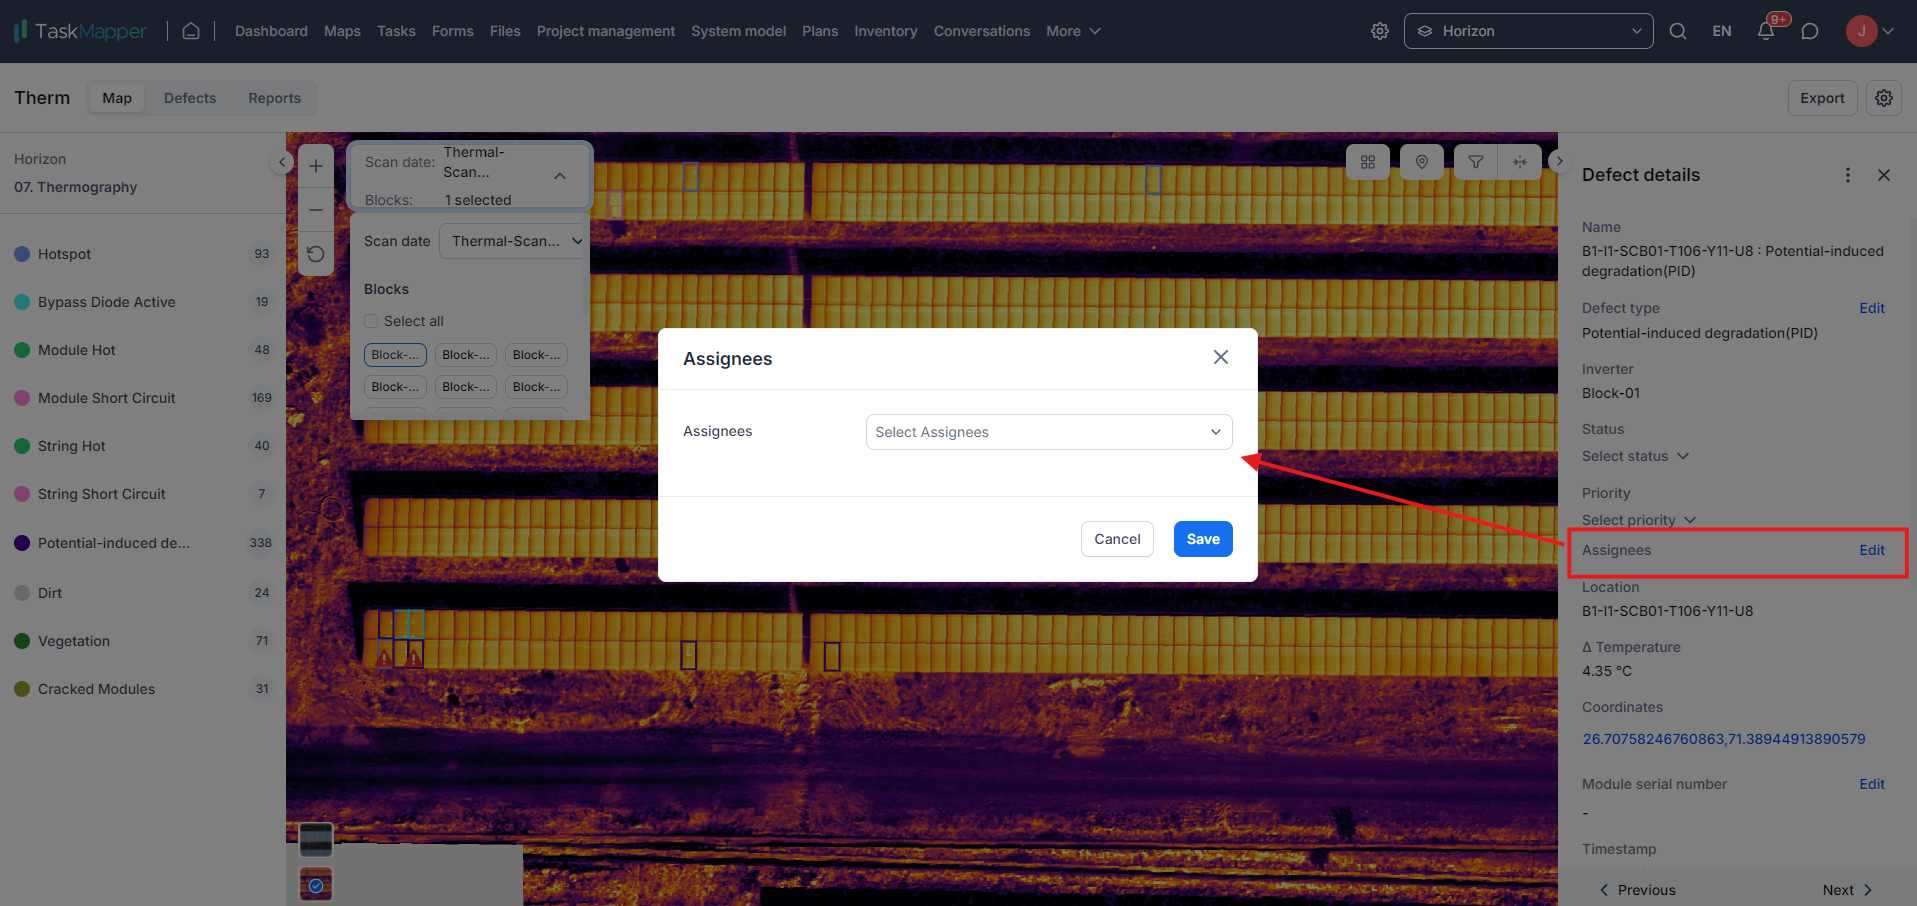
FIGURE 11: ASSIGNEES
Priority
To help with the remediation process, the defects can be assigned a priority. This allows us to focus on fixing the most important issues first.
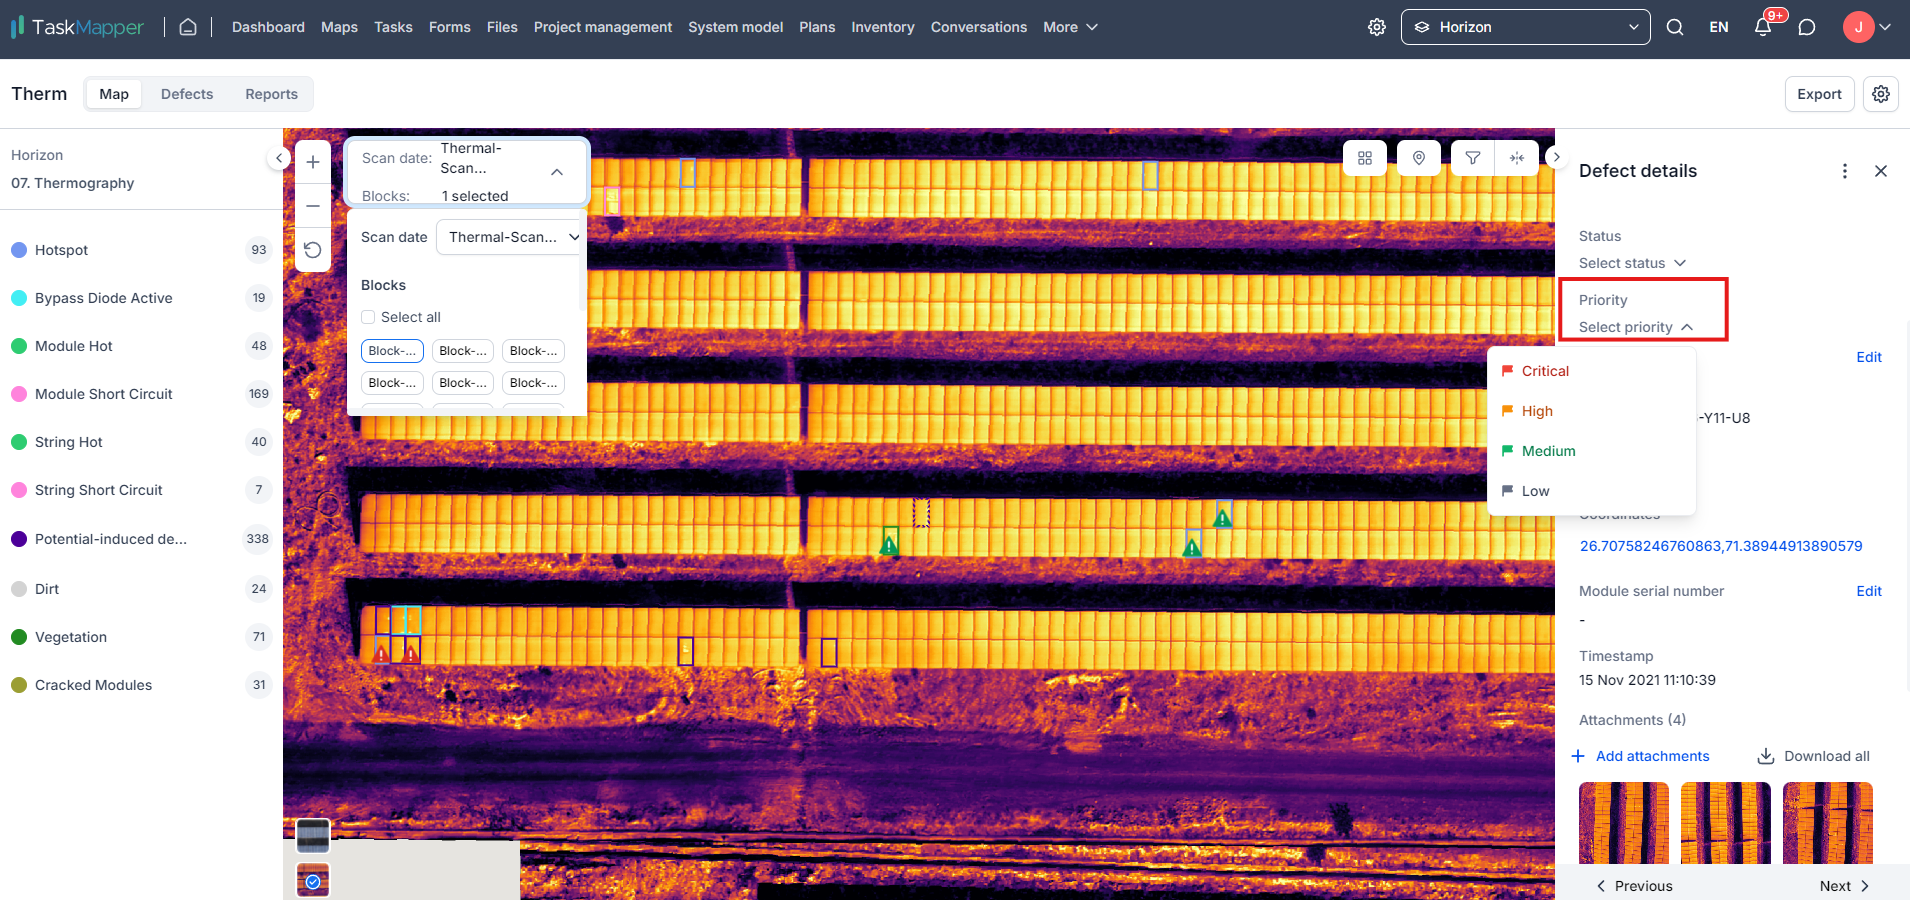
FIGURE 12: PRIORITY
Defects Re-classification
Administrator access is necessary to complete this action.
If you need to reclassify any defects, it's easy! Click 'Edit' and choose the specific defect from the drop-down list.
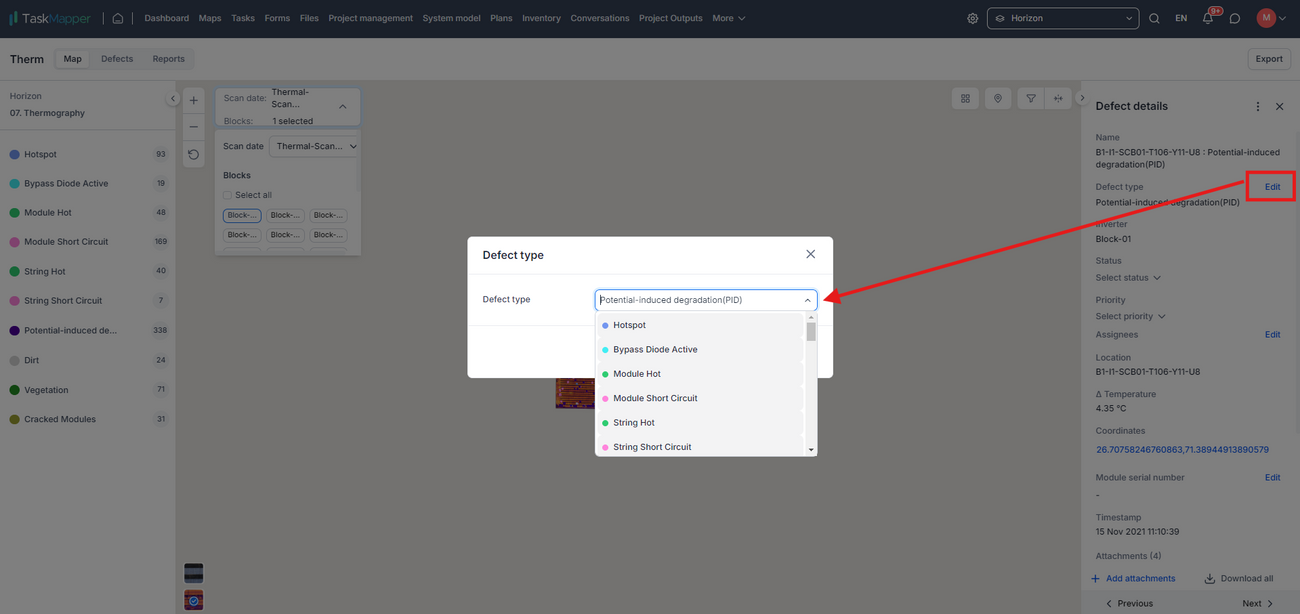
FIGURE 13: Defects Re-Classification
Attachments and Notes
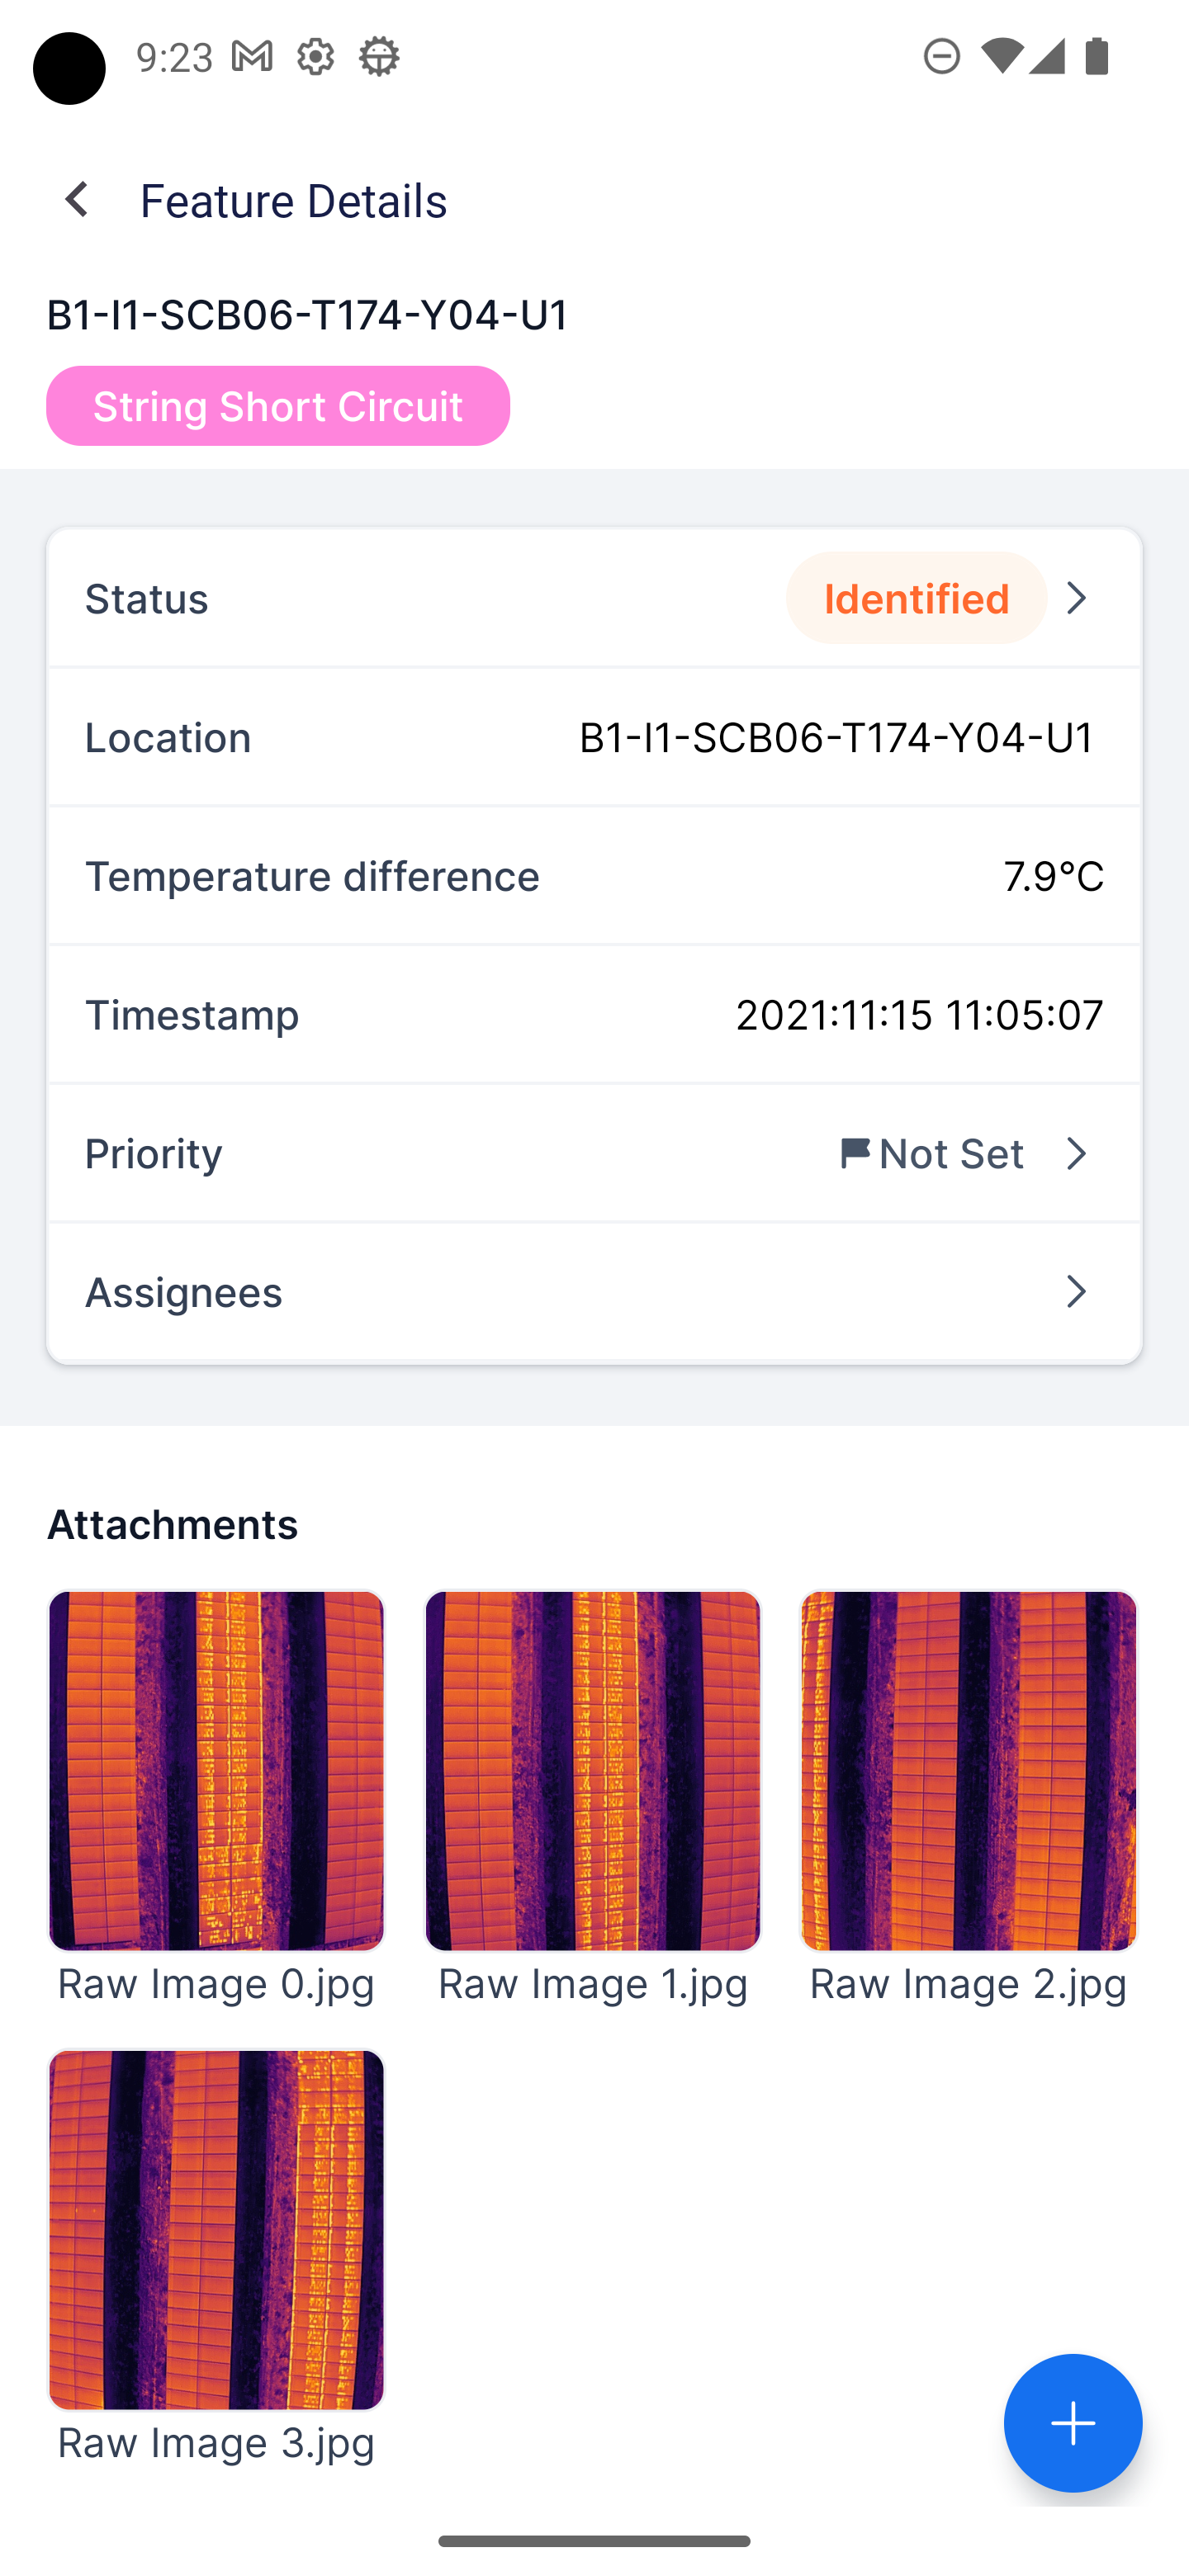
In the attachments section, you'll find the raw images of the defects, along with a marker to help you spot the heat signature easily. You can upload your evidence or information in any format. Also, you can use the notes section to input information and even include attachments if you'd like.
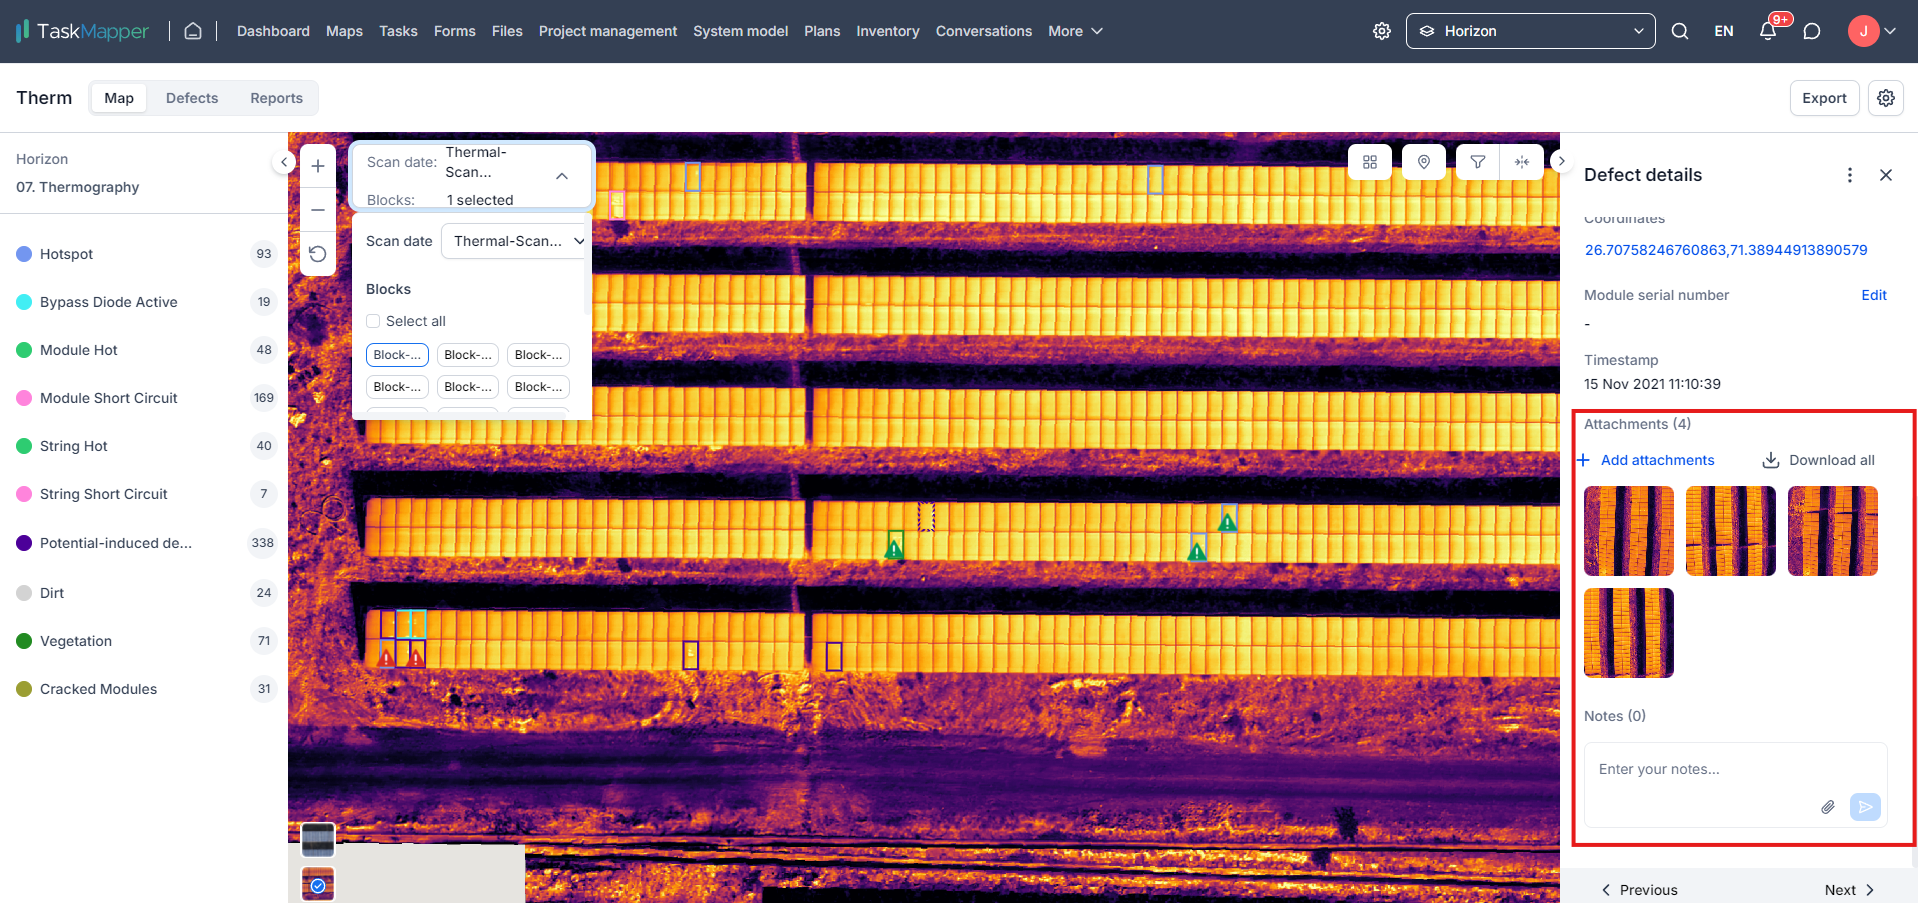
FIGURE 14: NOTES & ATTACHMENTS
Reports & Therm Dashboard
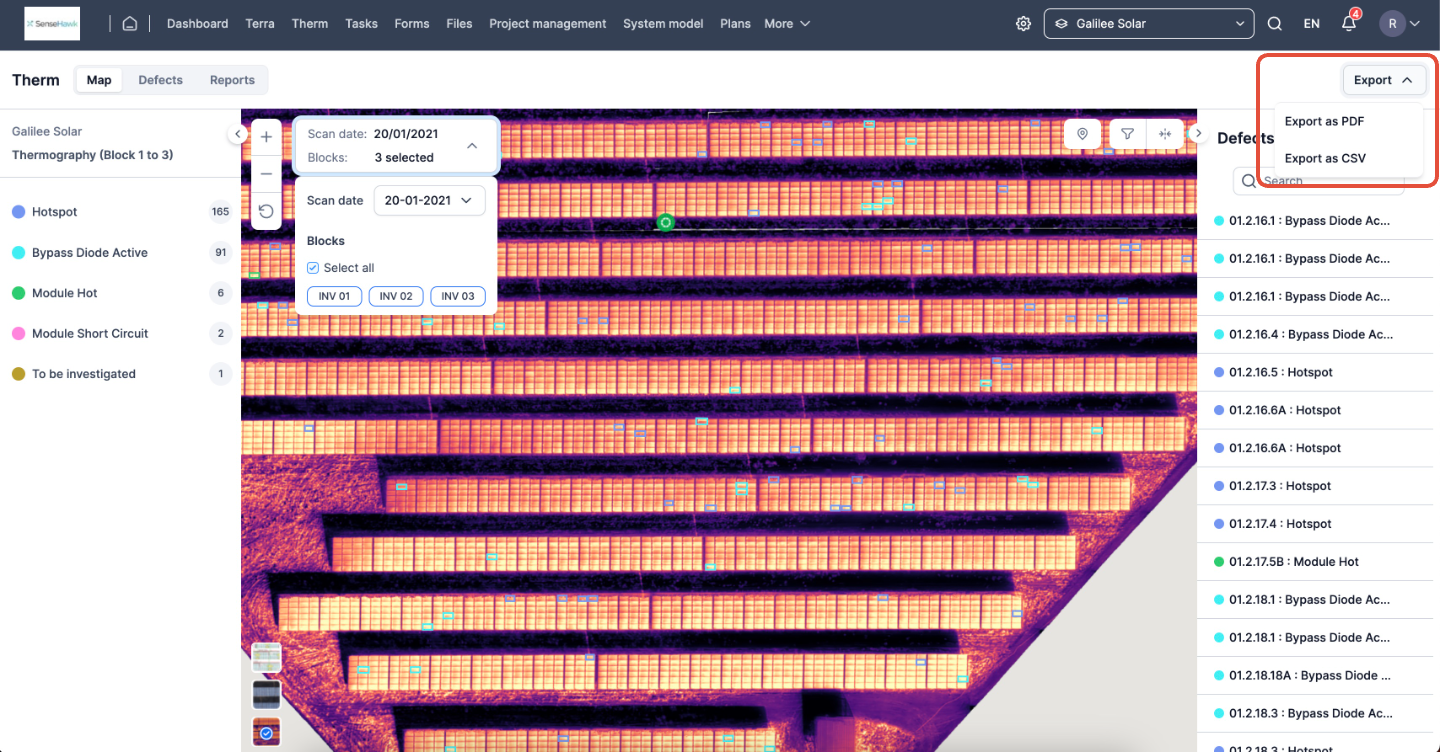
Export
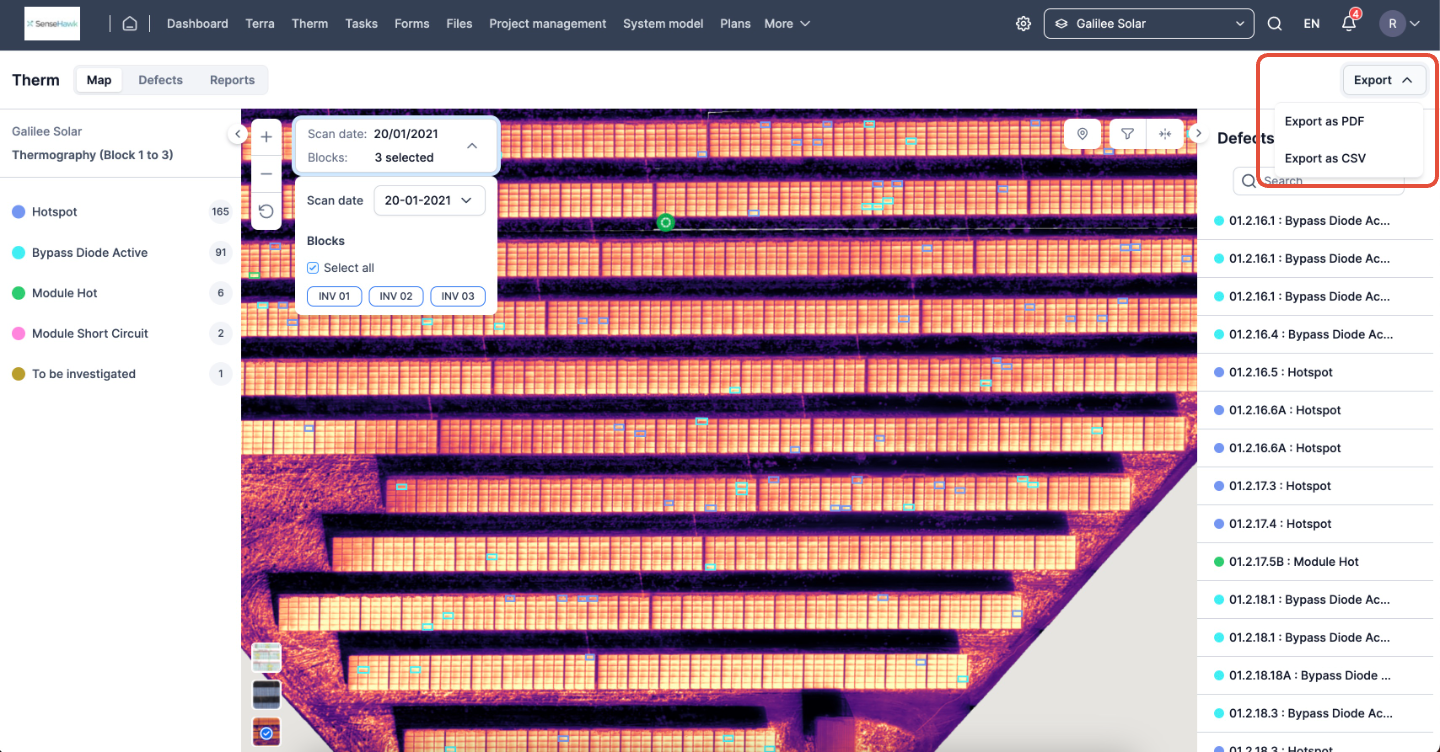
To export a Therm report, click the 'Export' button and select your preferred format—'Export as PDF' or 'Export as CSV'. This will allow you to download the report in the best format.
Figure 15: Export
Export Options
When exporting to PDF, you can choose what to include or exclude in the report. You can check or uncheck options like raw images and manually added attachments, notes, and tasks.
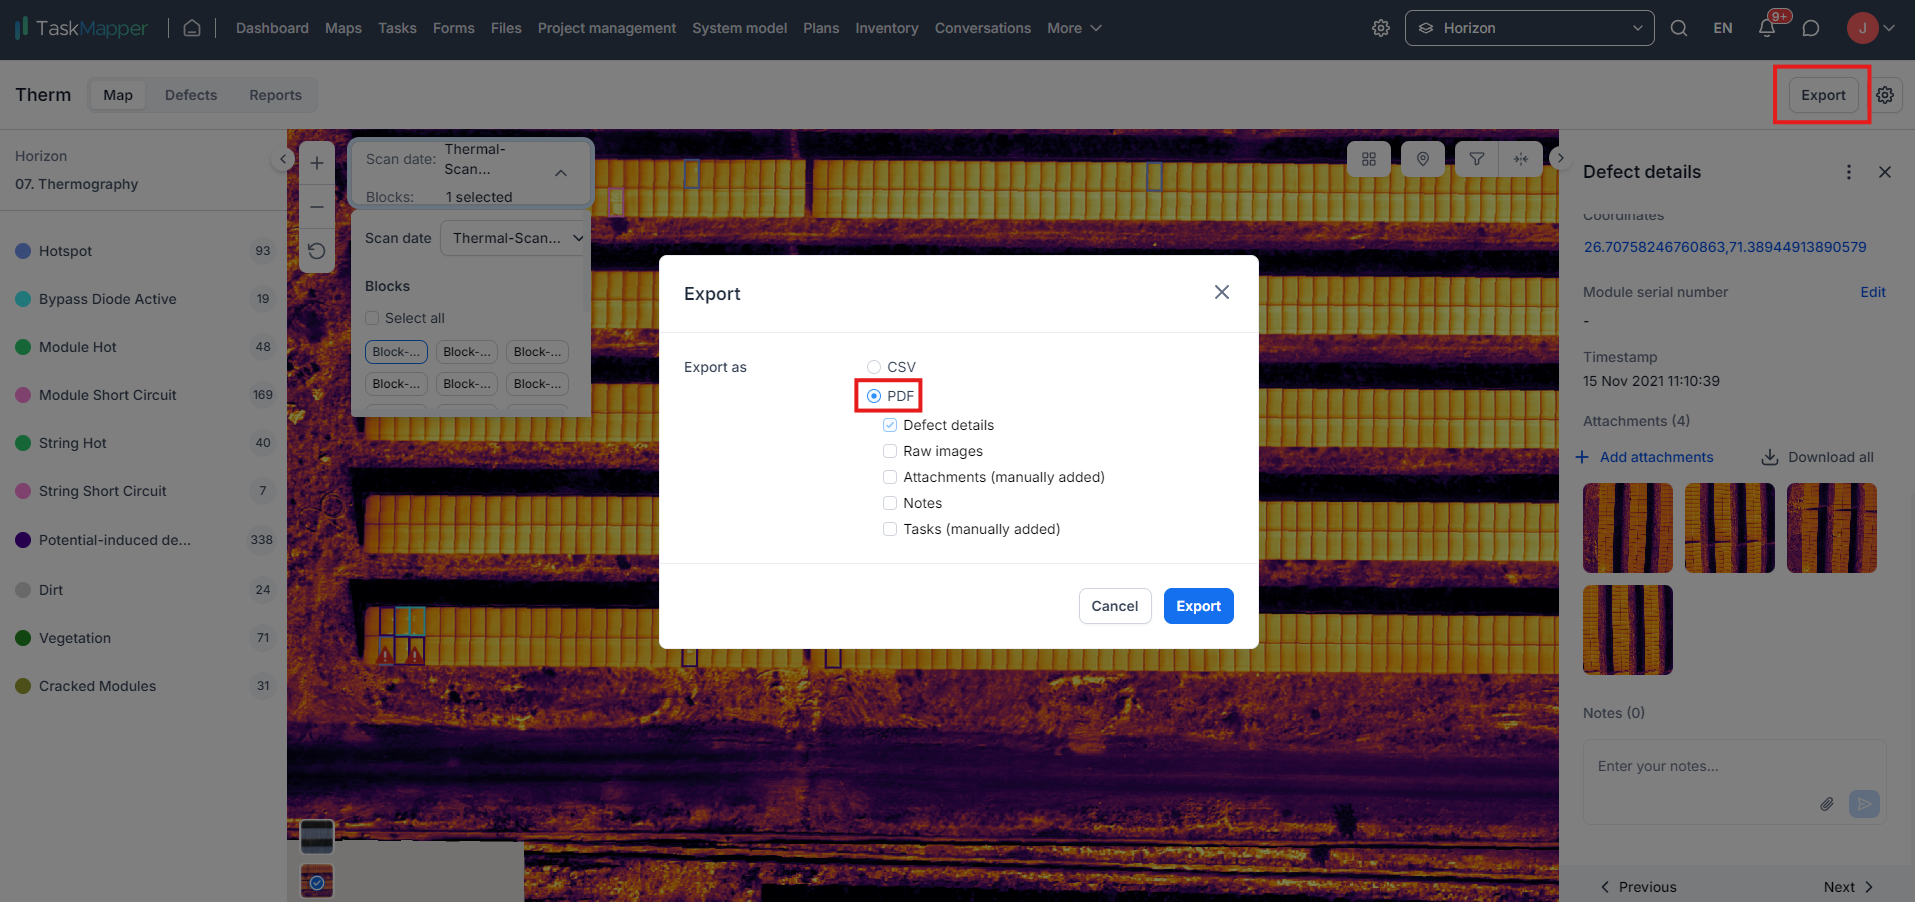
FIGURE 16: EXPORT OPTIONS
Therm Dashboard
The therm dashboard gives a high-level overview of the impact and resolution status of defects across the site
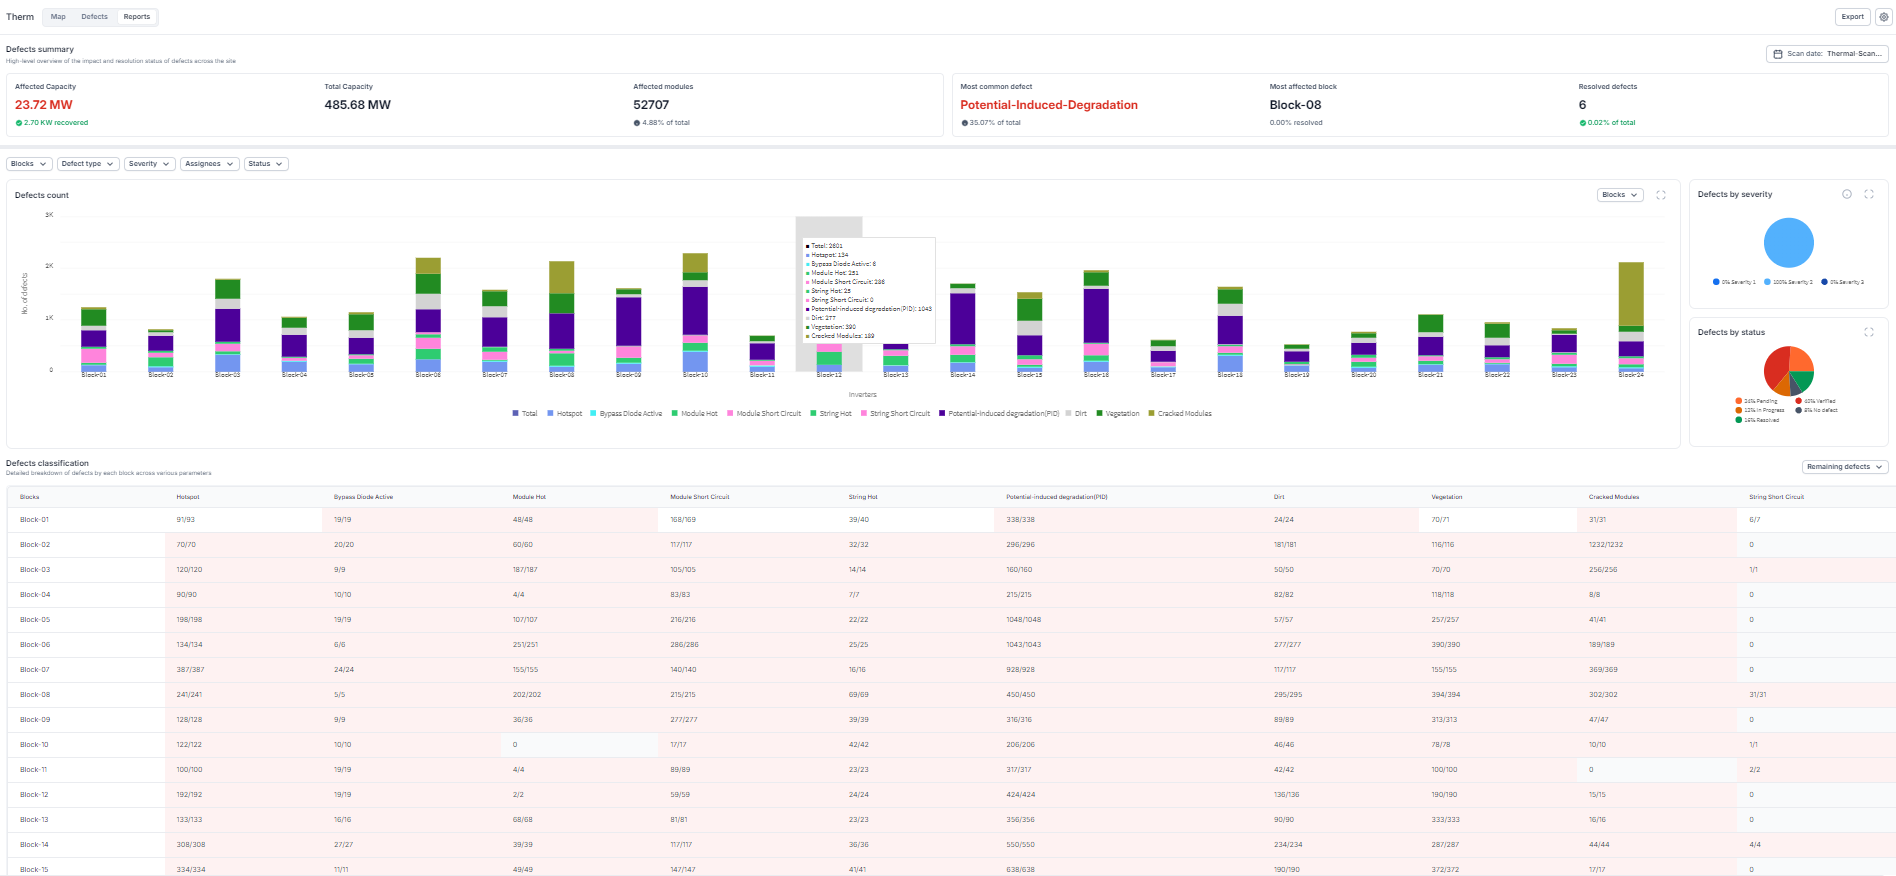
FIGURE 17: THERM DASHBOARD
Therm Report - Defects classification
The defects classification section in the therm report describes each defect's status. When a defect is marked as 'No Issues' or 'Resolved,' the total counts and the affected capacity are updated automatically. For instance, take a look at the screenshot below (Figure 18)—under the defect called "Hotspot," there are 93 defects in total and 2 of those have been resolved.

FIGURE 18: Defect's status
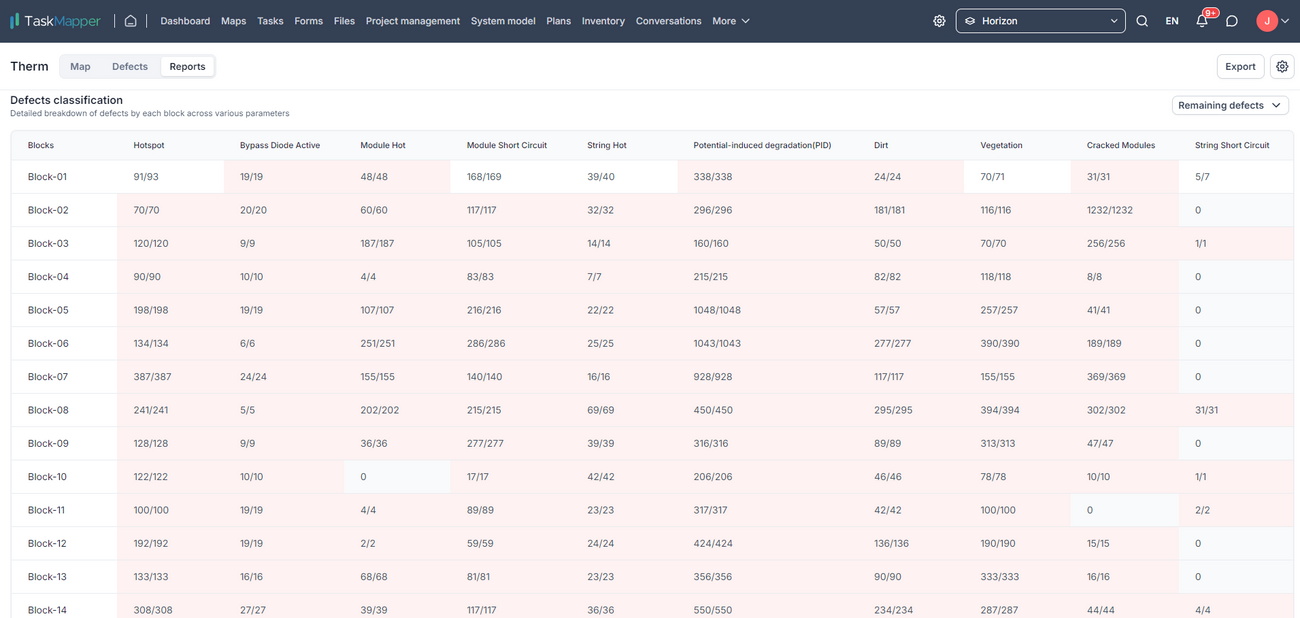
FIGURE 19: Defects classification
TaskMapper Productivity Suite
We've now integrated the productivity suite with the defect tracking system to simplify the remediation process. You can create tasks and checklists and then assign them to field teams. Click here to read more about Tasks.
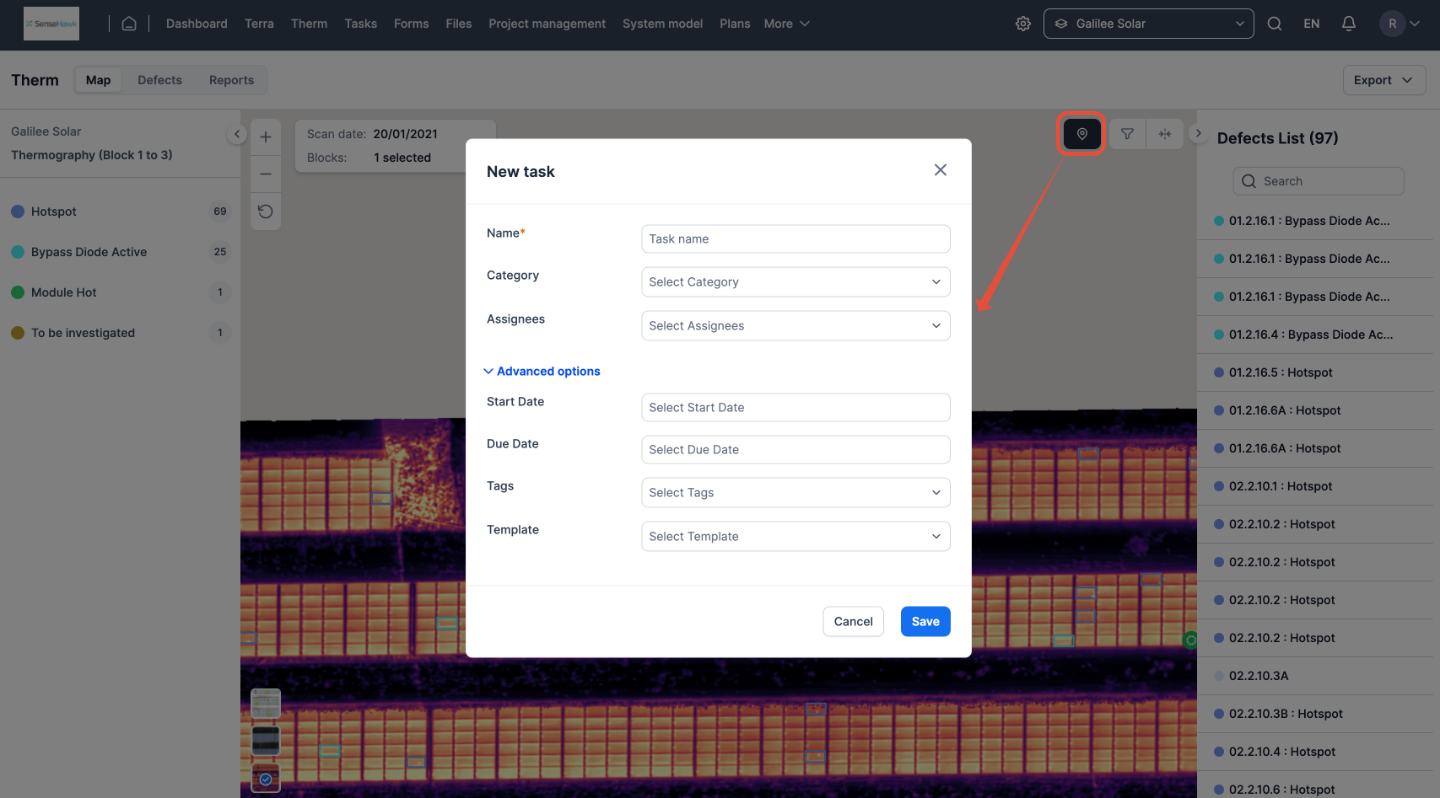
FIGURE 20: CREATING A TASK ON THE MAP VIEW
Quickly create tasks on the map view using the "Add Task" marker tool. These tasks can include details such as an assignee, due date, status, and more. Plus, the manually created task will have geo-location details, making it easy for field personnel to locate it on the site.
FIGURE 21: ADDING A TASK ON THE MAP VIEW
Mobile Application To Remediate Defects
1. To install the TaskMapper application on your mobile device, click on the relevant link below
Android app
iOS app
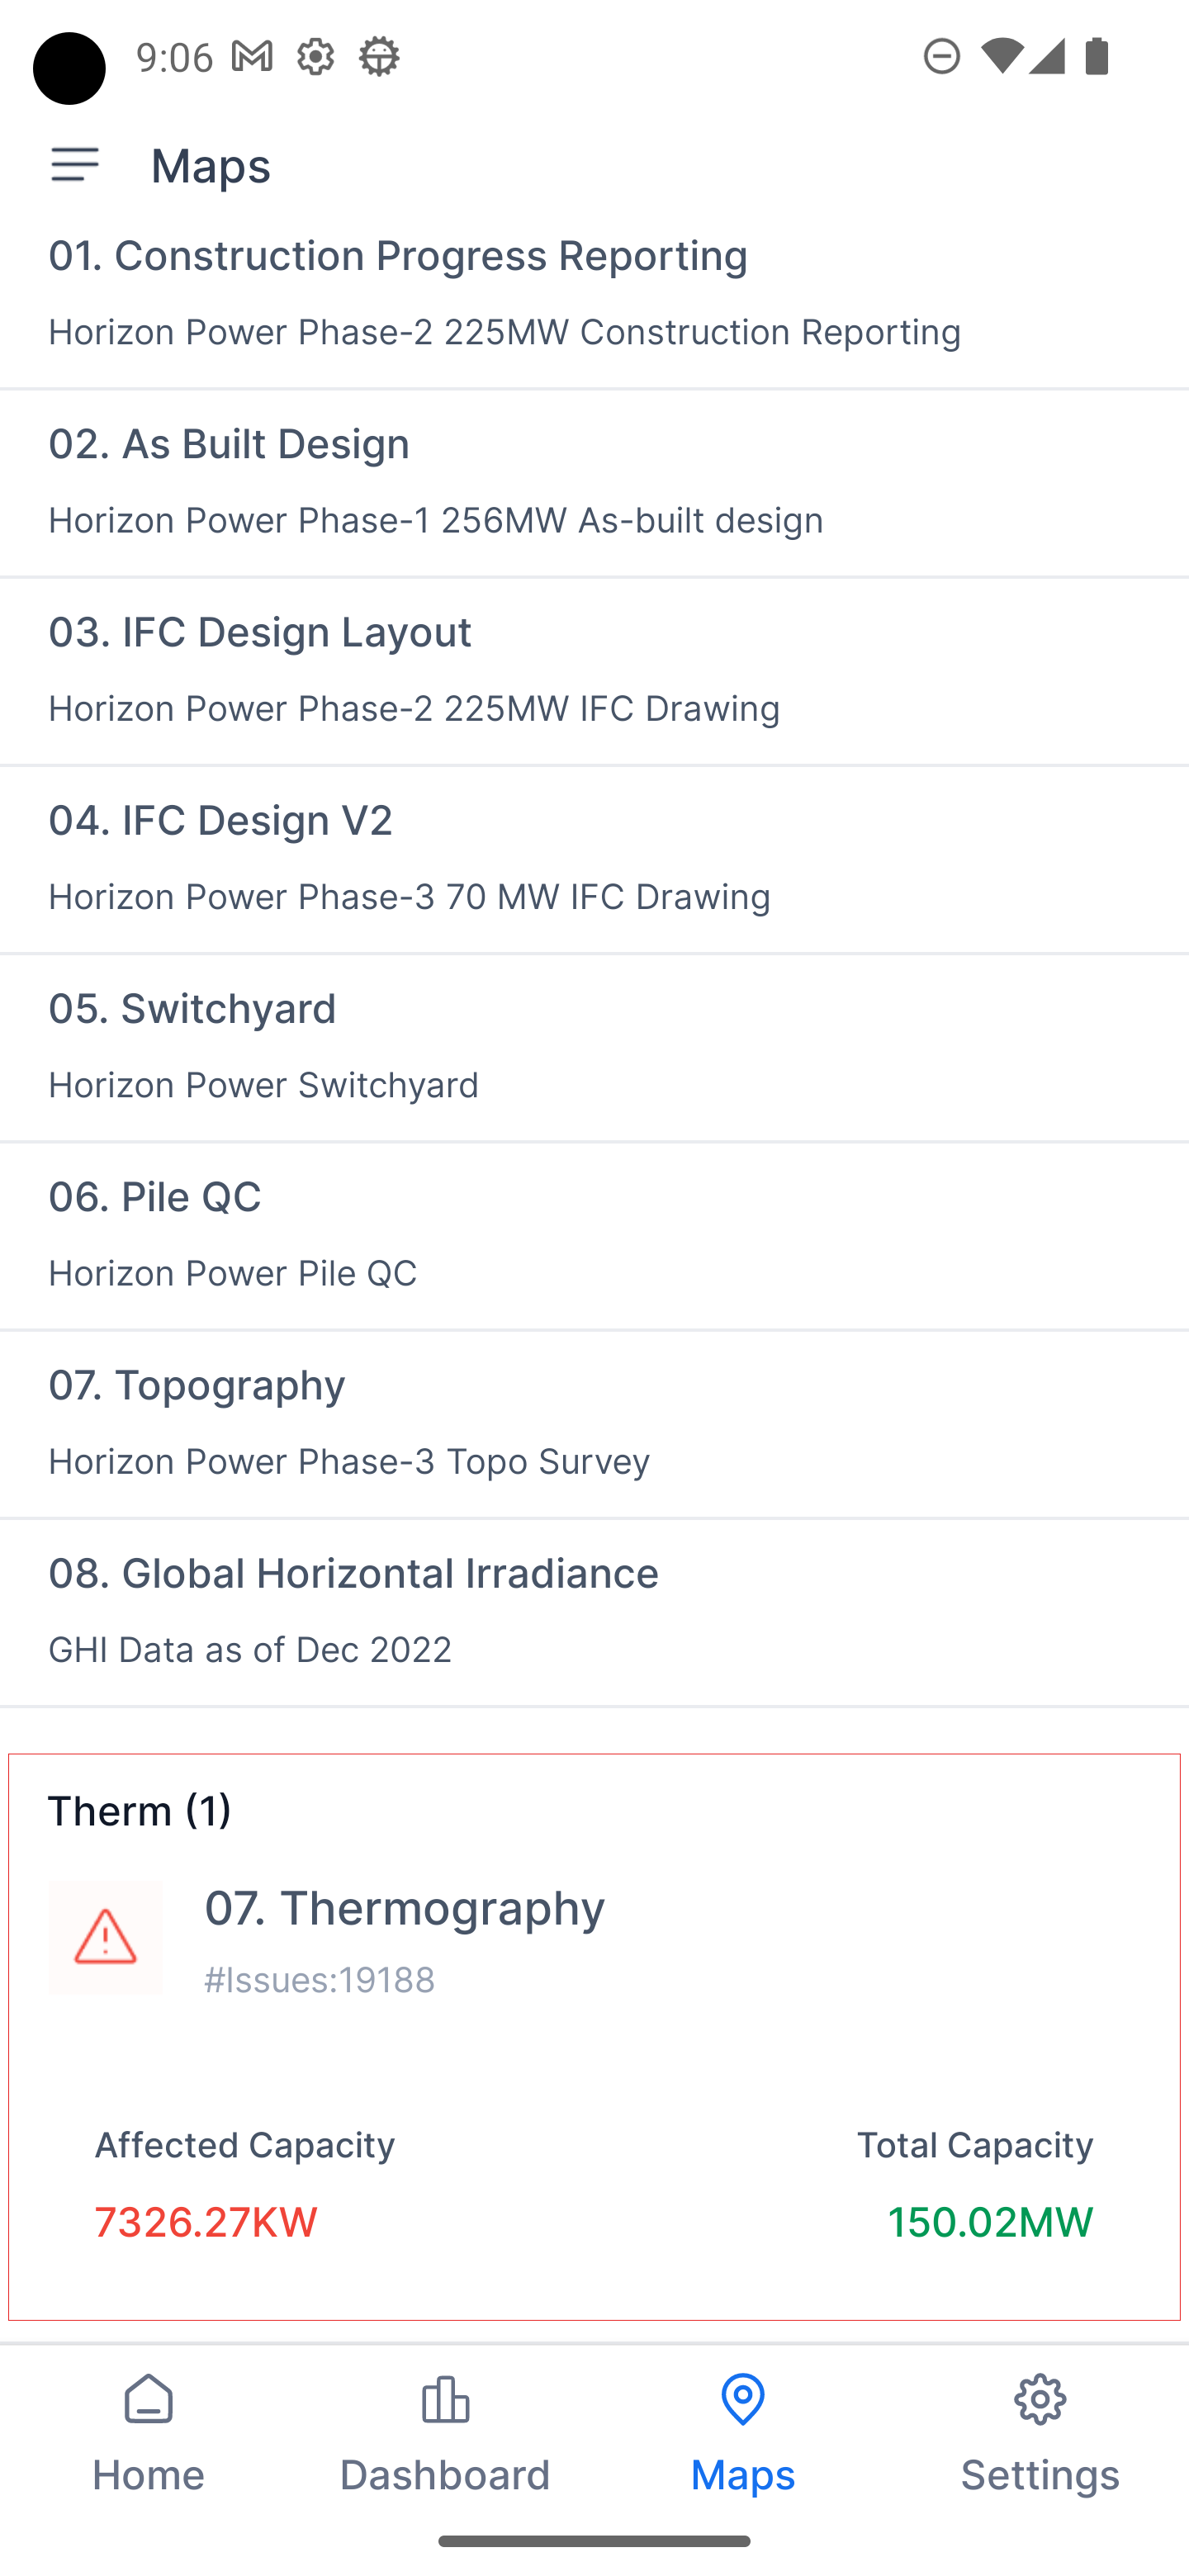
2. To check the asset information, head to the assets page and pick the asset you want (FIGURE 19). The "Therm" section shows the Total Capacity, number of issues, and Affected Capacity. Just click on "Thermography" to access the map.
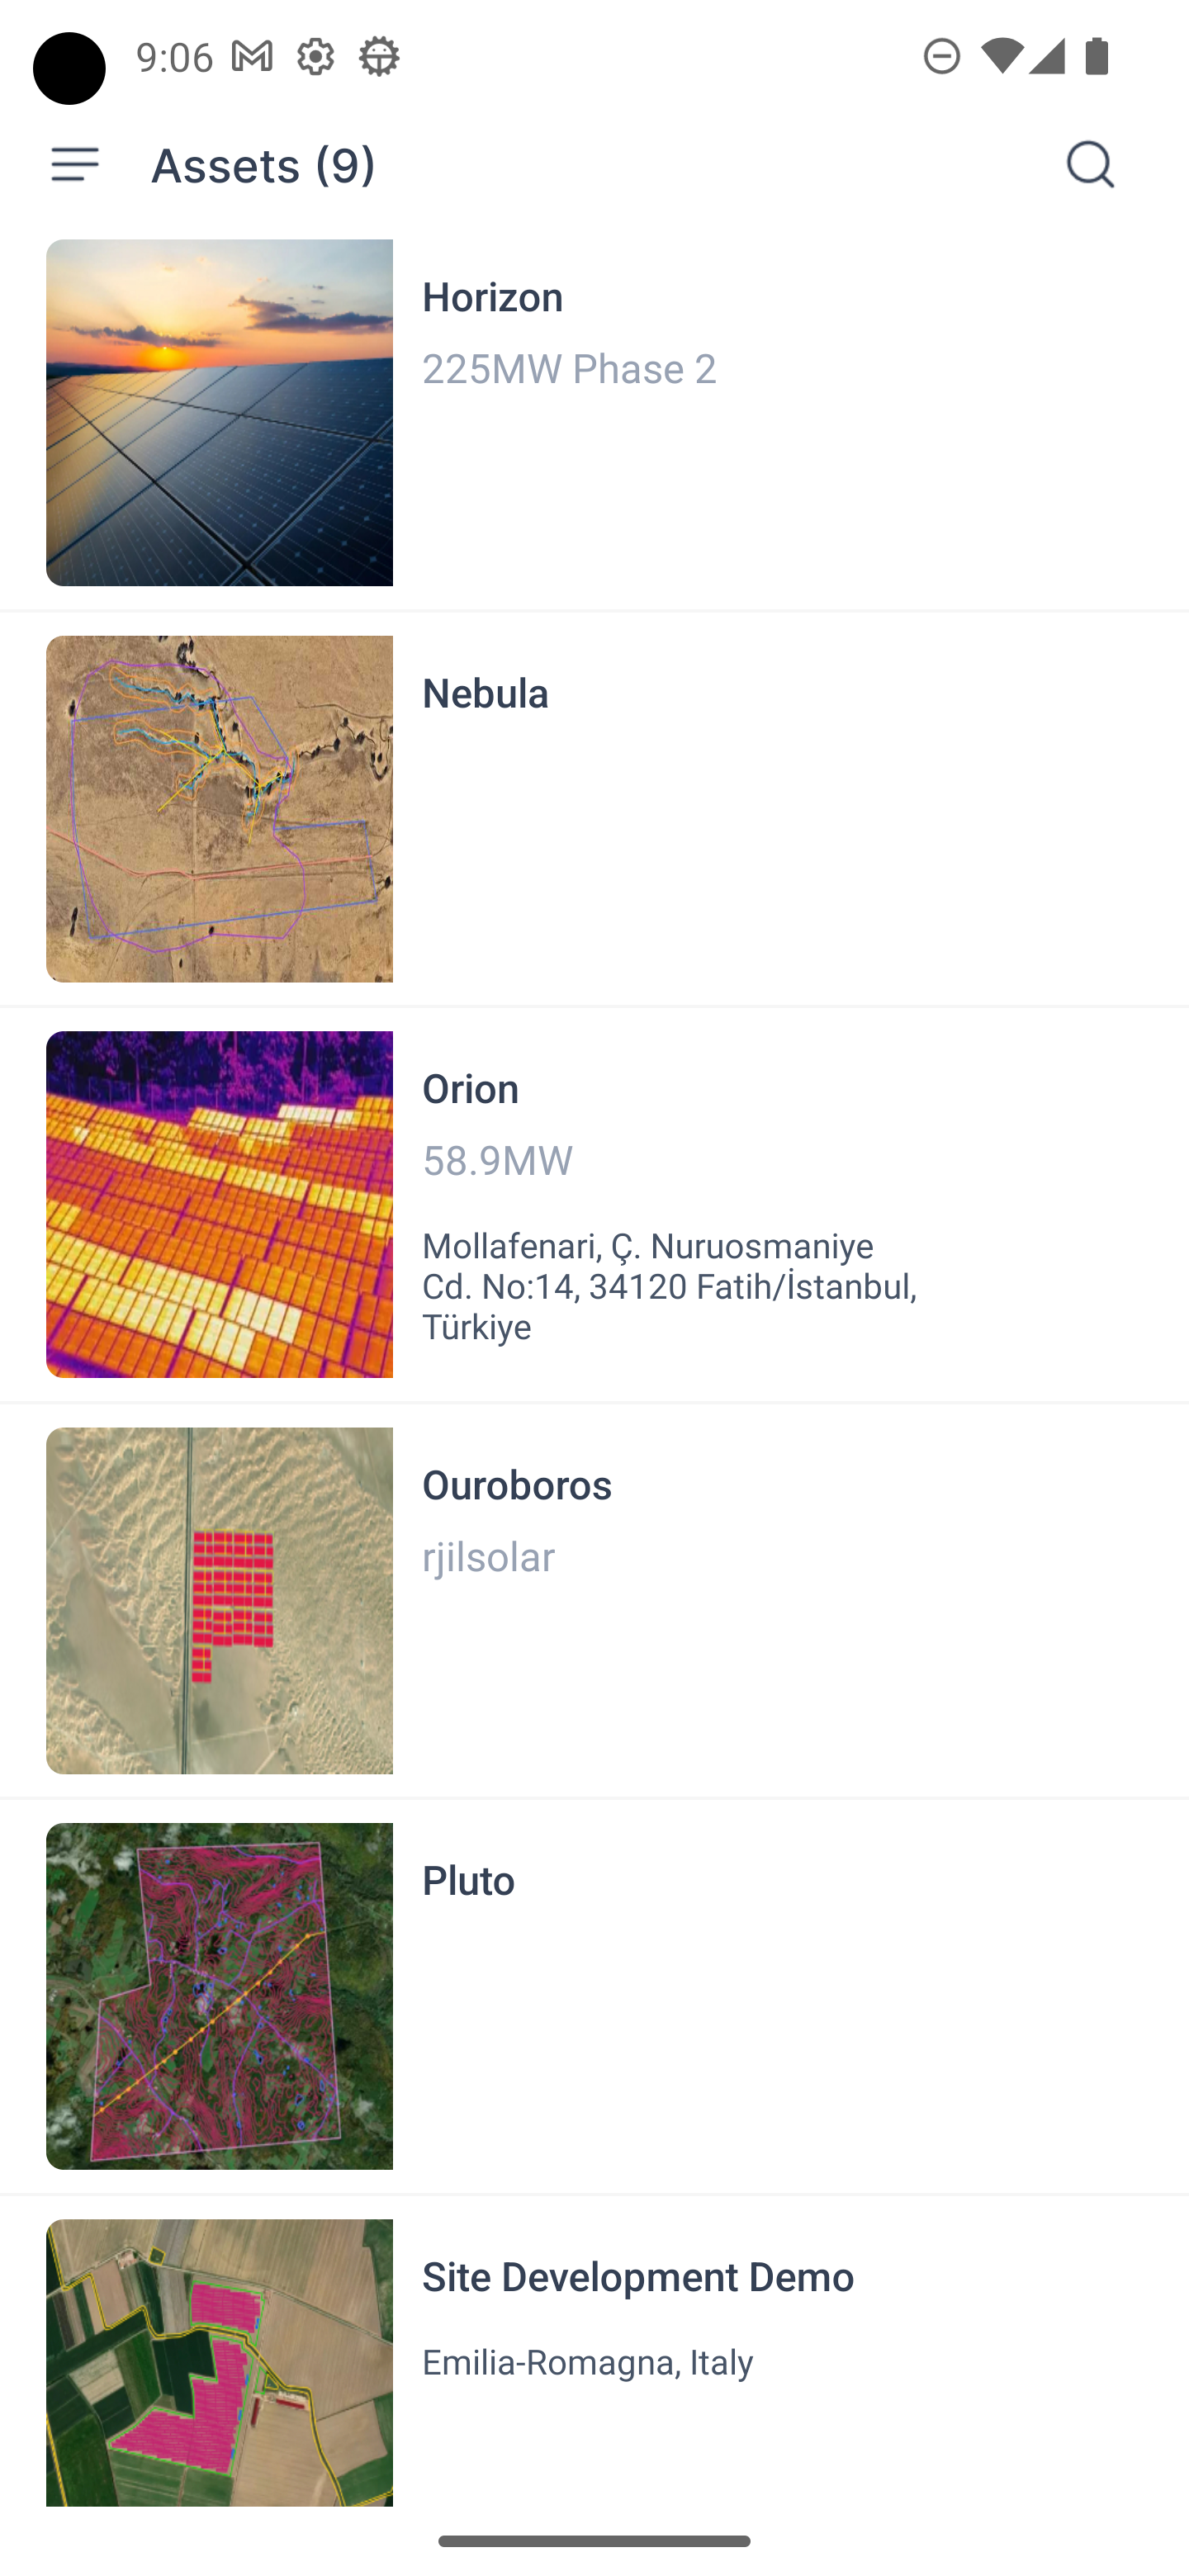
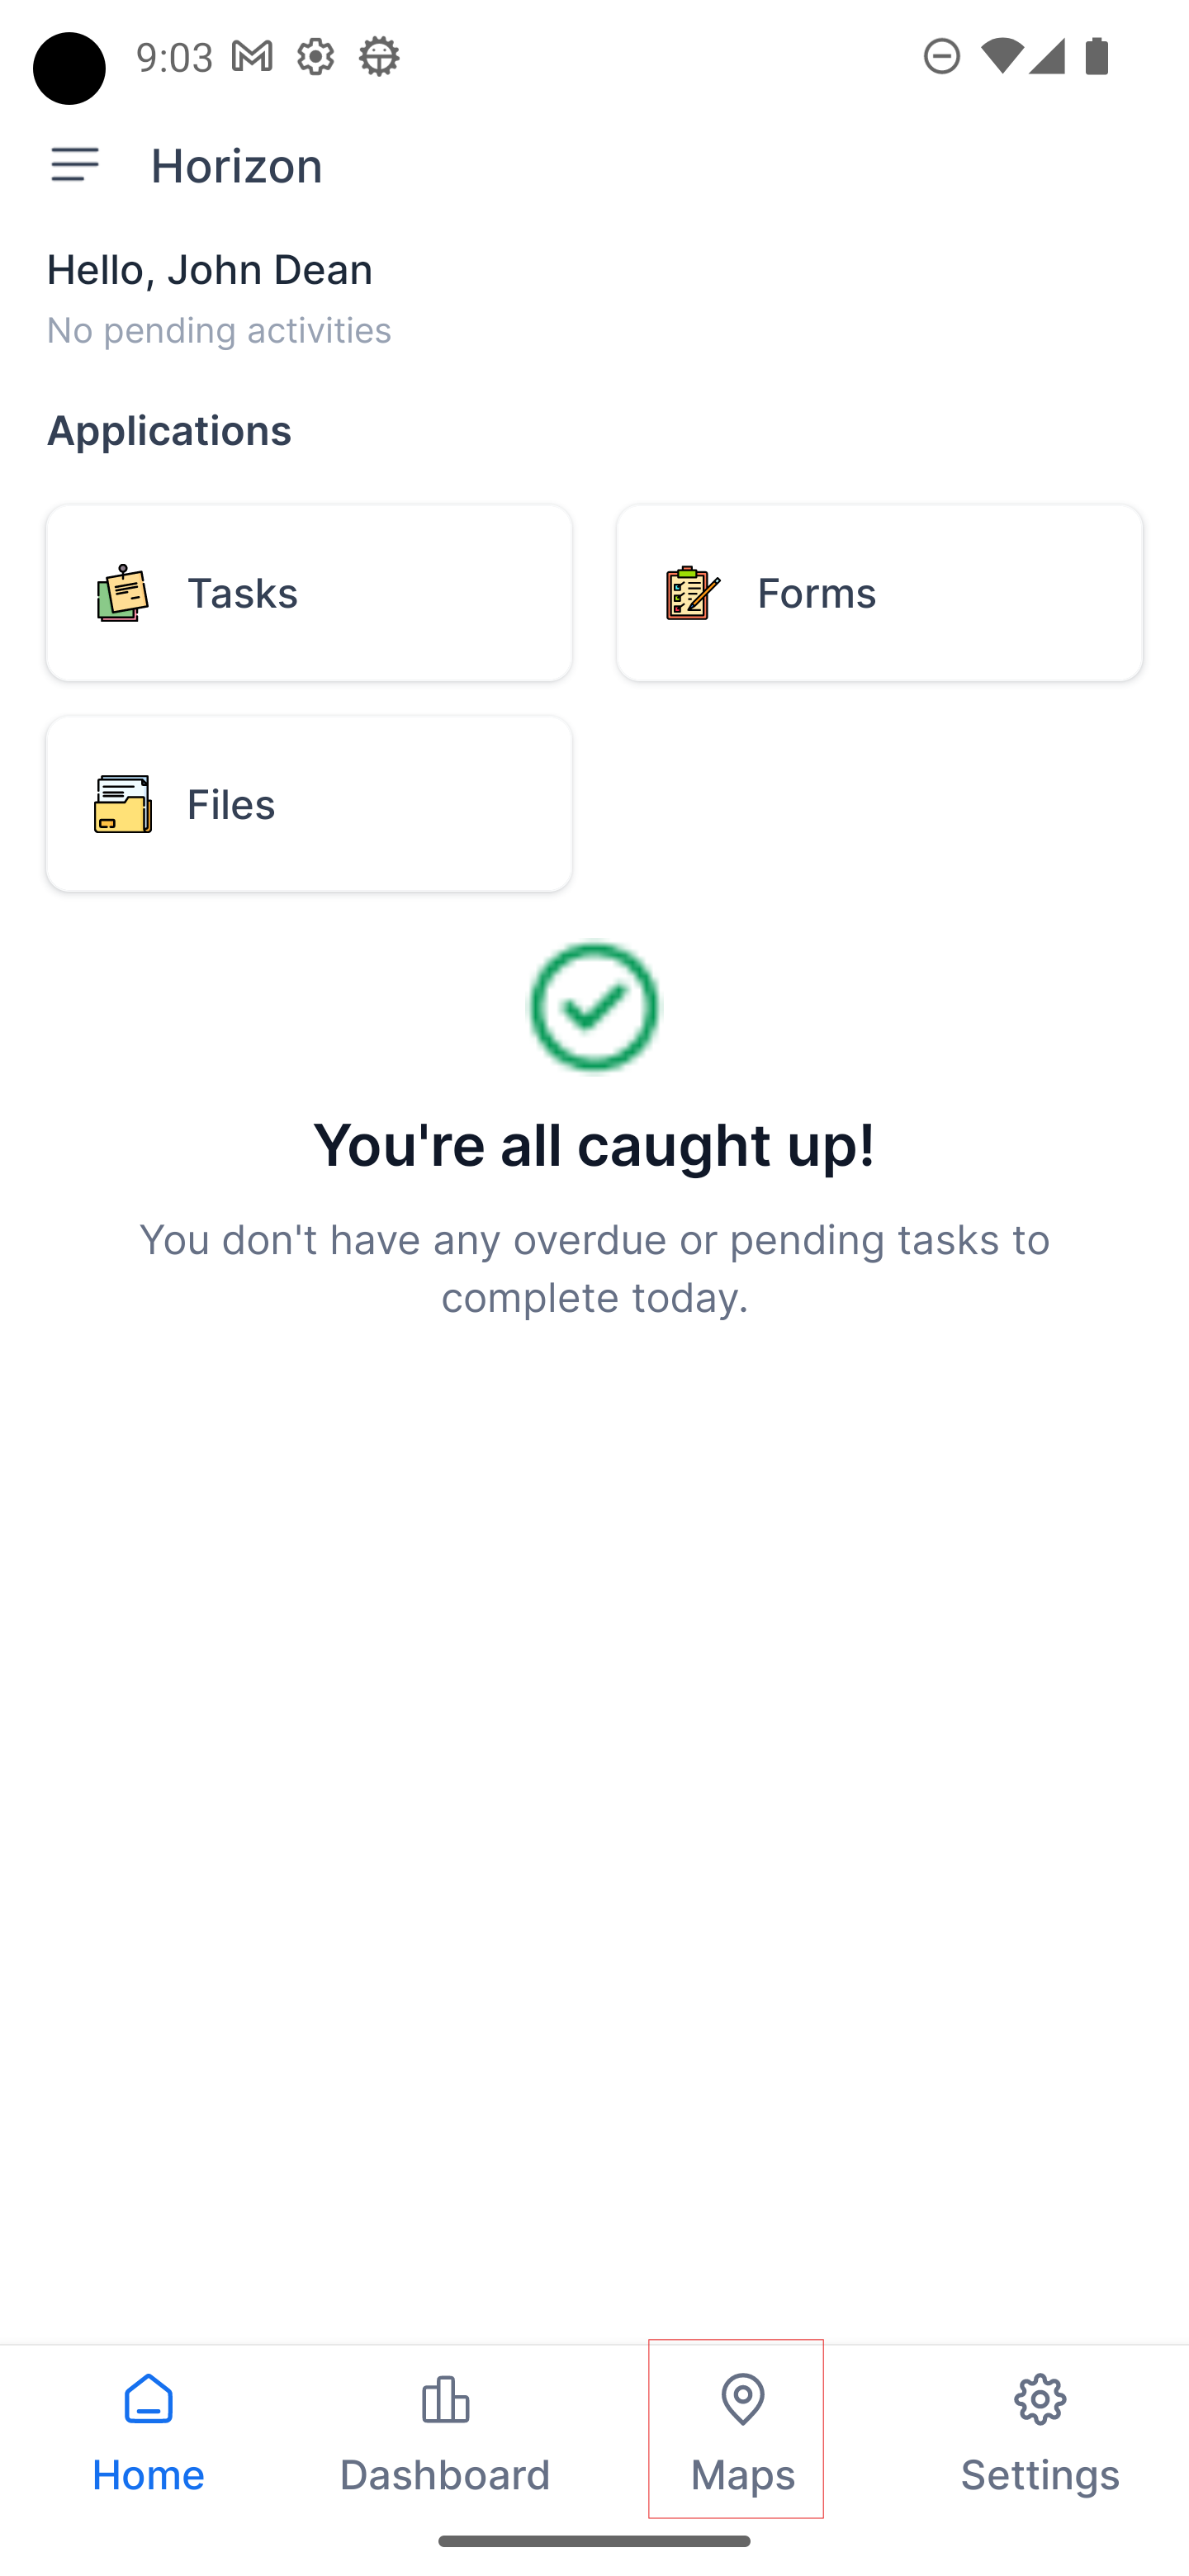
FIGURE 22: ASSETS PAGE
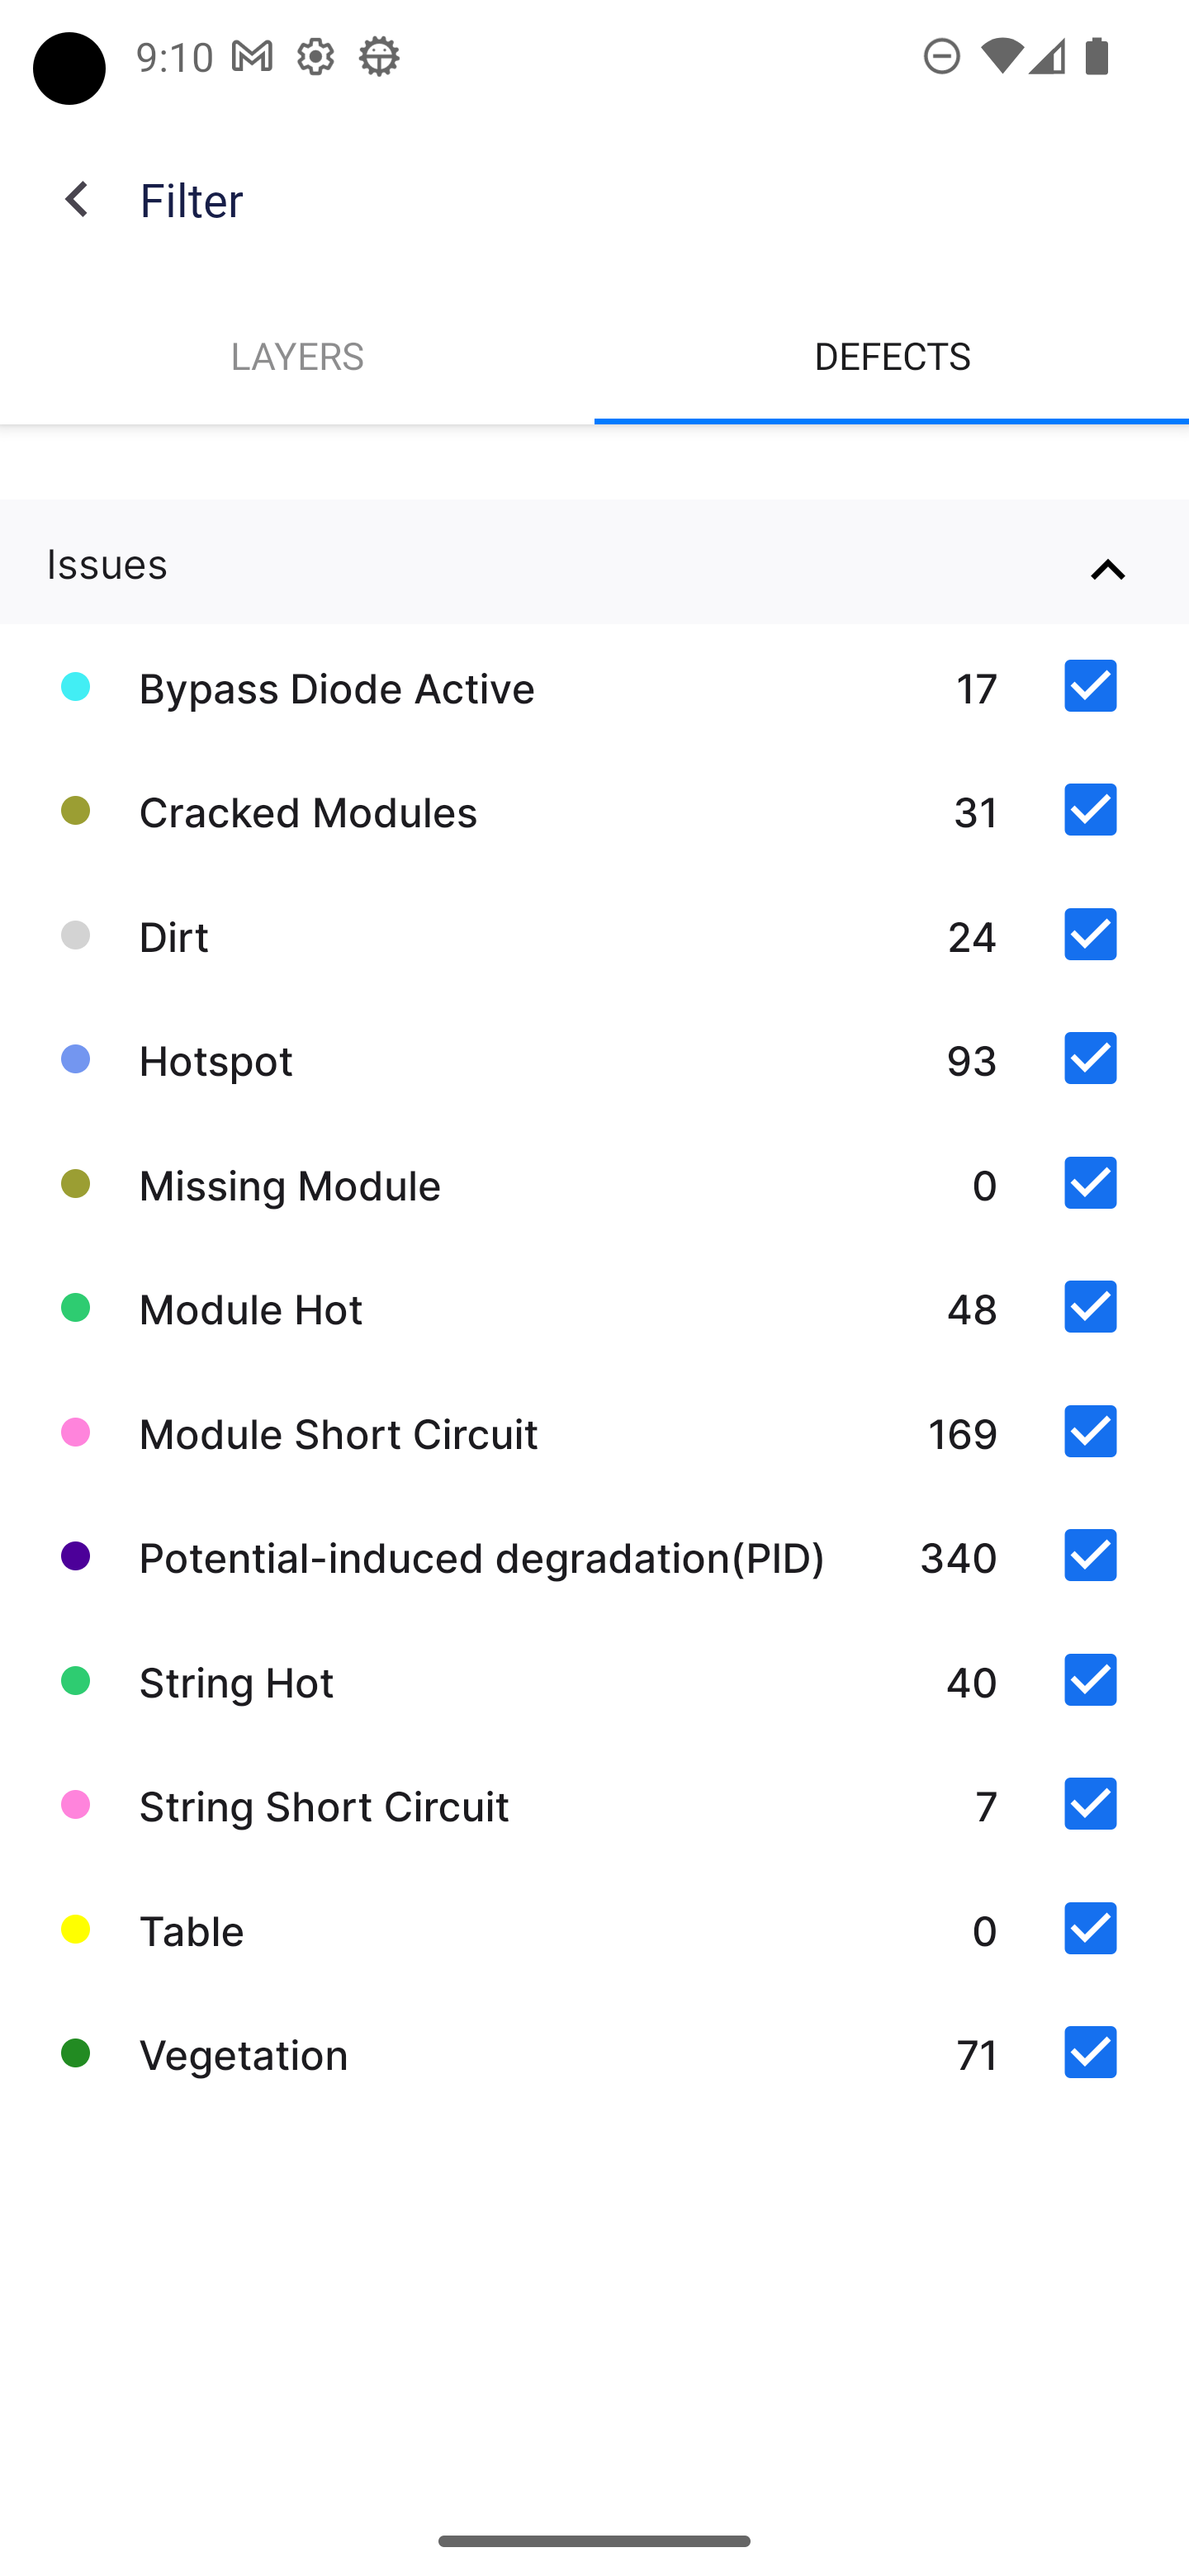
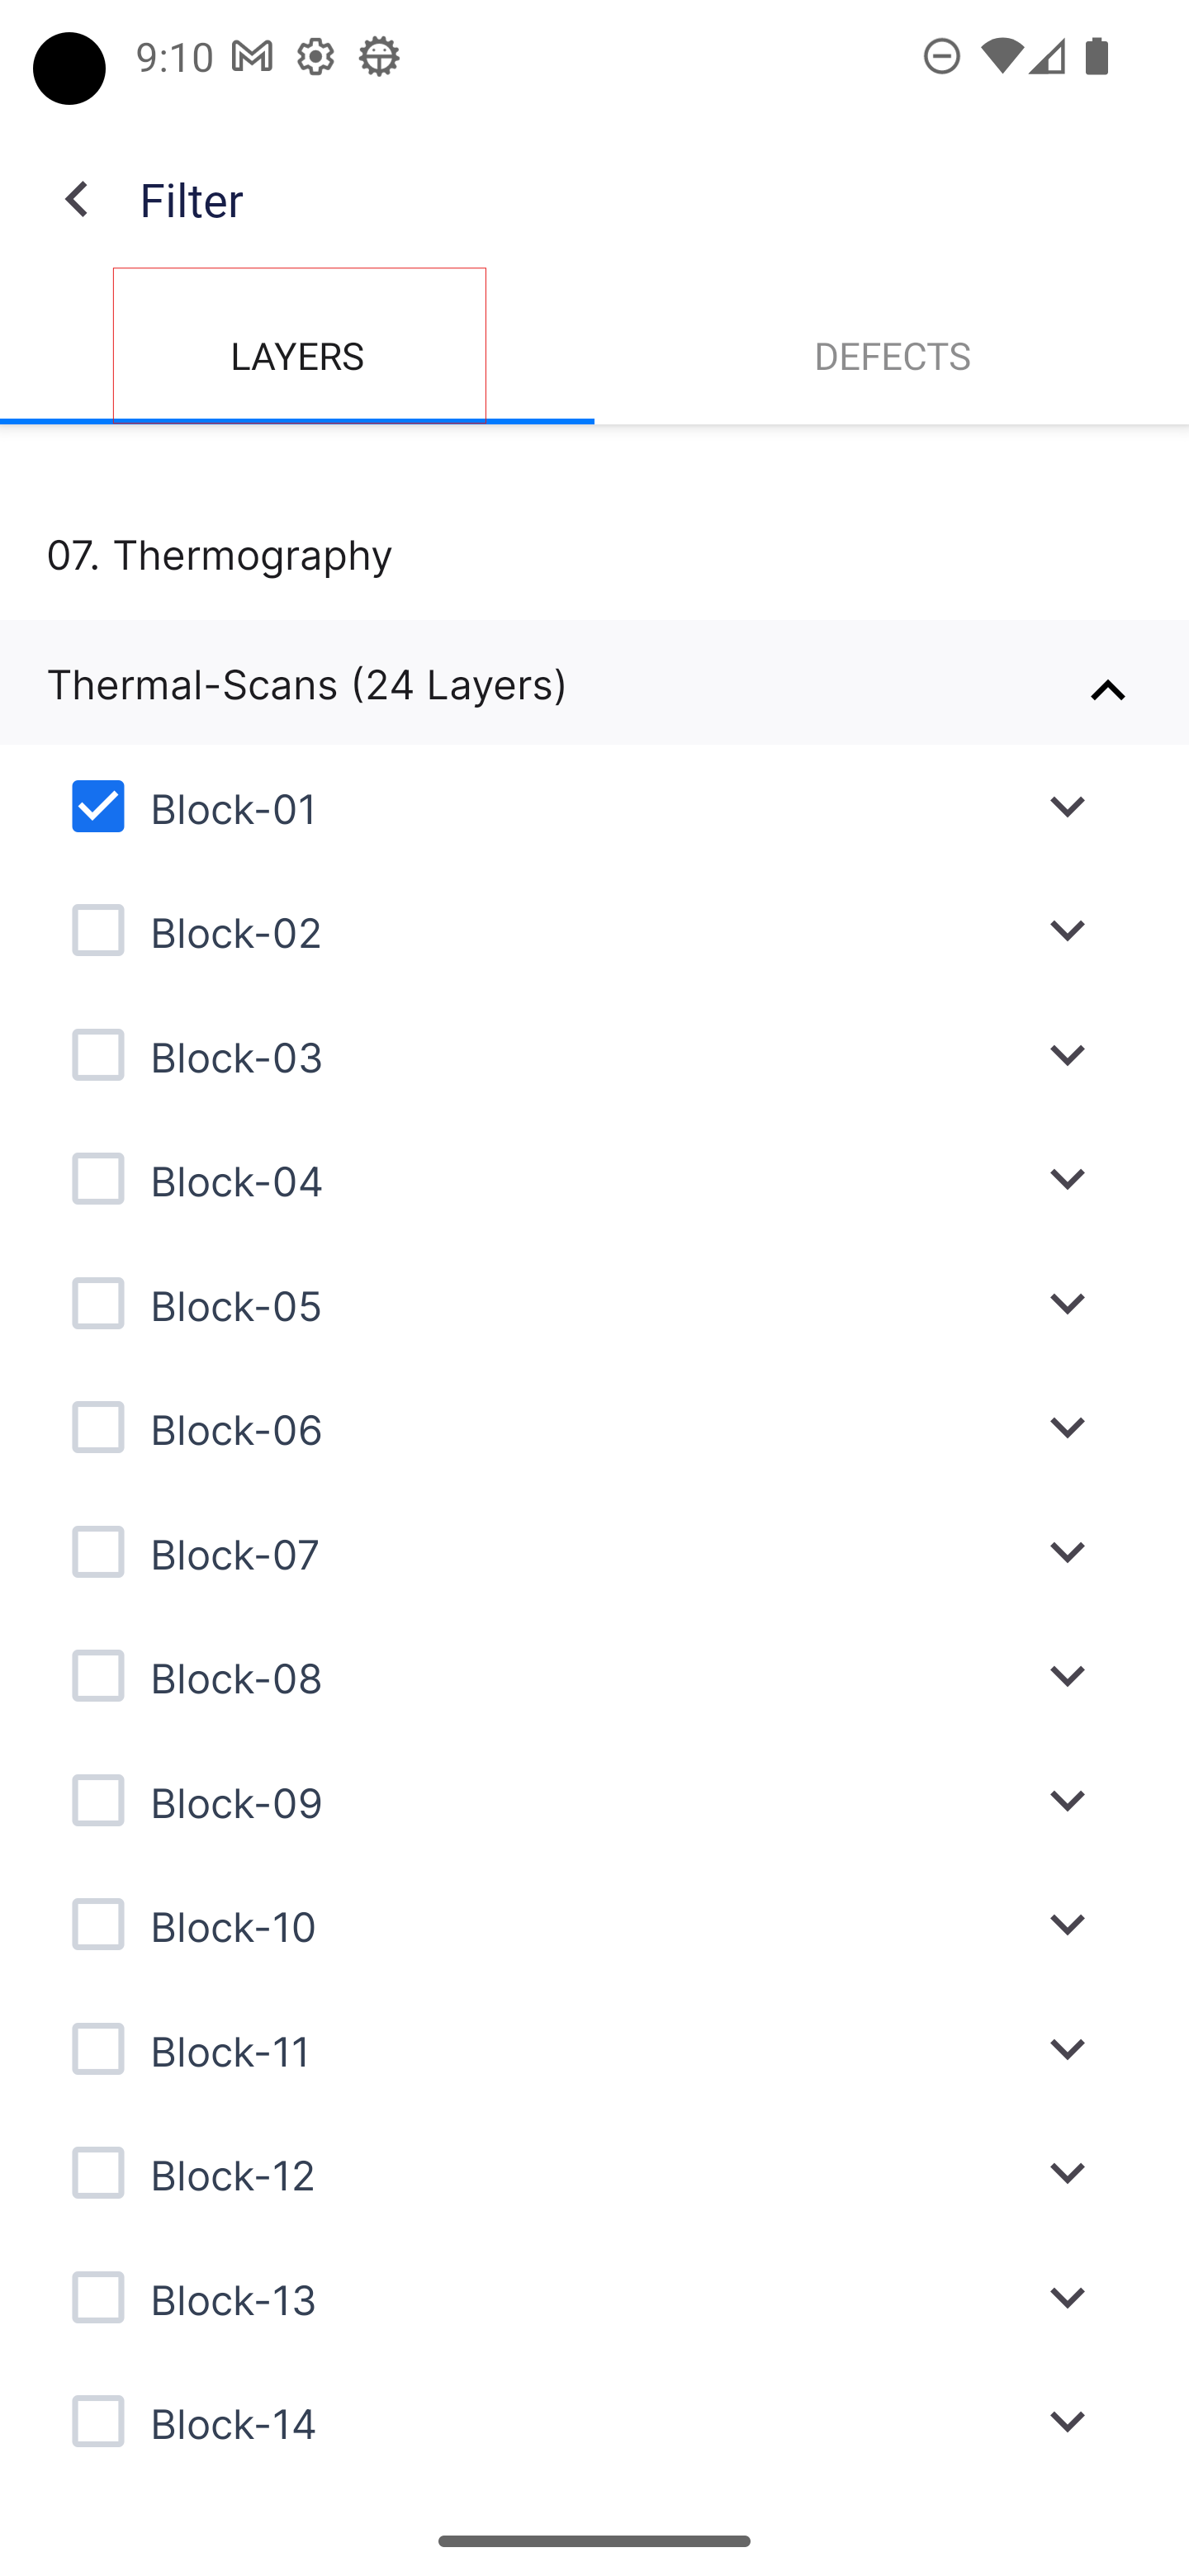
3. To check out the identified defects in the chosen area, just open up the map. You can easily show or hide the defects on the map by clicking on the layer icon (Figure 23(a)). Need more inverter blocks? Just use the layer icon (Figure 23(b))! Select or deselect the blocks.
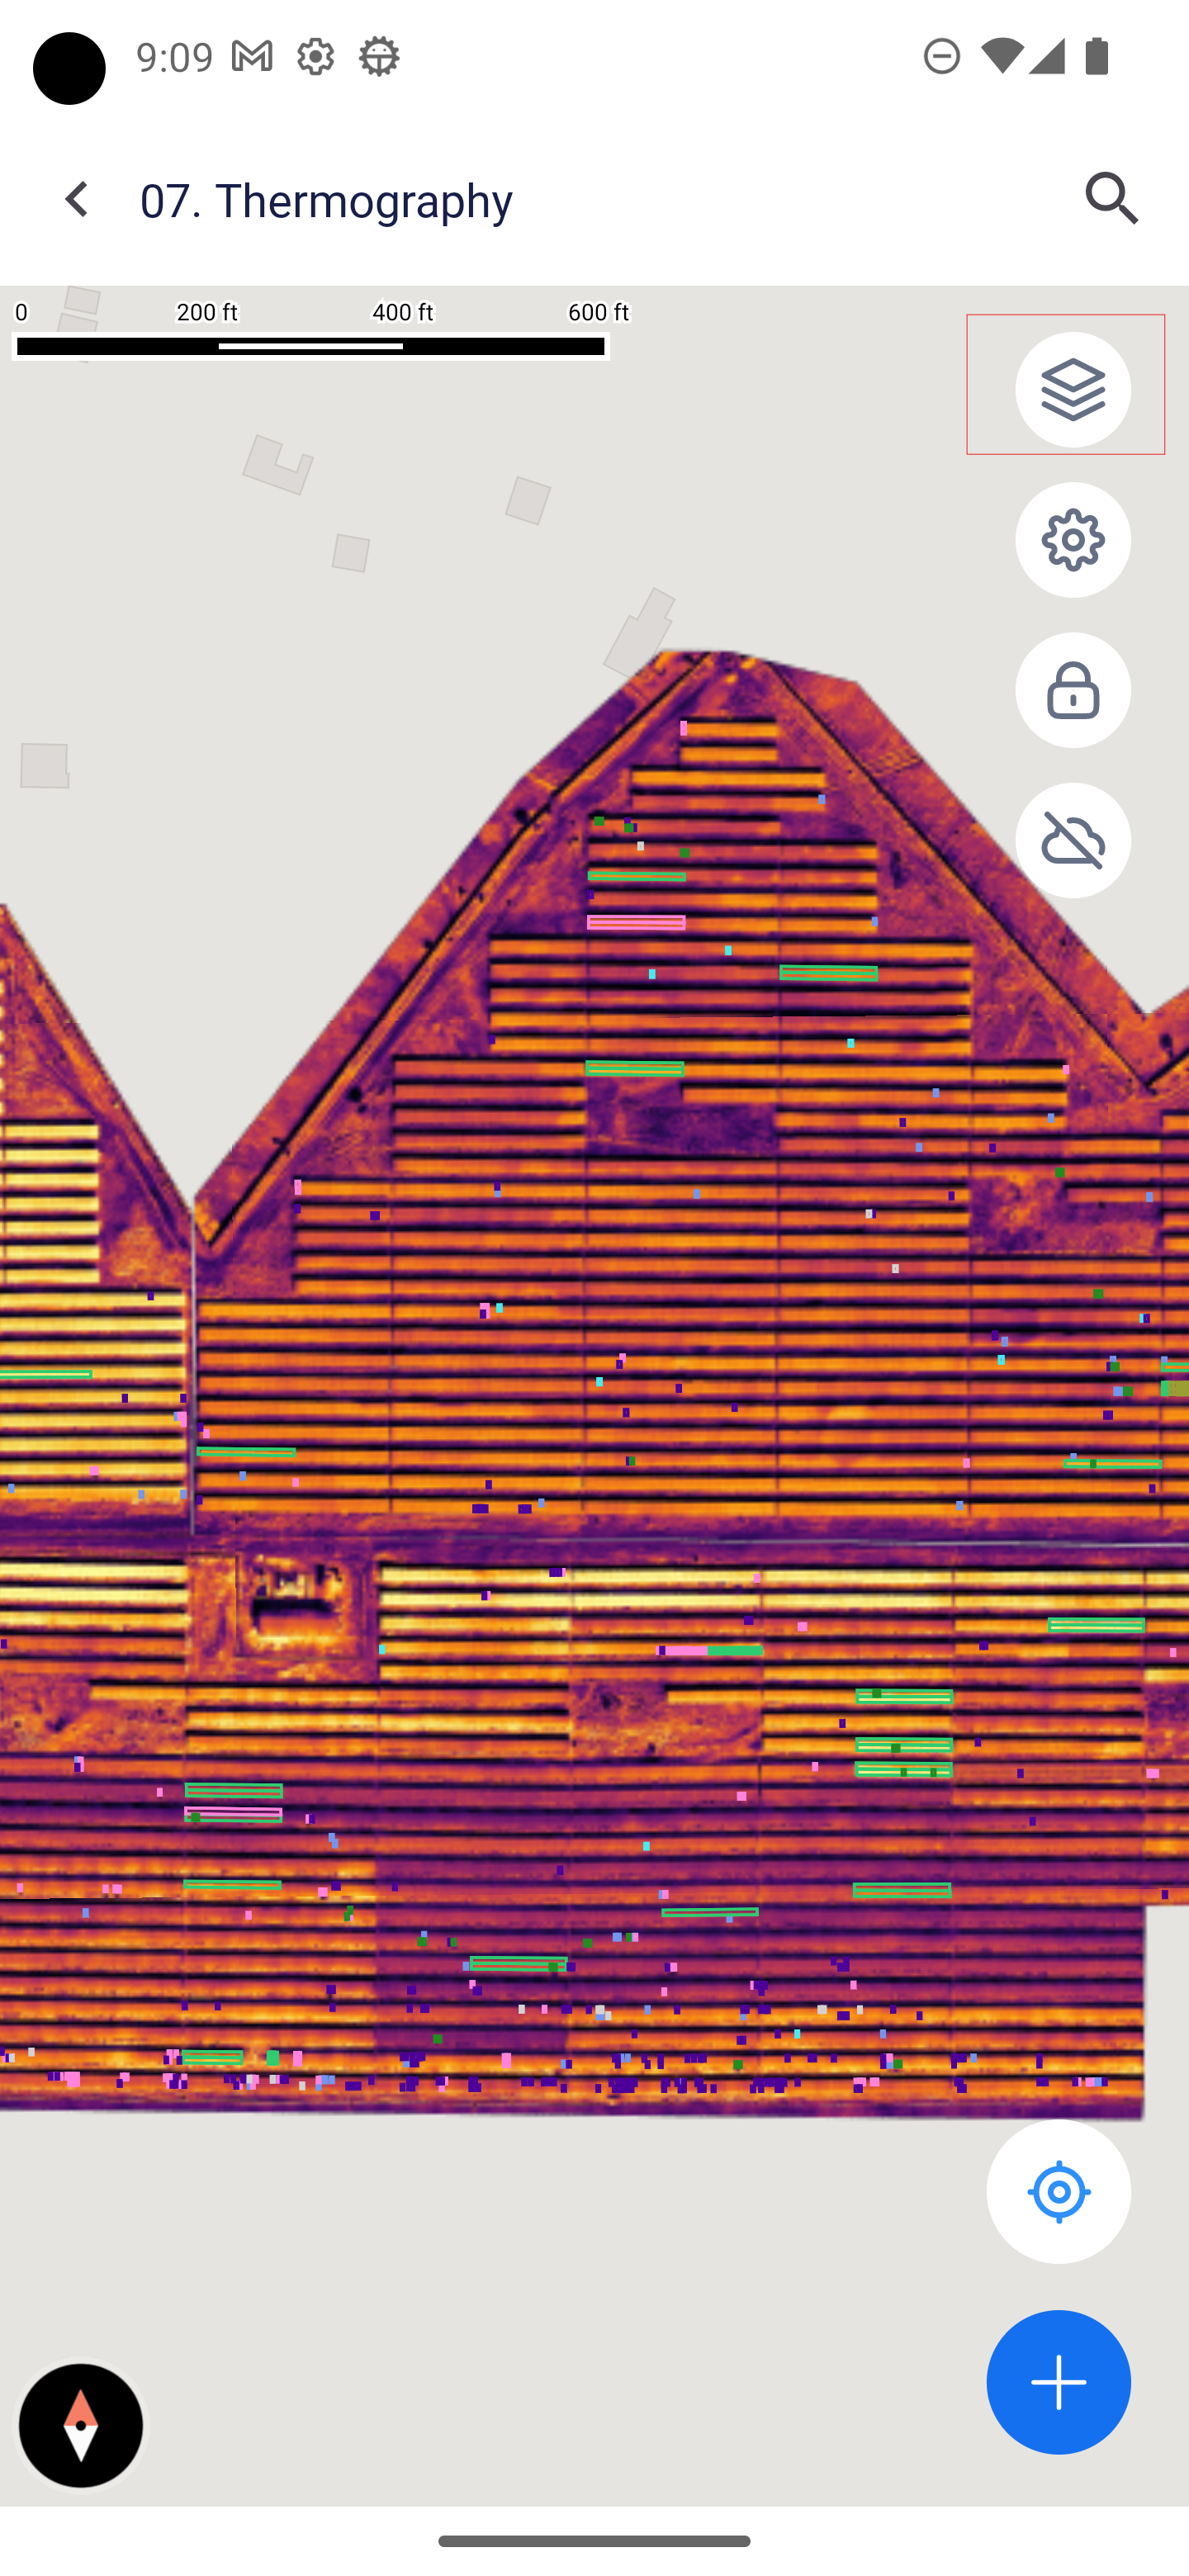
FIGURE 23(a): DEFECTS ON MAP/FILTERS
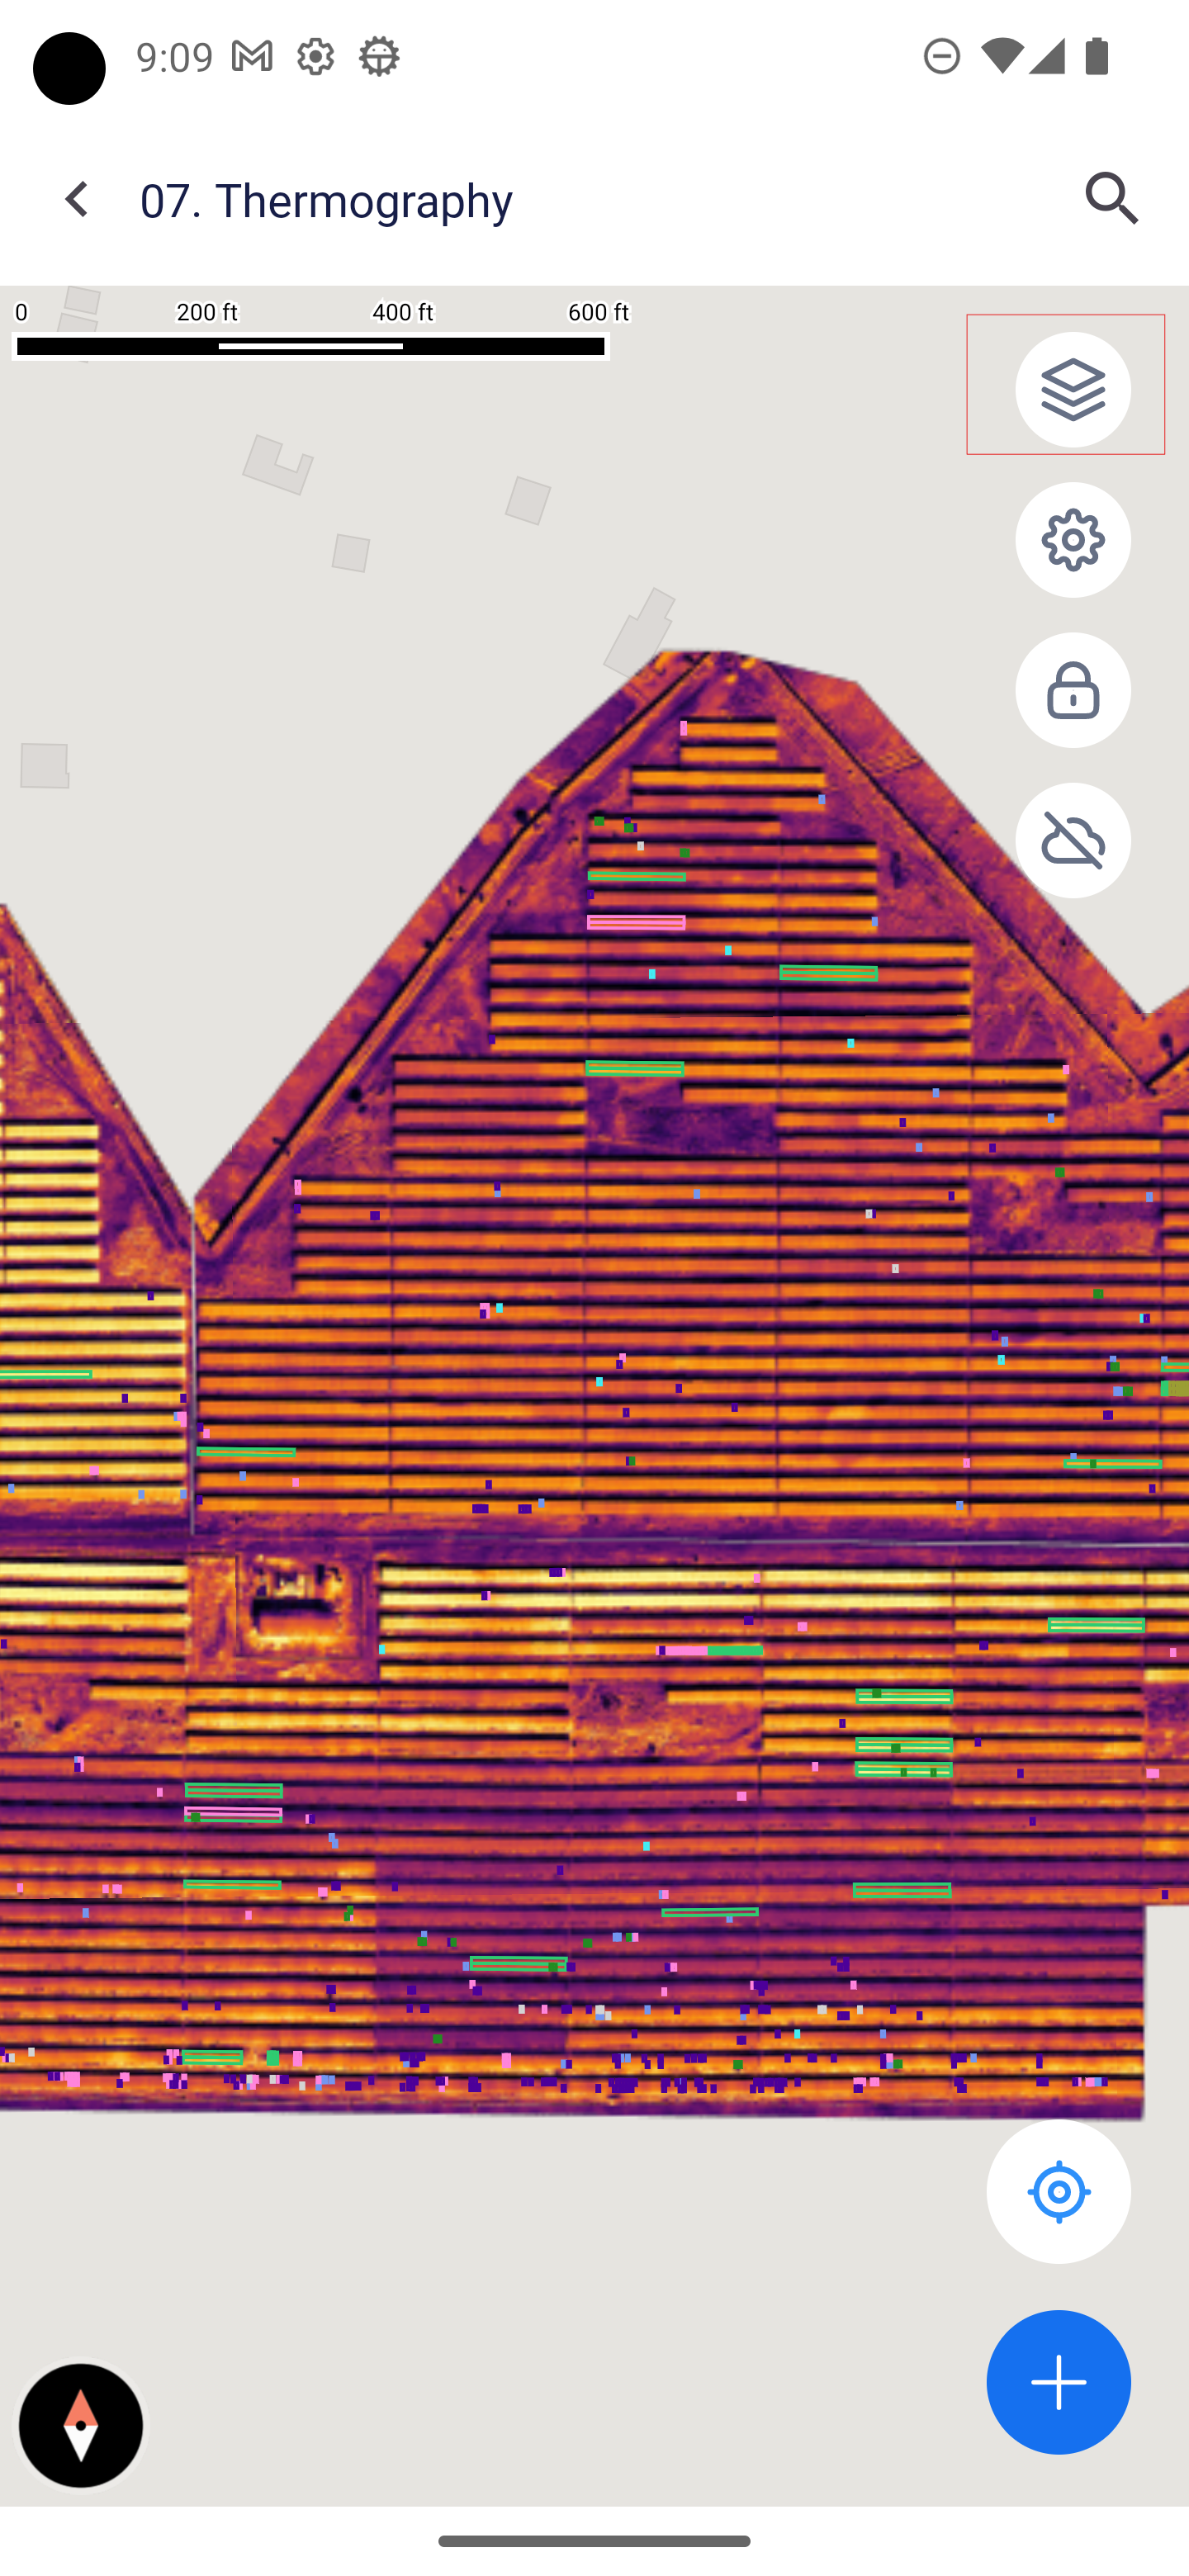
FIGURE 23(b): LAYERS
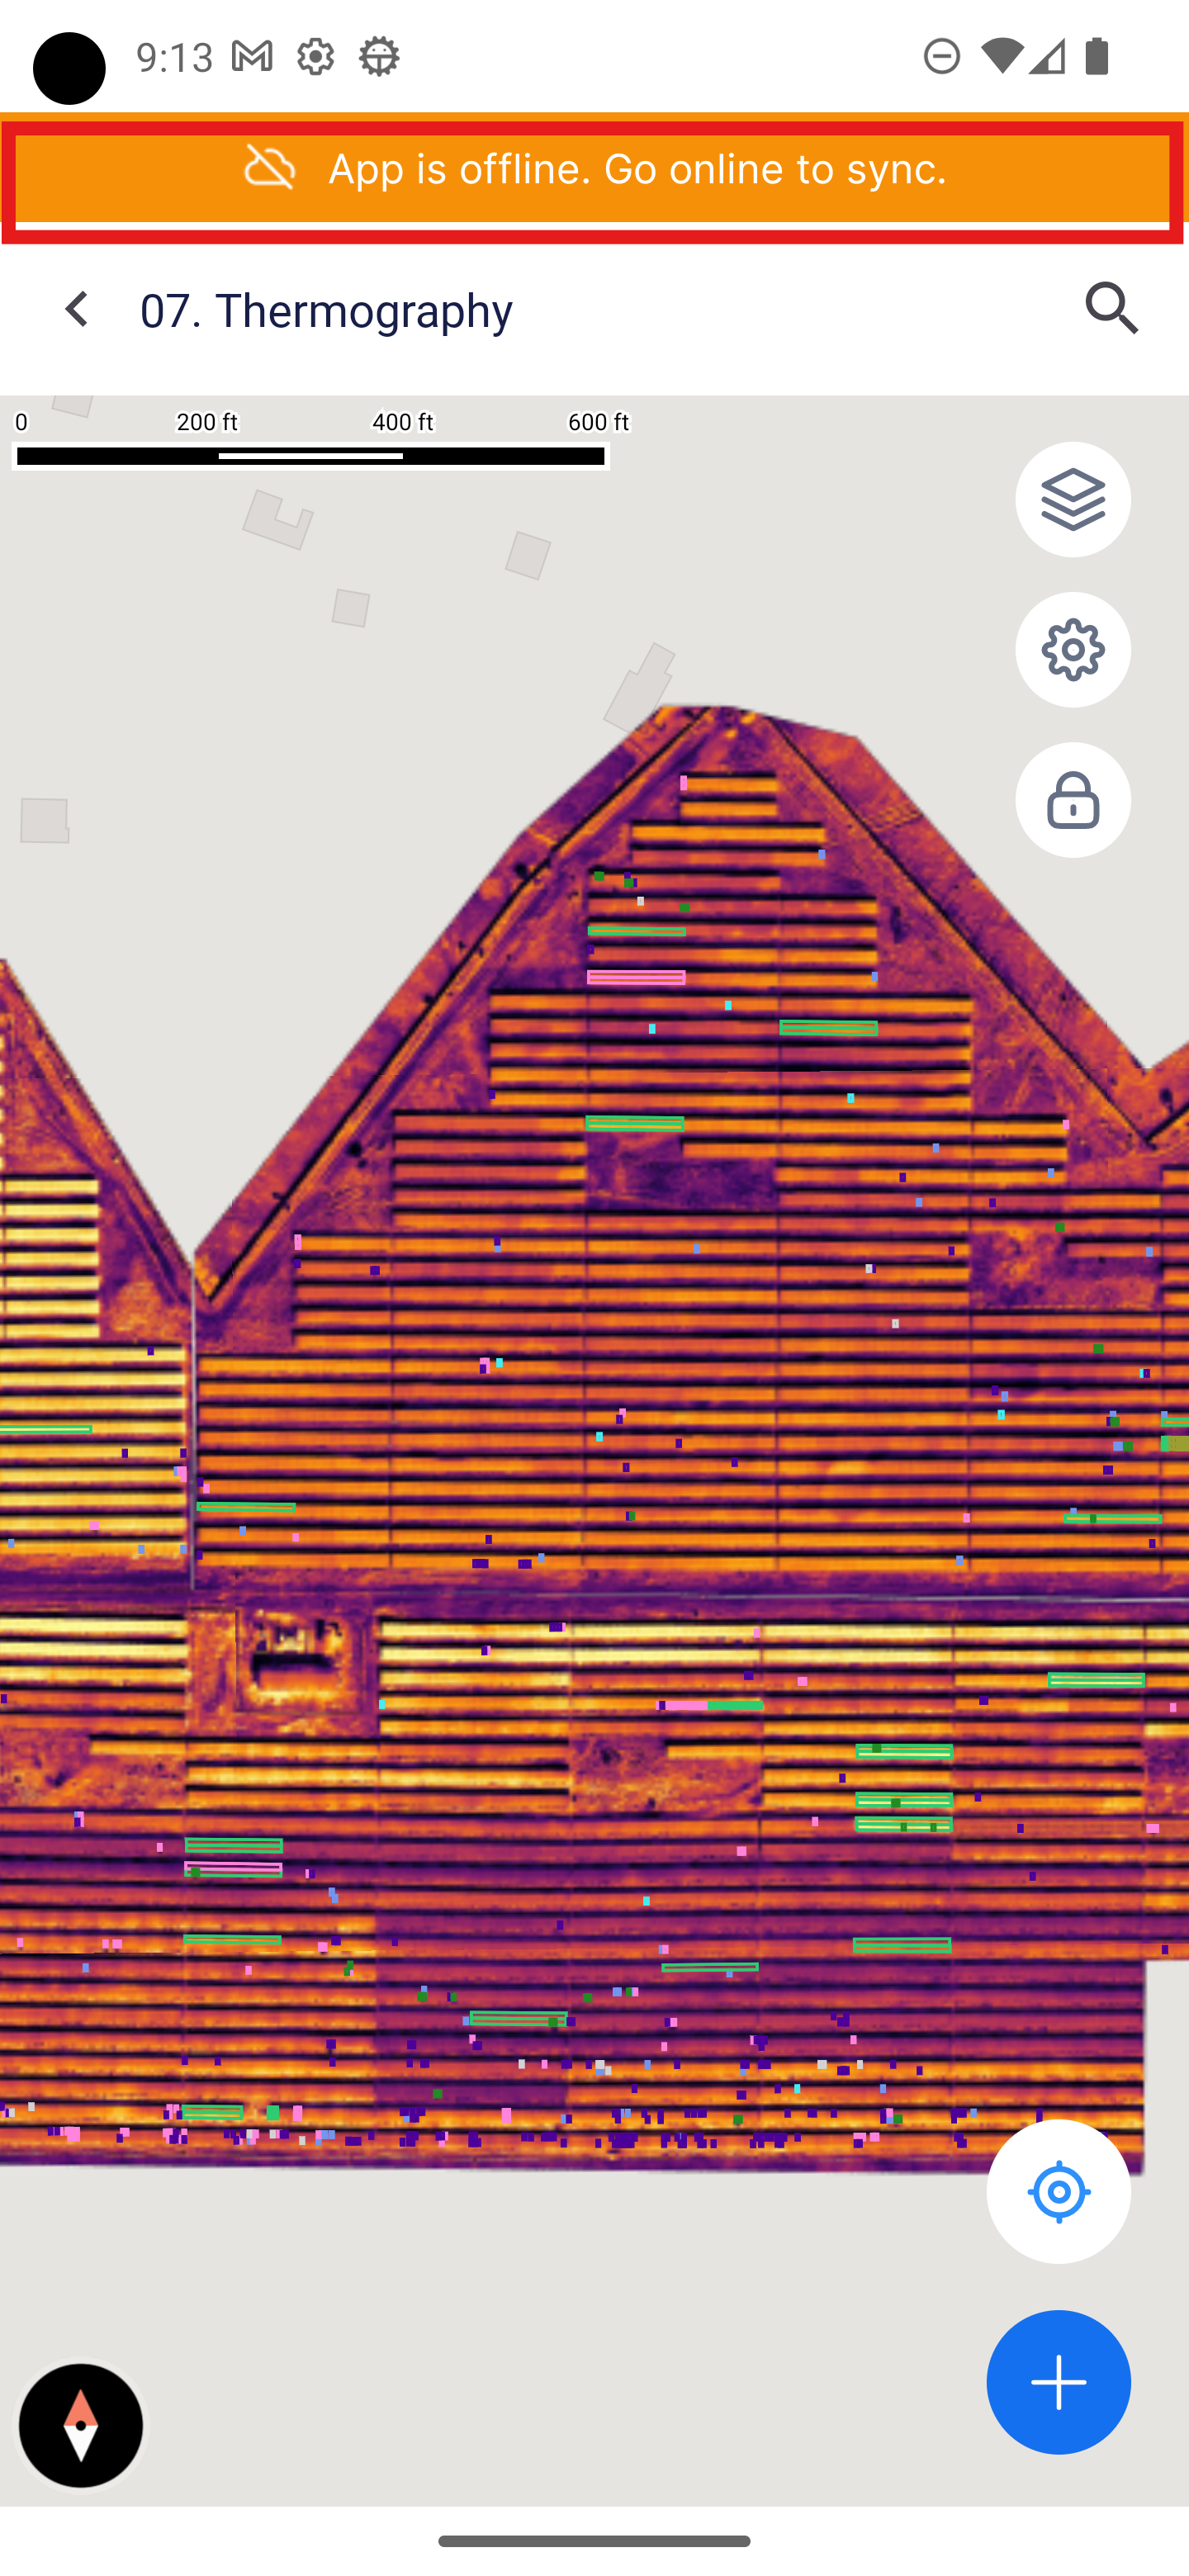
4. You can use the app without an internet connection or in areas with poor network coverage by clicking the offline icon (see FIGURE 24). When you regain connectivity, click the offline icon to let the app know it's back online. Click "Go online" to sync all your activities, including checklists and photos attached to tasks.
It's important to load the map's blocks/layers before going offline. The offline functionality will only work with the loaded content.
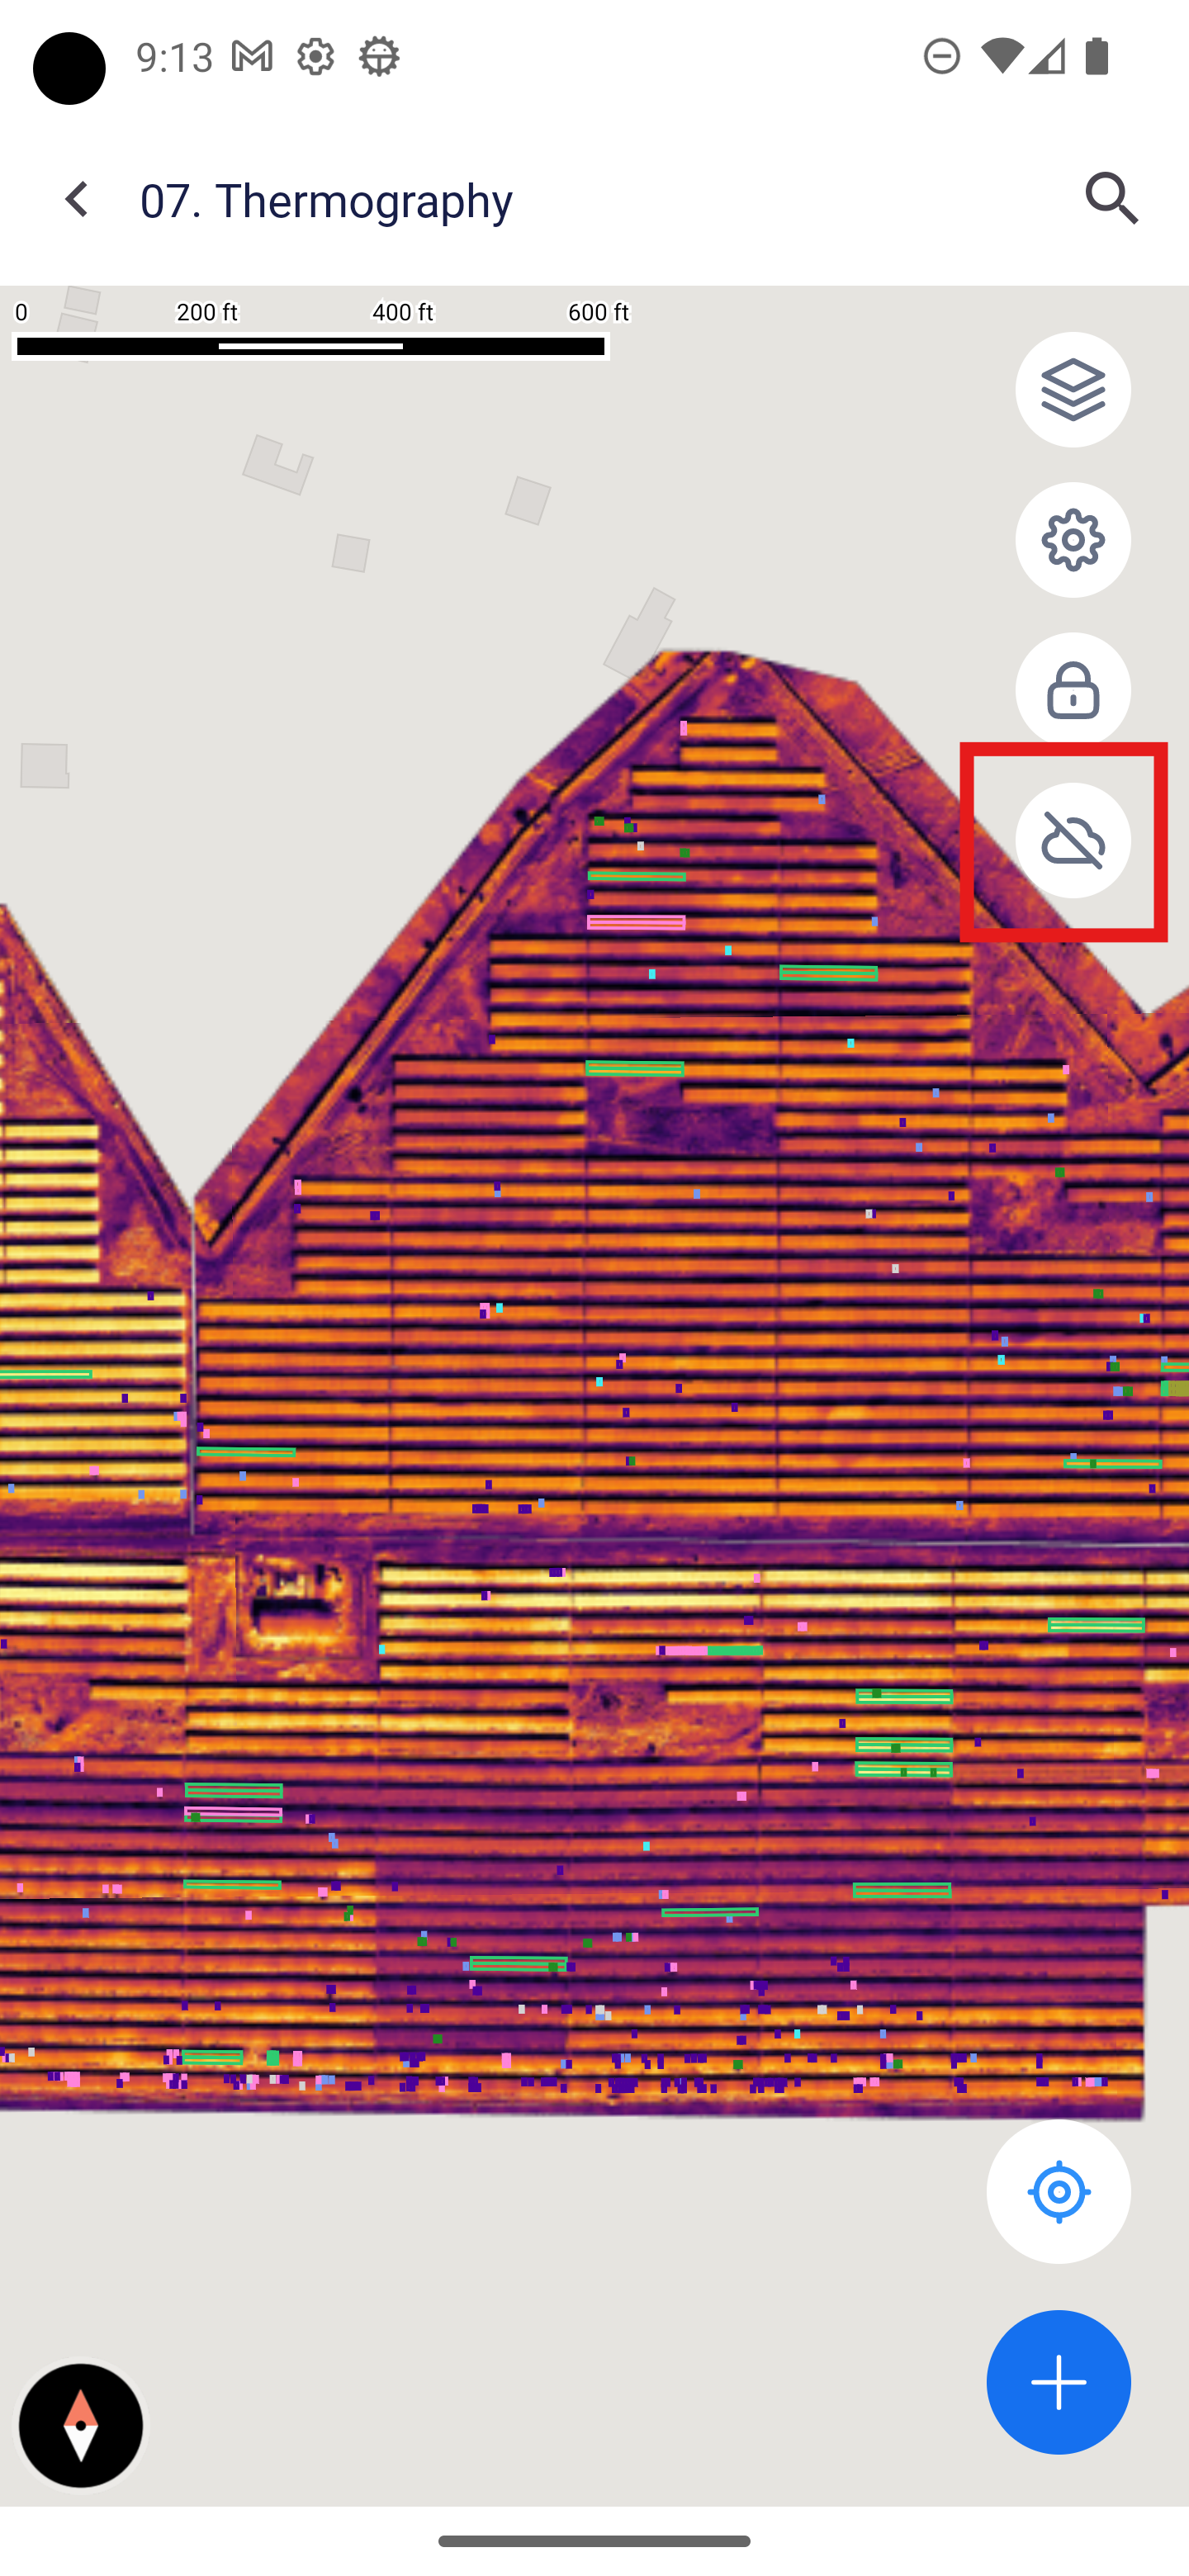
FIGURE 24: OFFLINE MODE
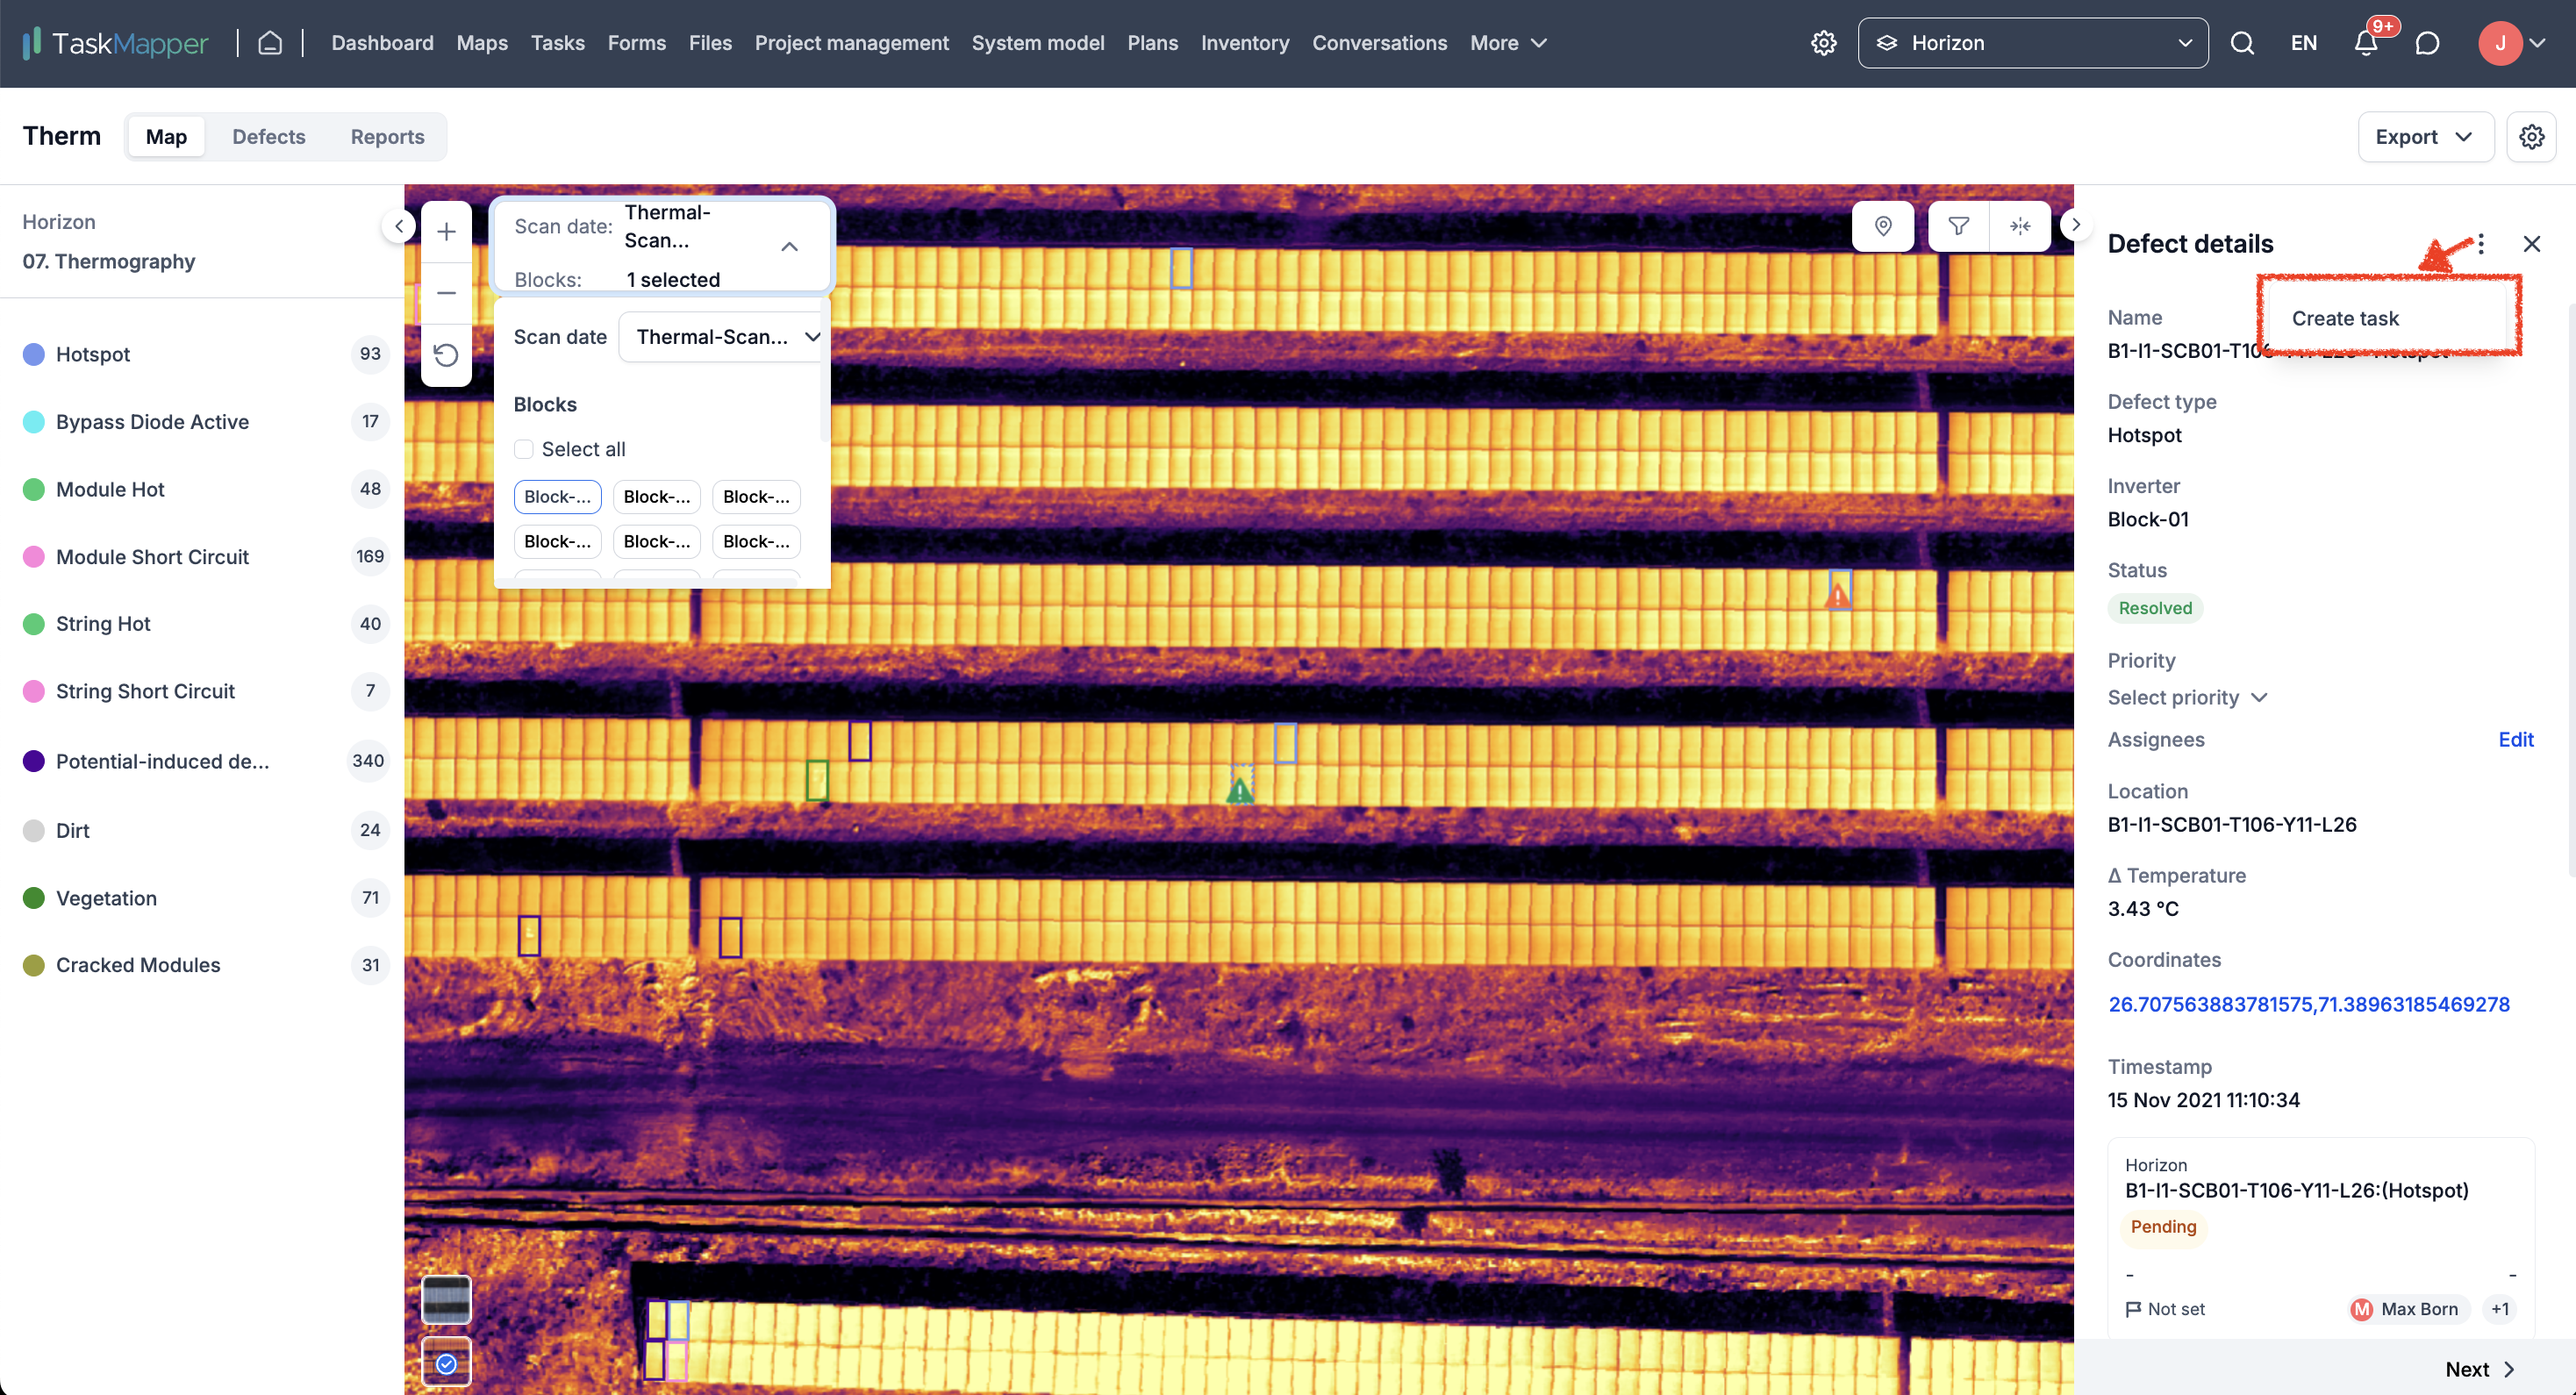
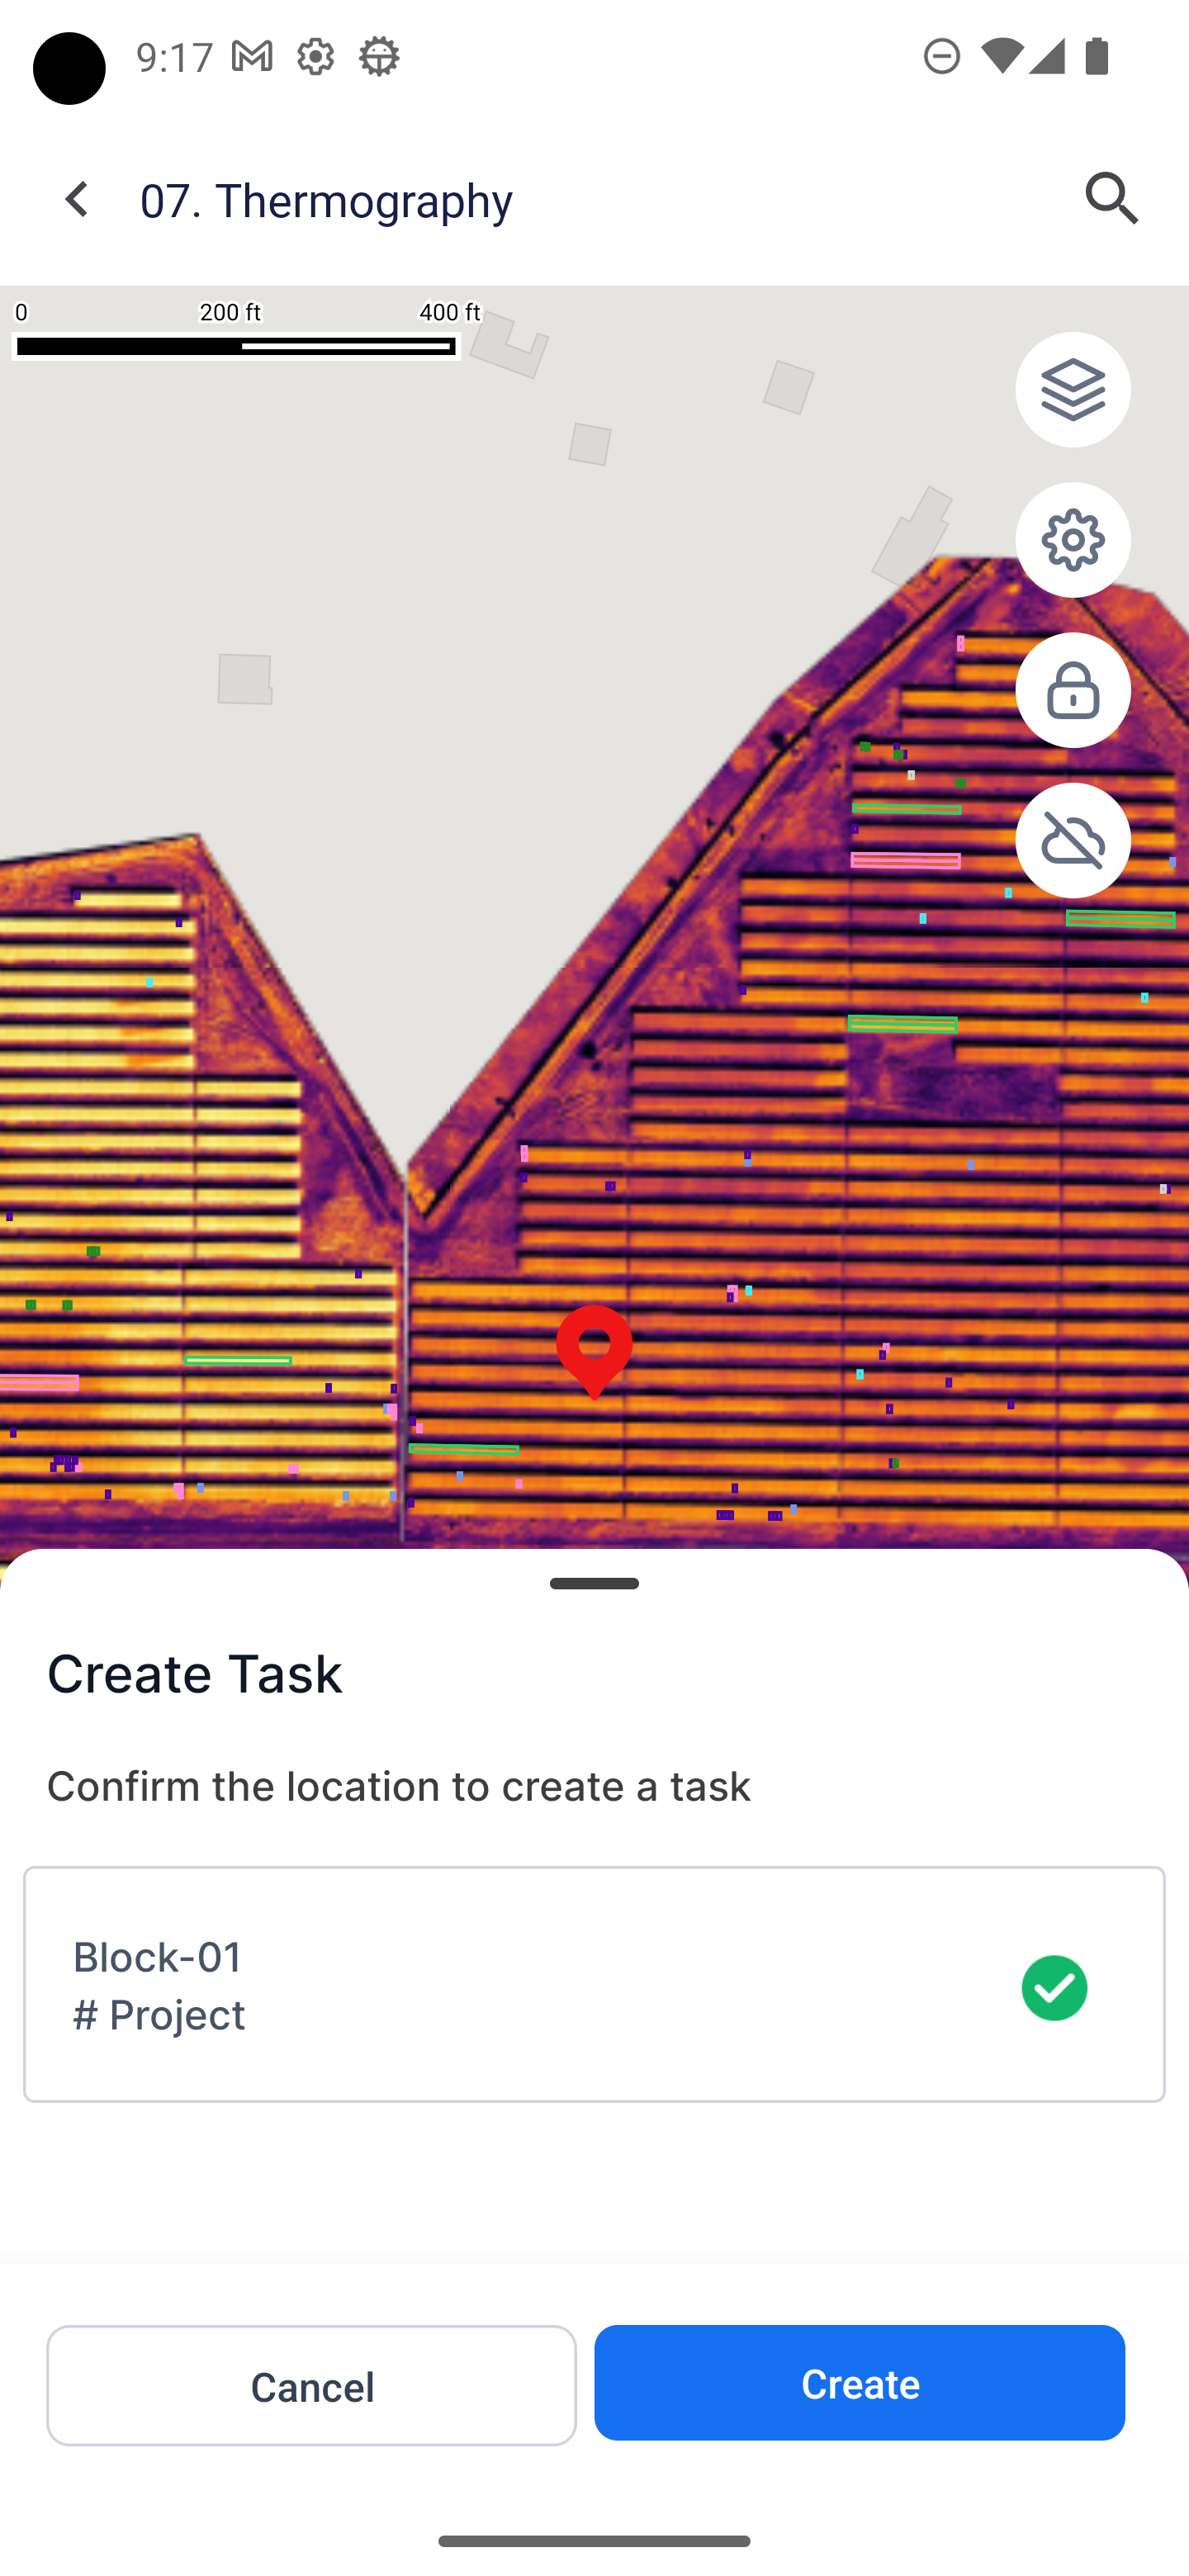
5. To add a task to the map, you can either click on a defect and convert it to a task or select the '+' icon and choose between 'Add Task' or 'Attachments' to create a new task.
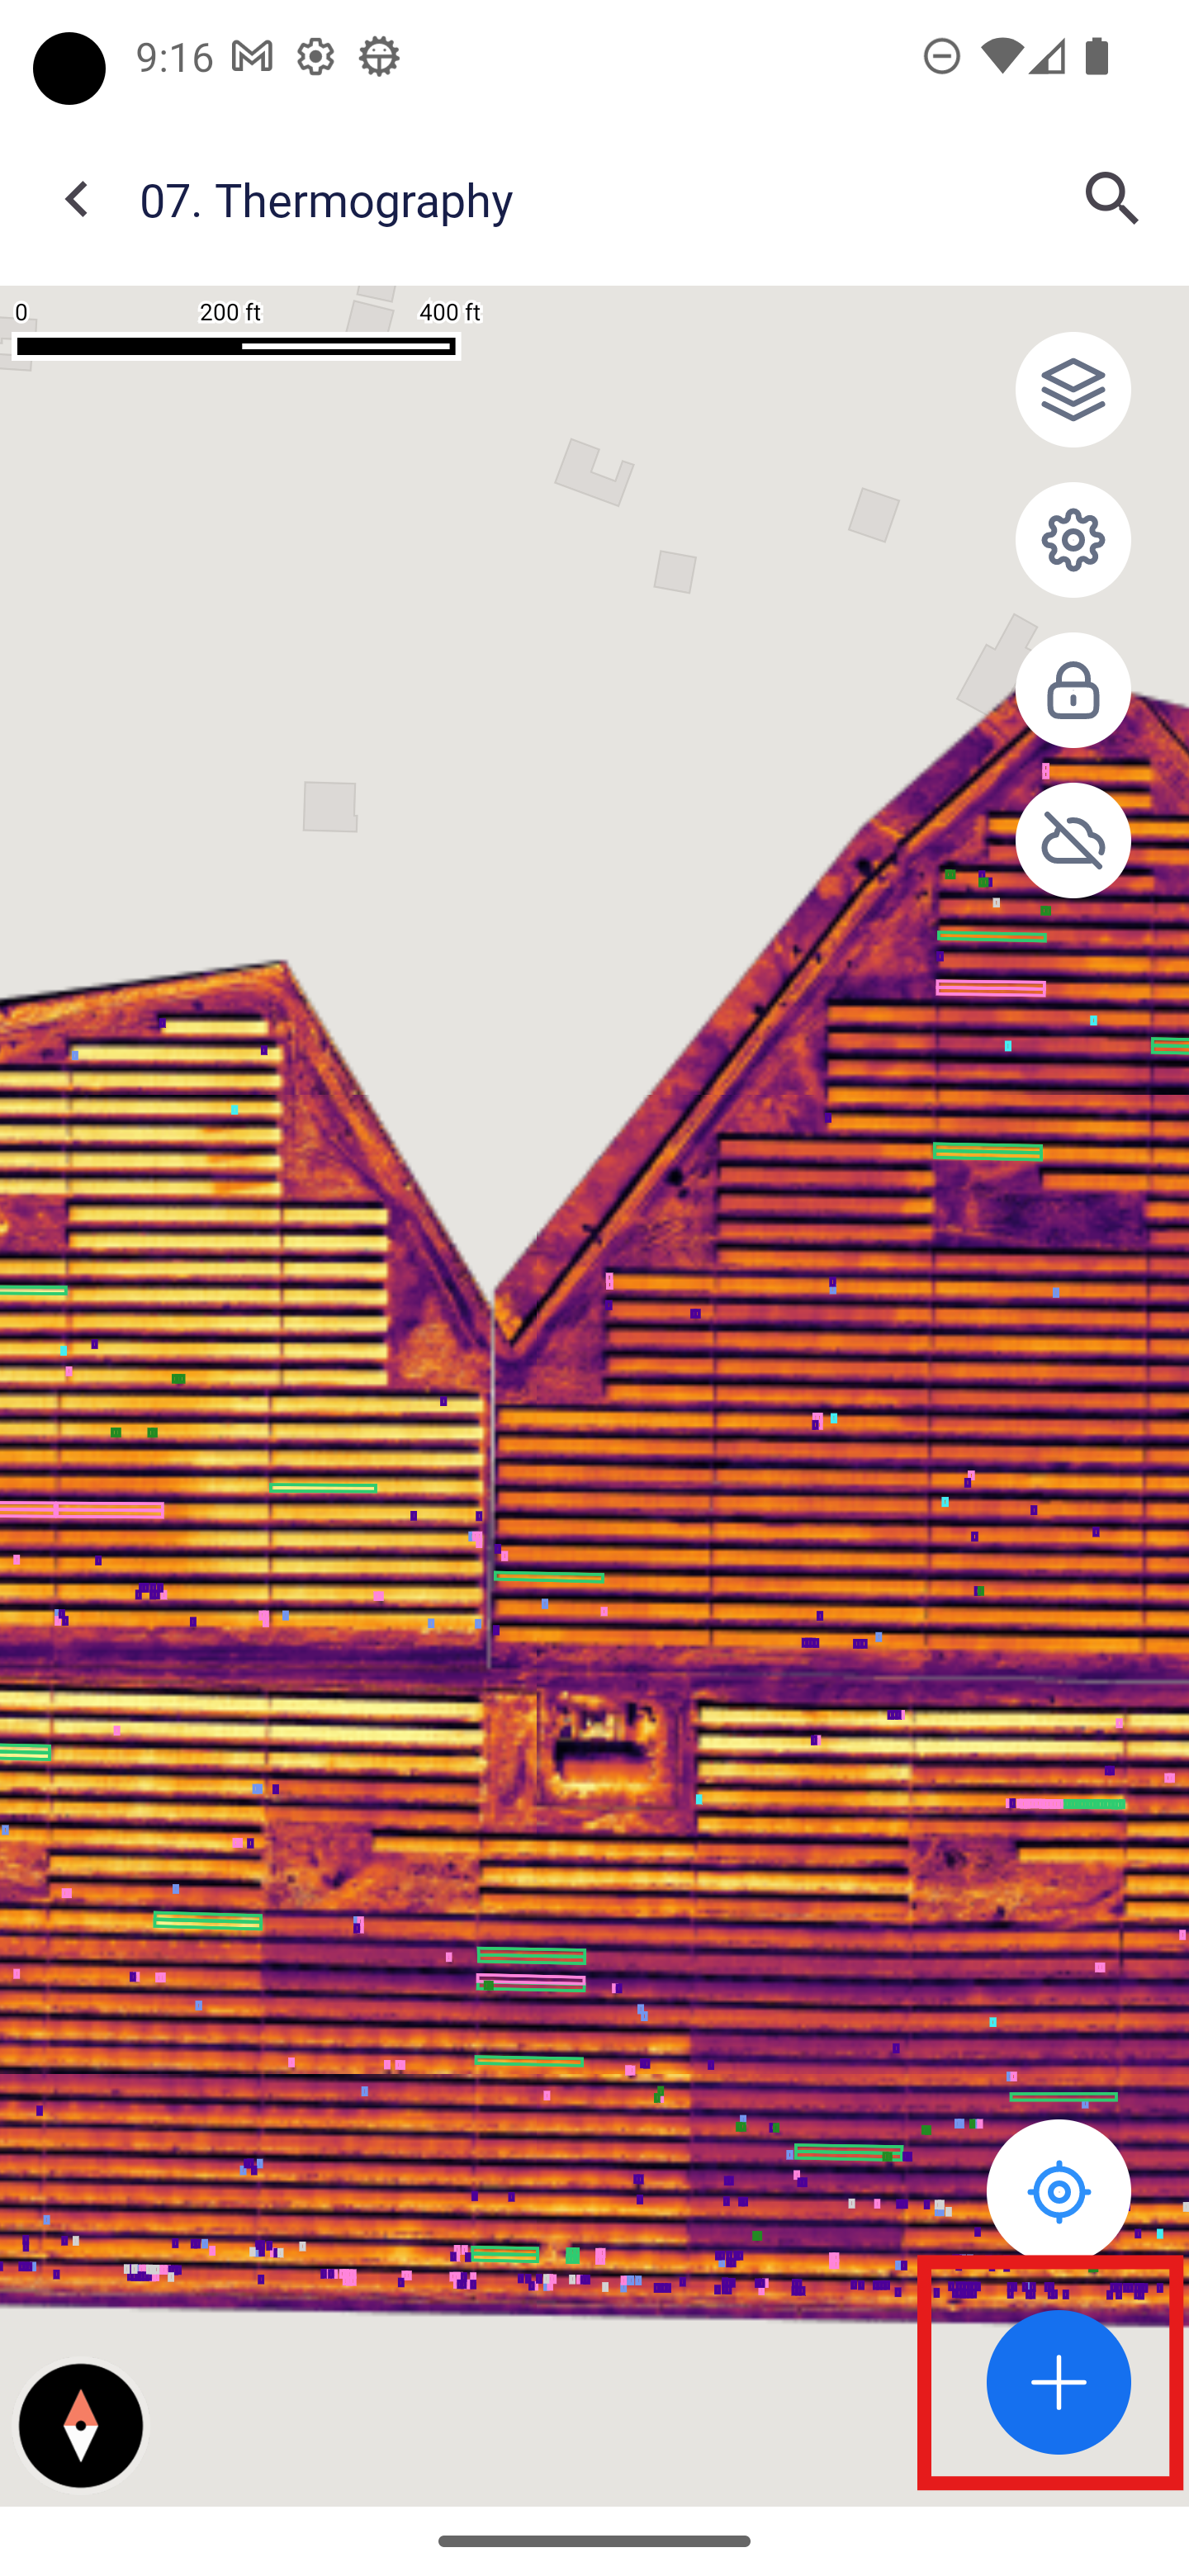
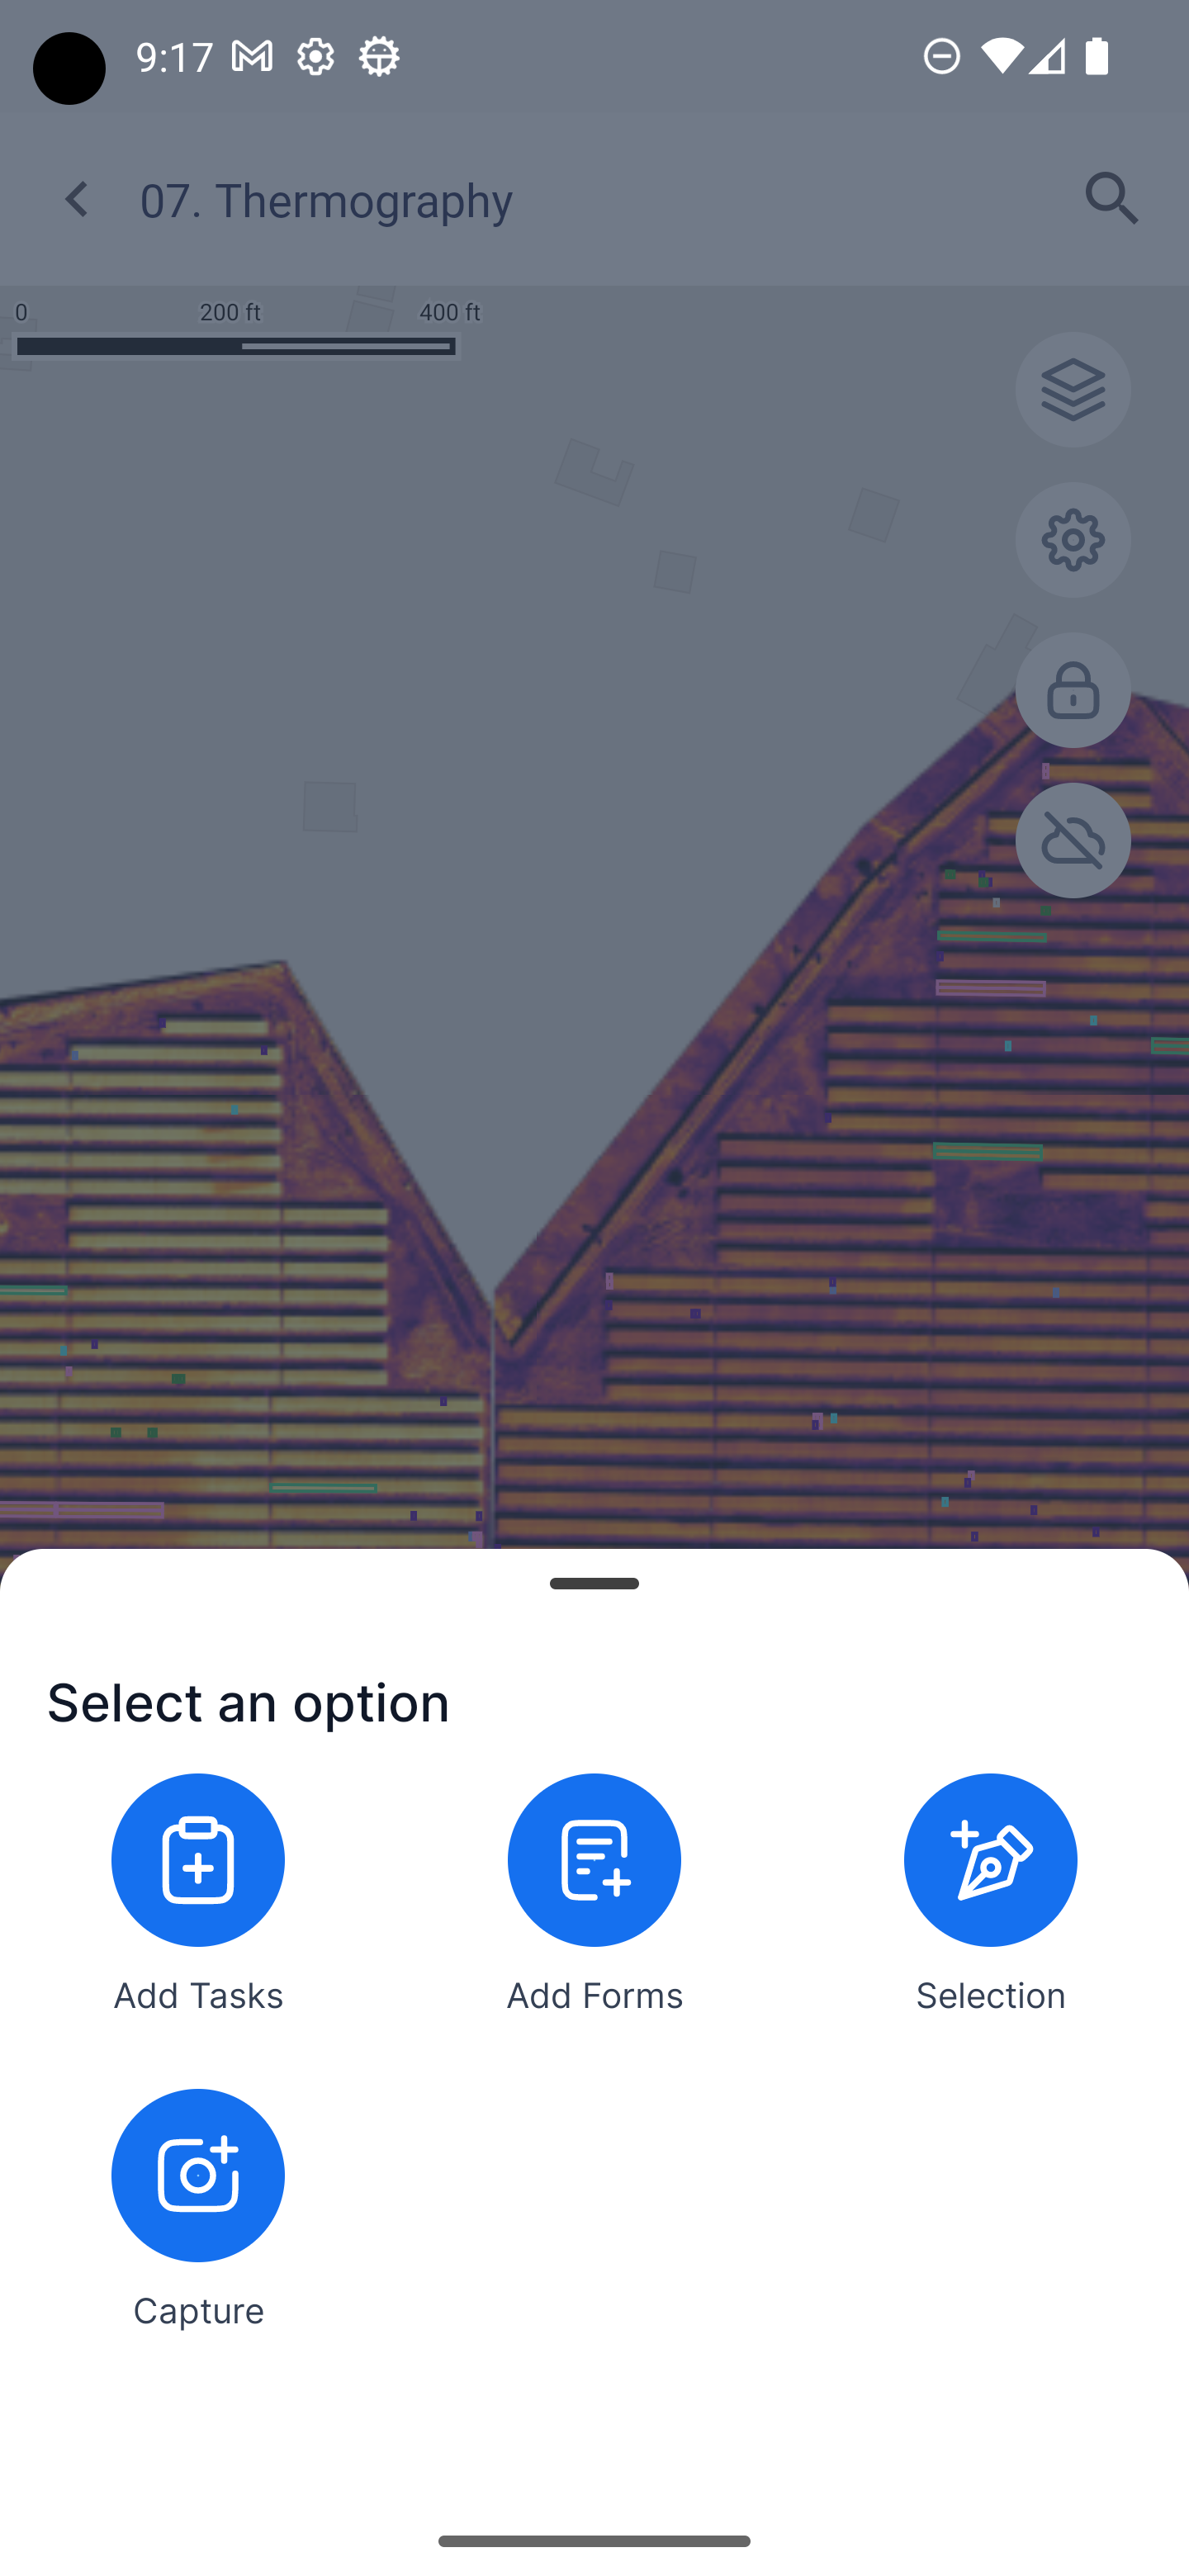
FIGURE 25: CREATE TASK
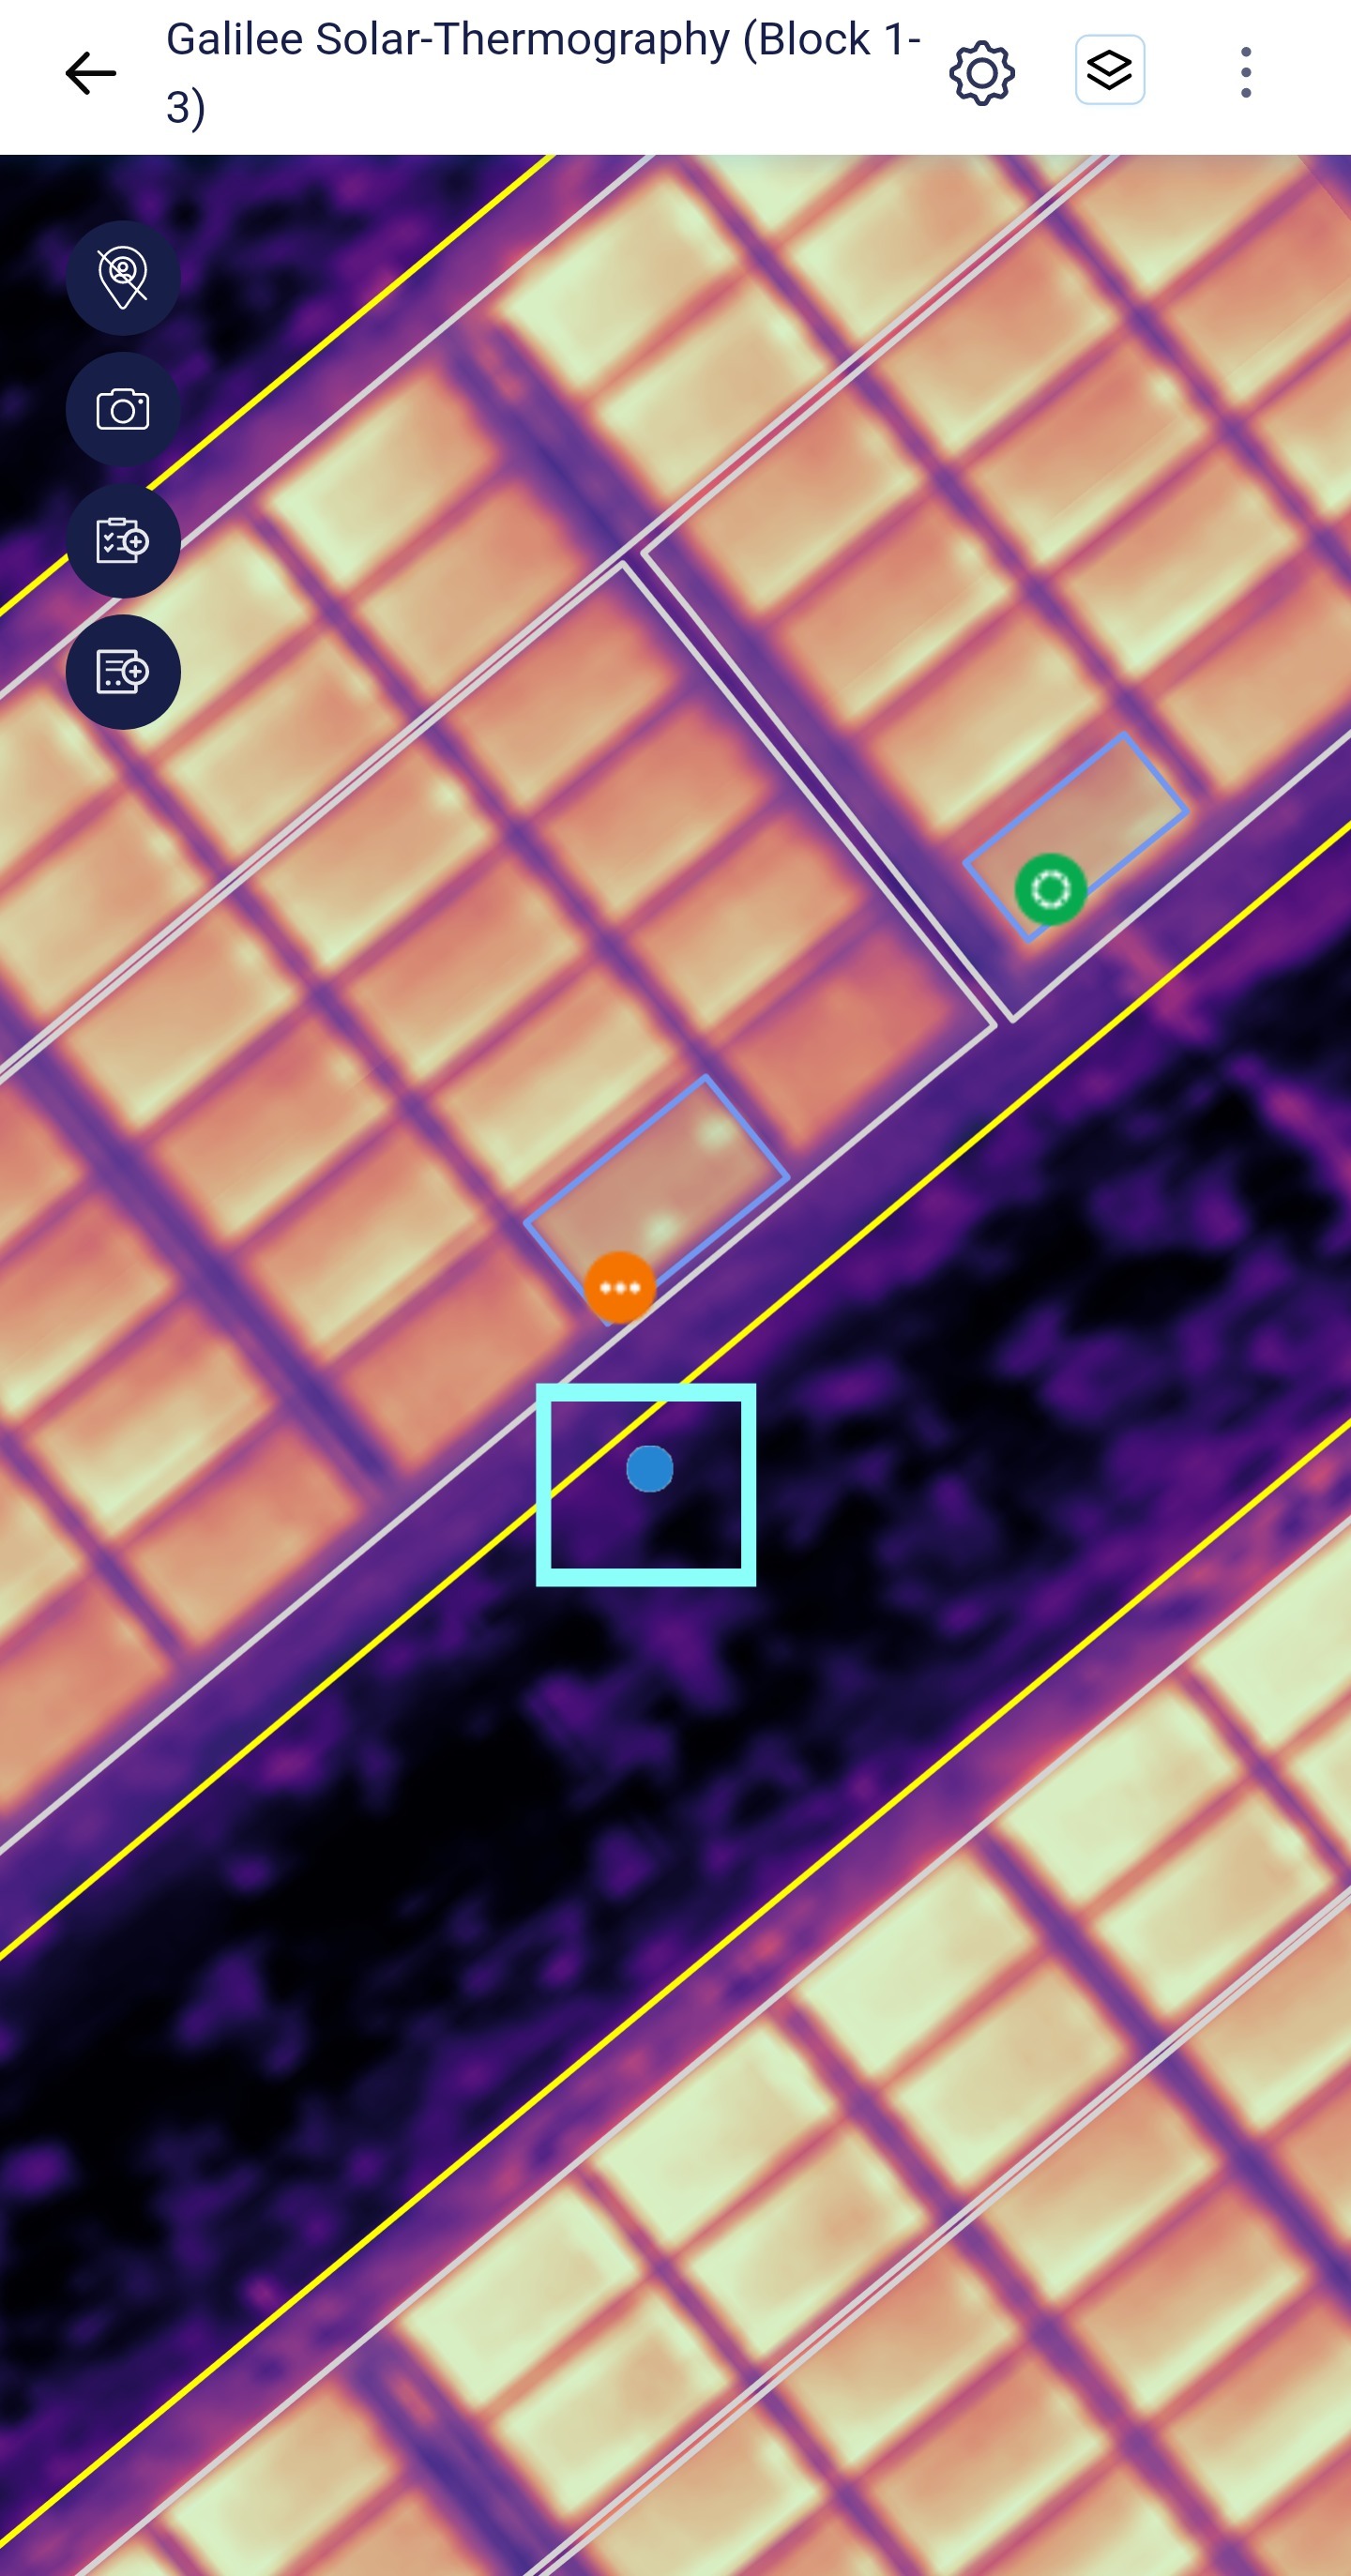
6. Your location will be a Blue dot on the screen. Navigate to an existing task and click on it to see the task details.
FIGURE 26: NAVIGATING TO A TASK ON THE FIELD
7. To view the defect details, tap on a defect and select 'View details'. Here, you can set its status and priority and assign it to a person or a team.
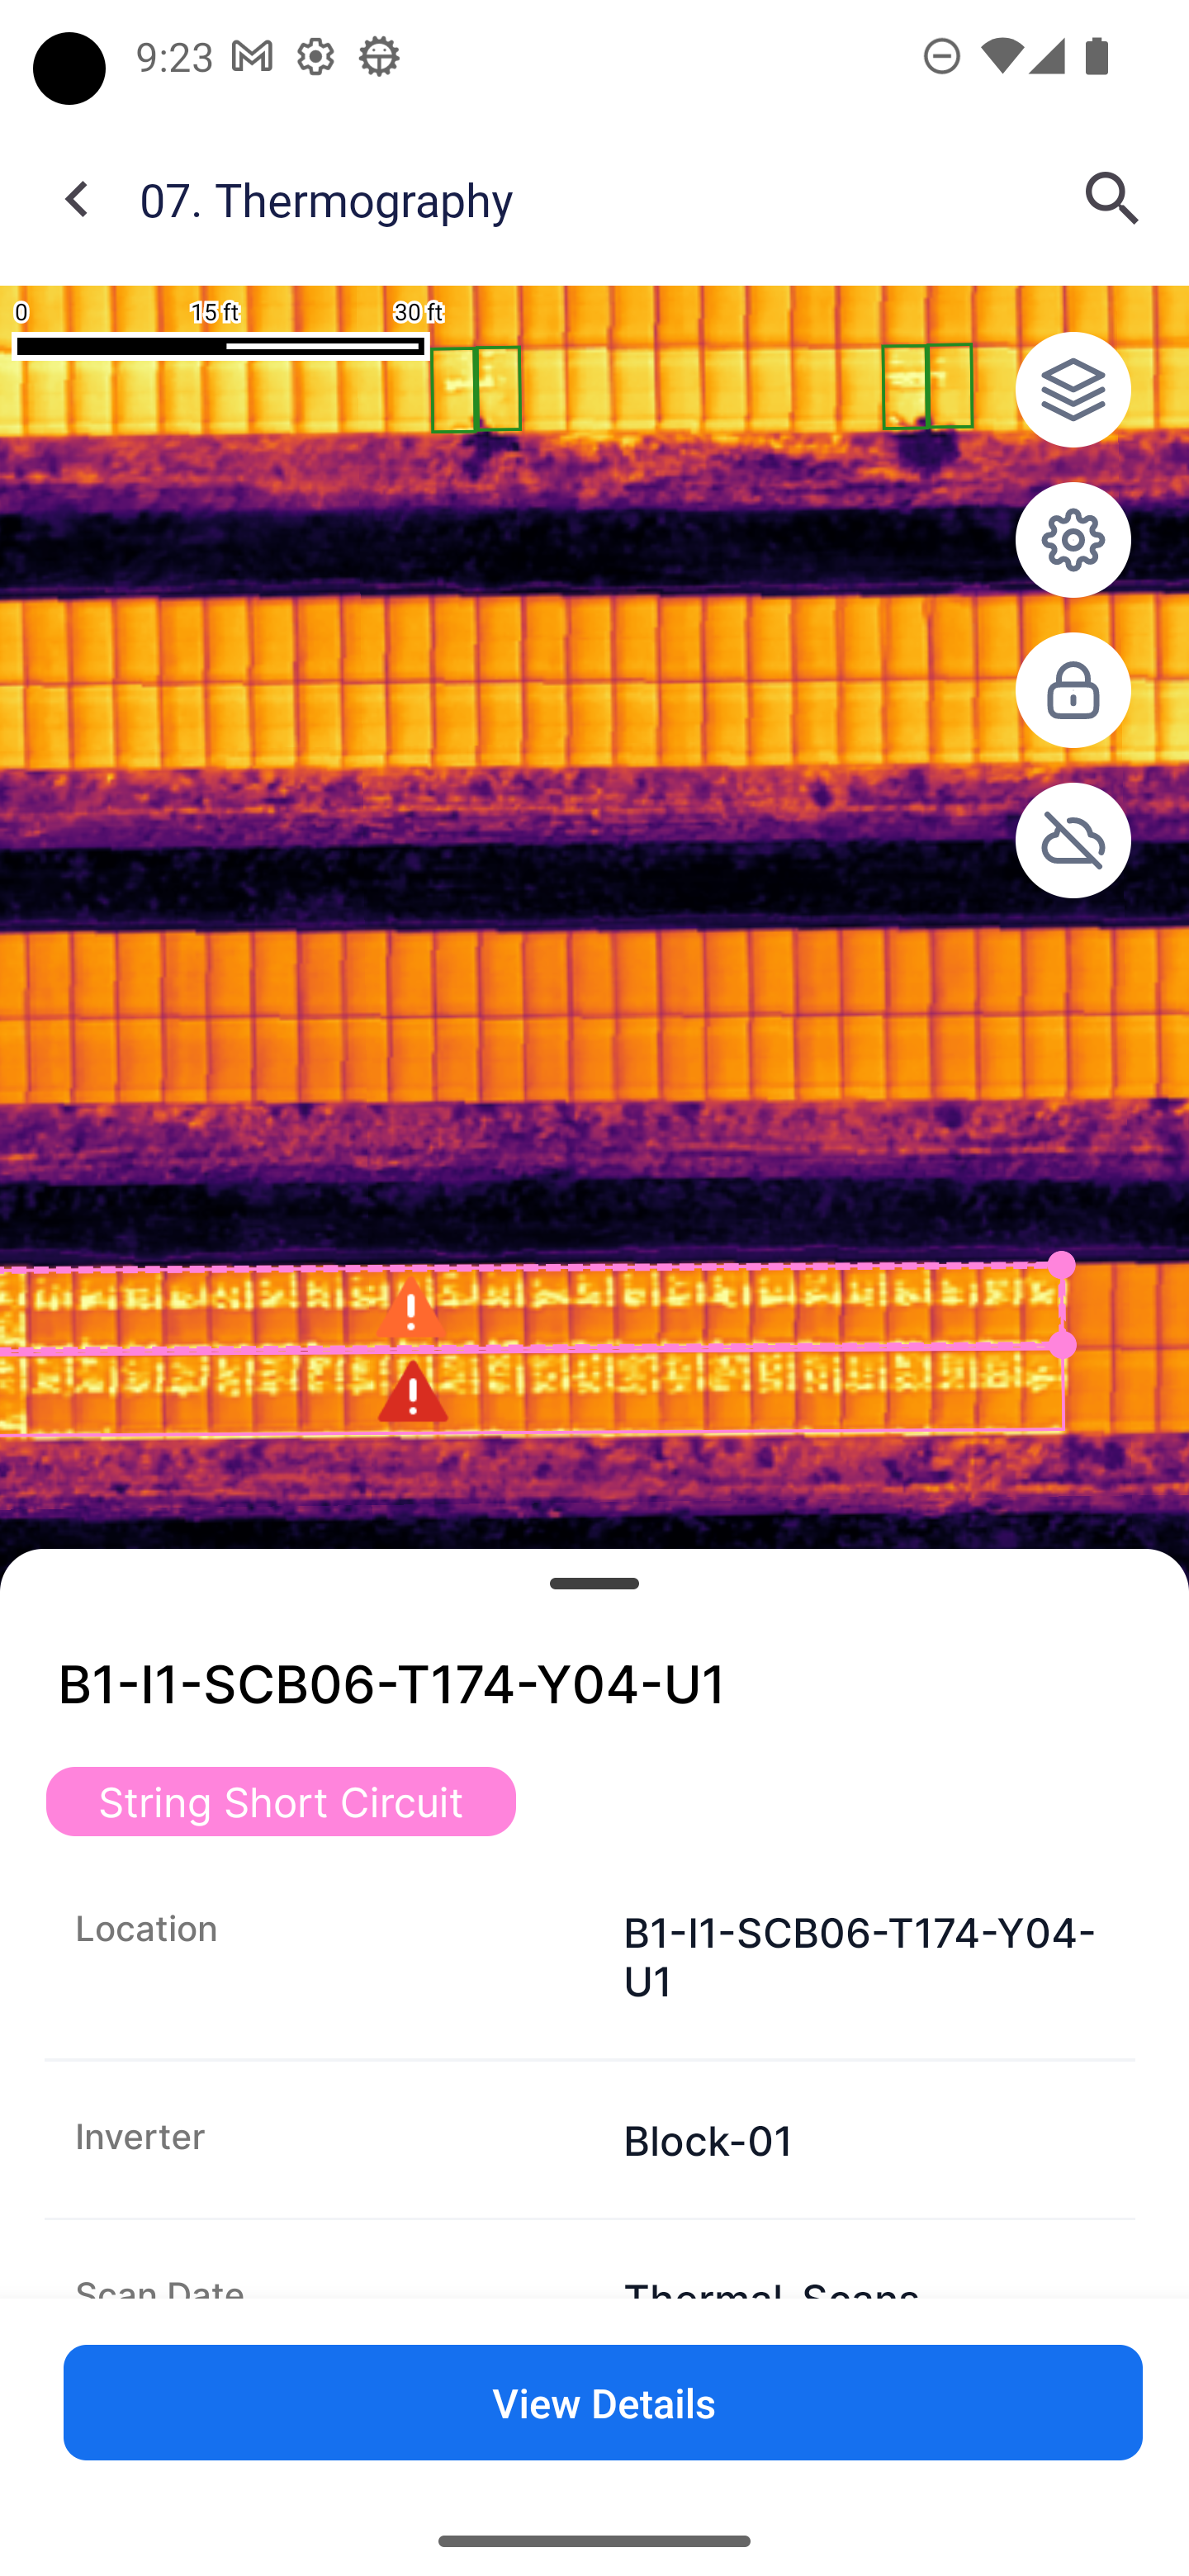
FIGURE 27: TASK DESCRIPTION AND CHECKLIST
8. To update the defect status, tap 'Status' and select the relevant status from the options.
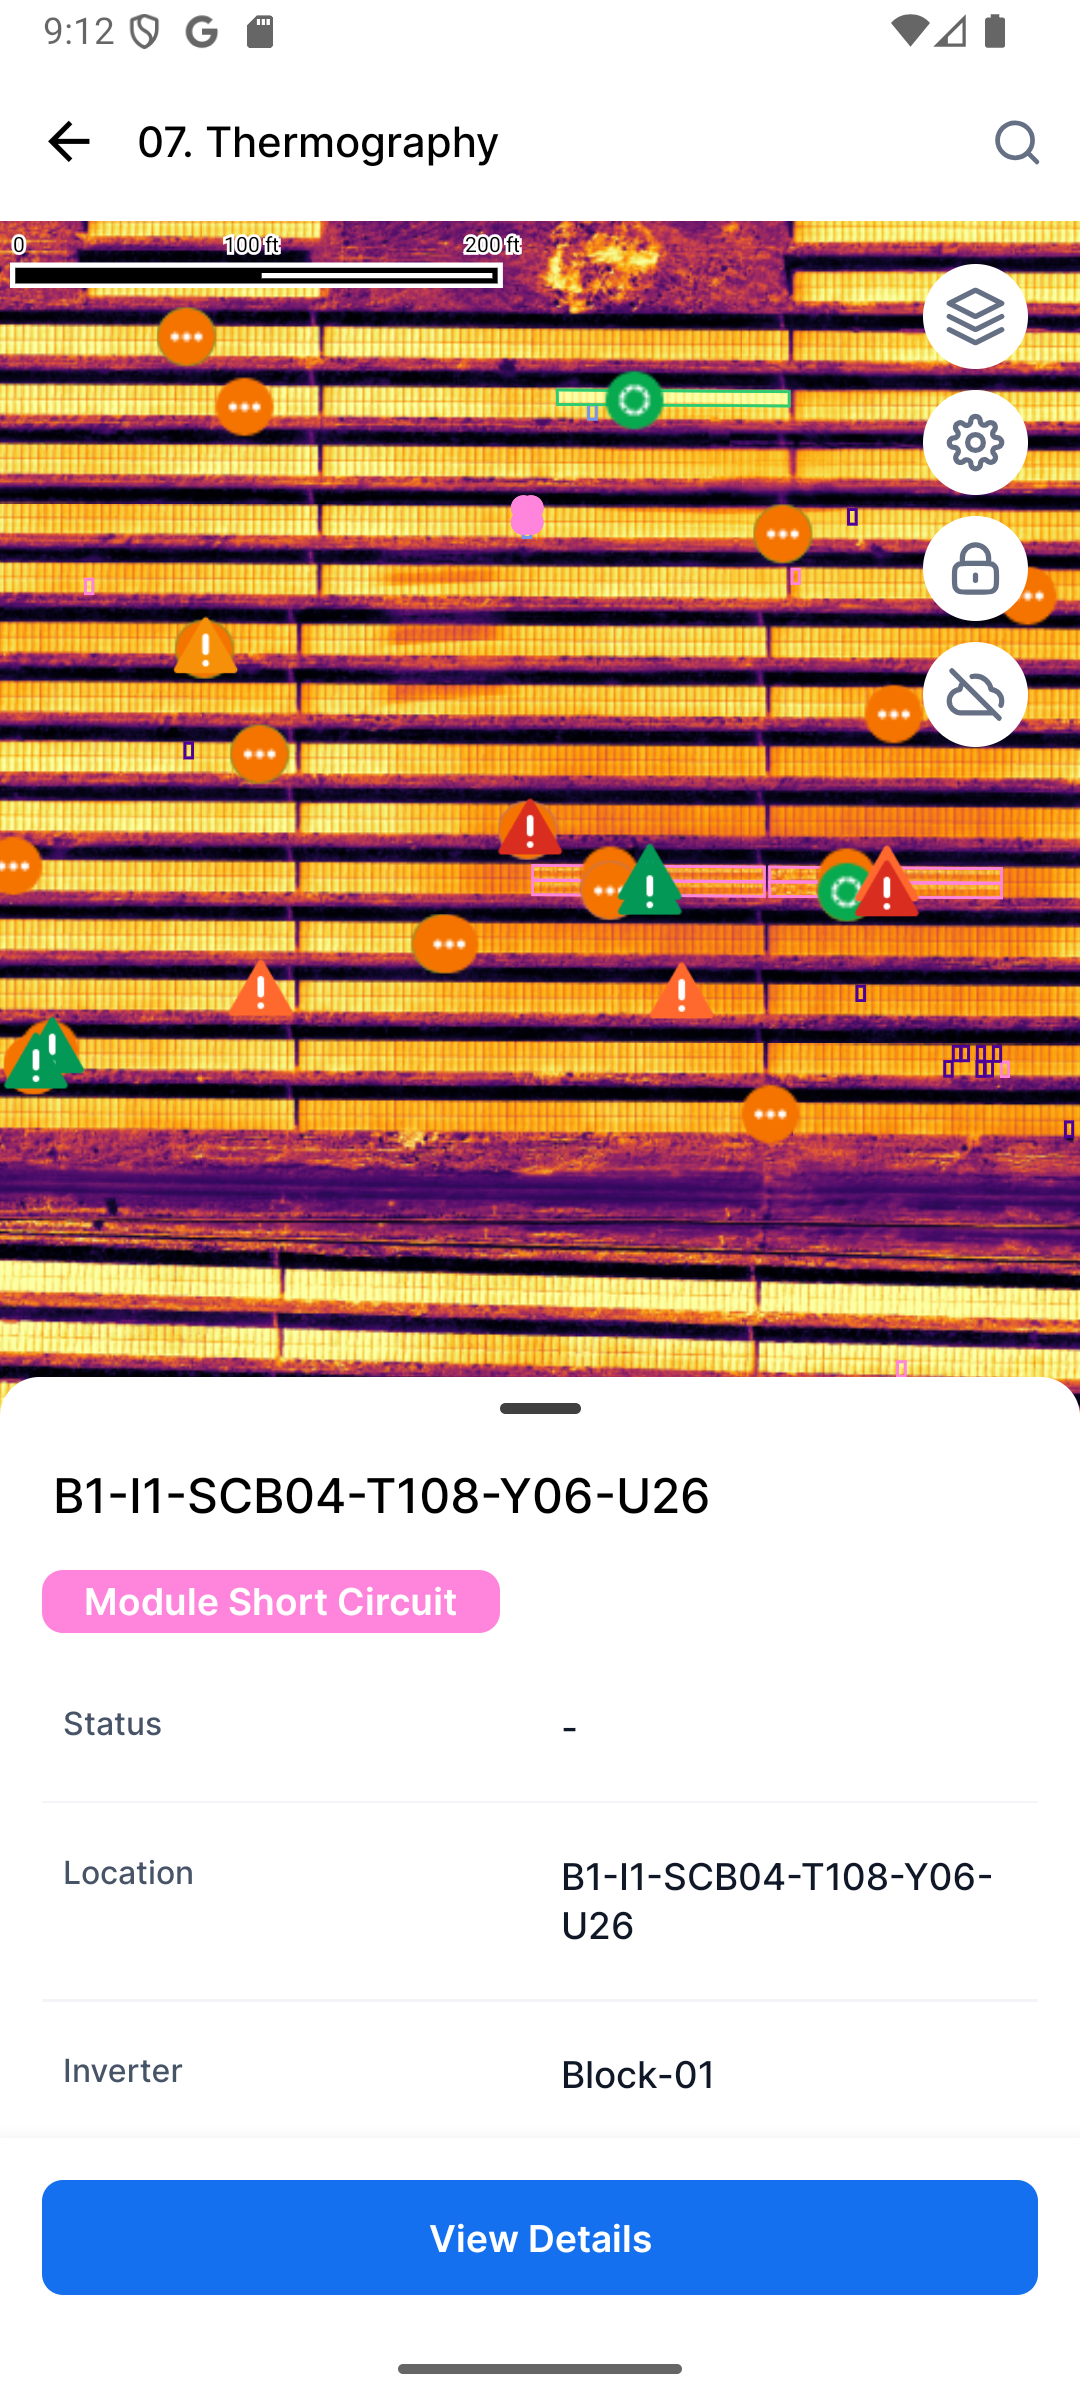
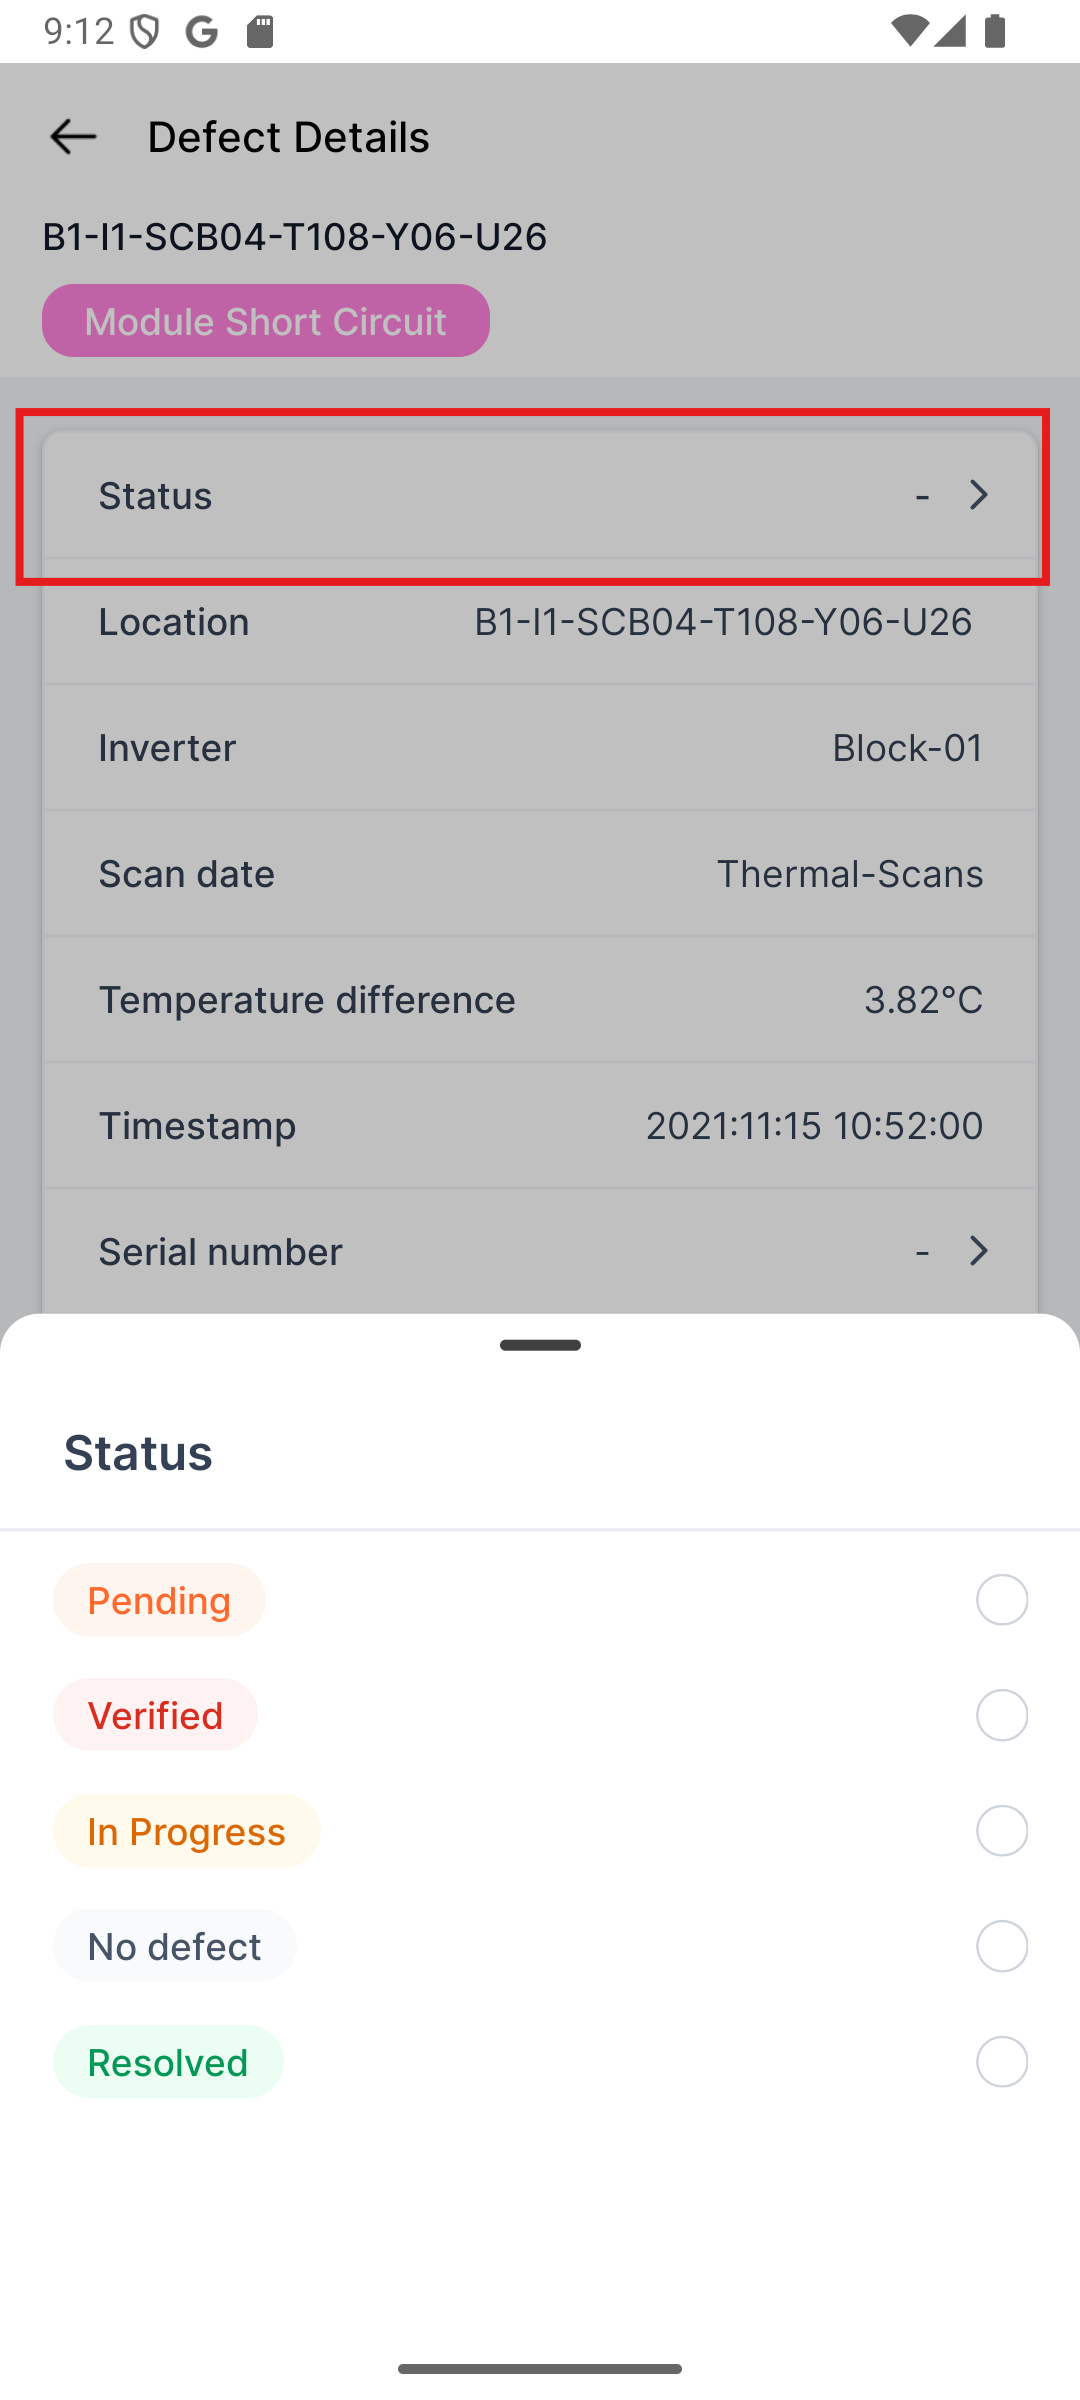
Figure 28: Defect status update
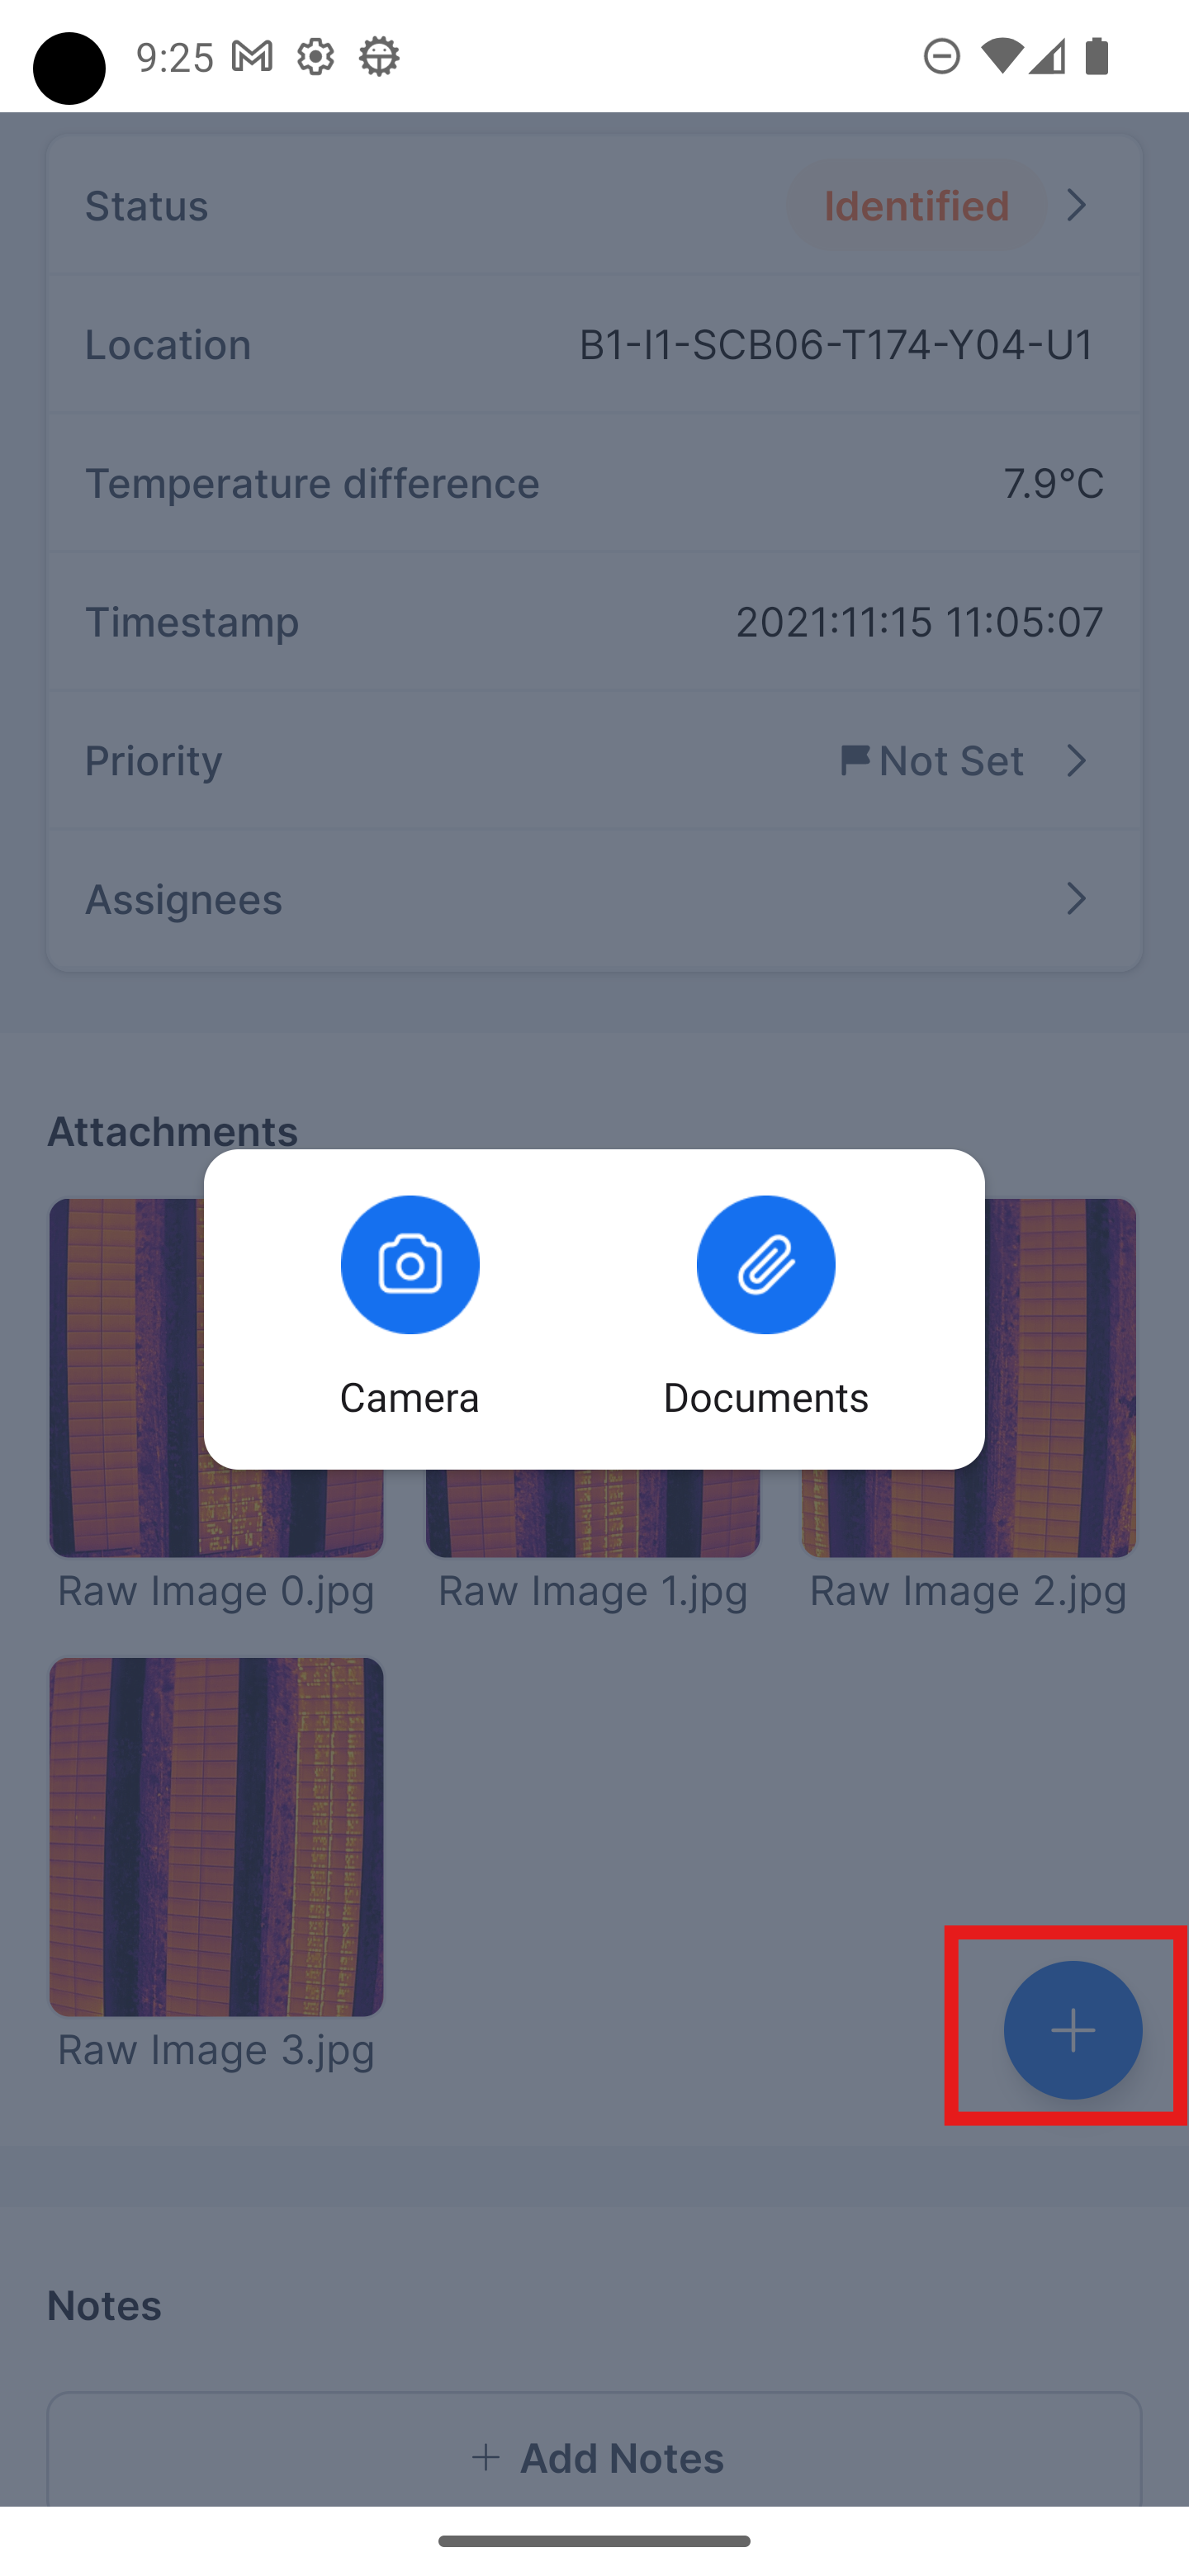
9. Tap on the '+' icon to attach photographs and files to a defect.
FIGURE 29: ATTACHMENTS AND CONVERSATIONS
10. You can easily re-classify defects using our mobile app! Just tap on the defect in the map view. Once you've selected it, choose the defect type you want to update from the drop-down list.
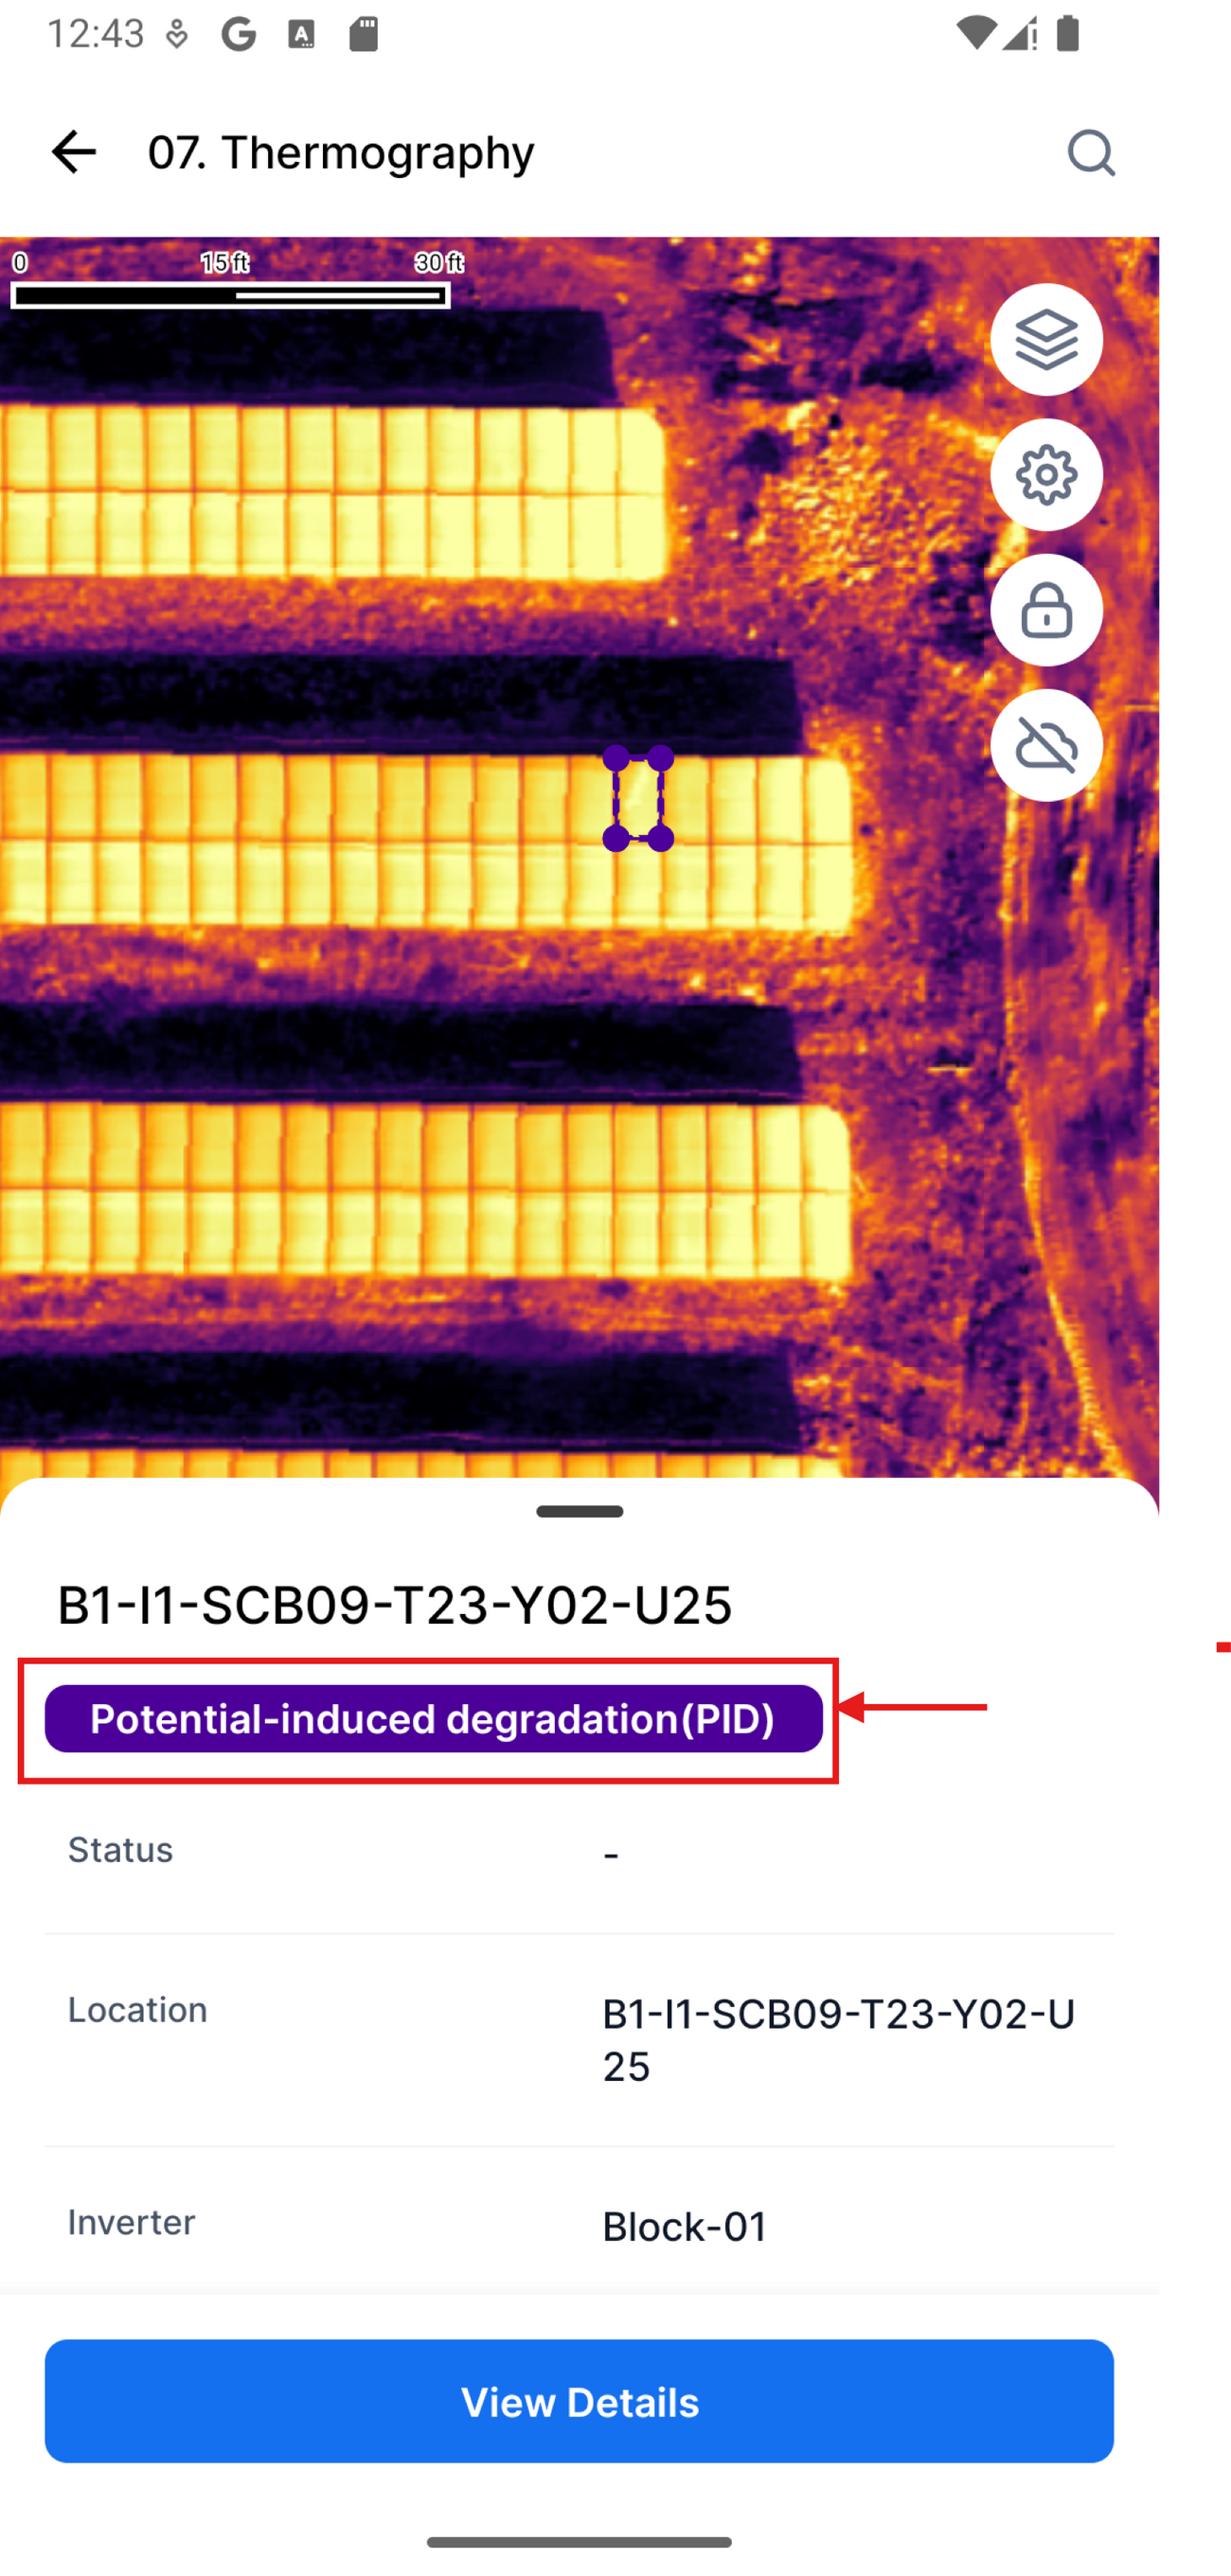
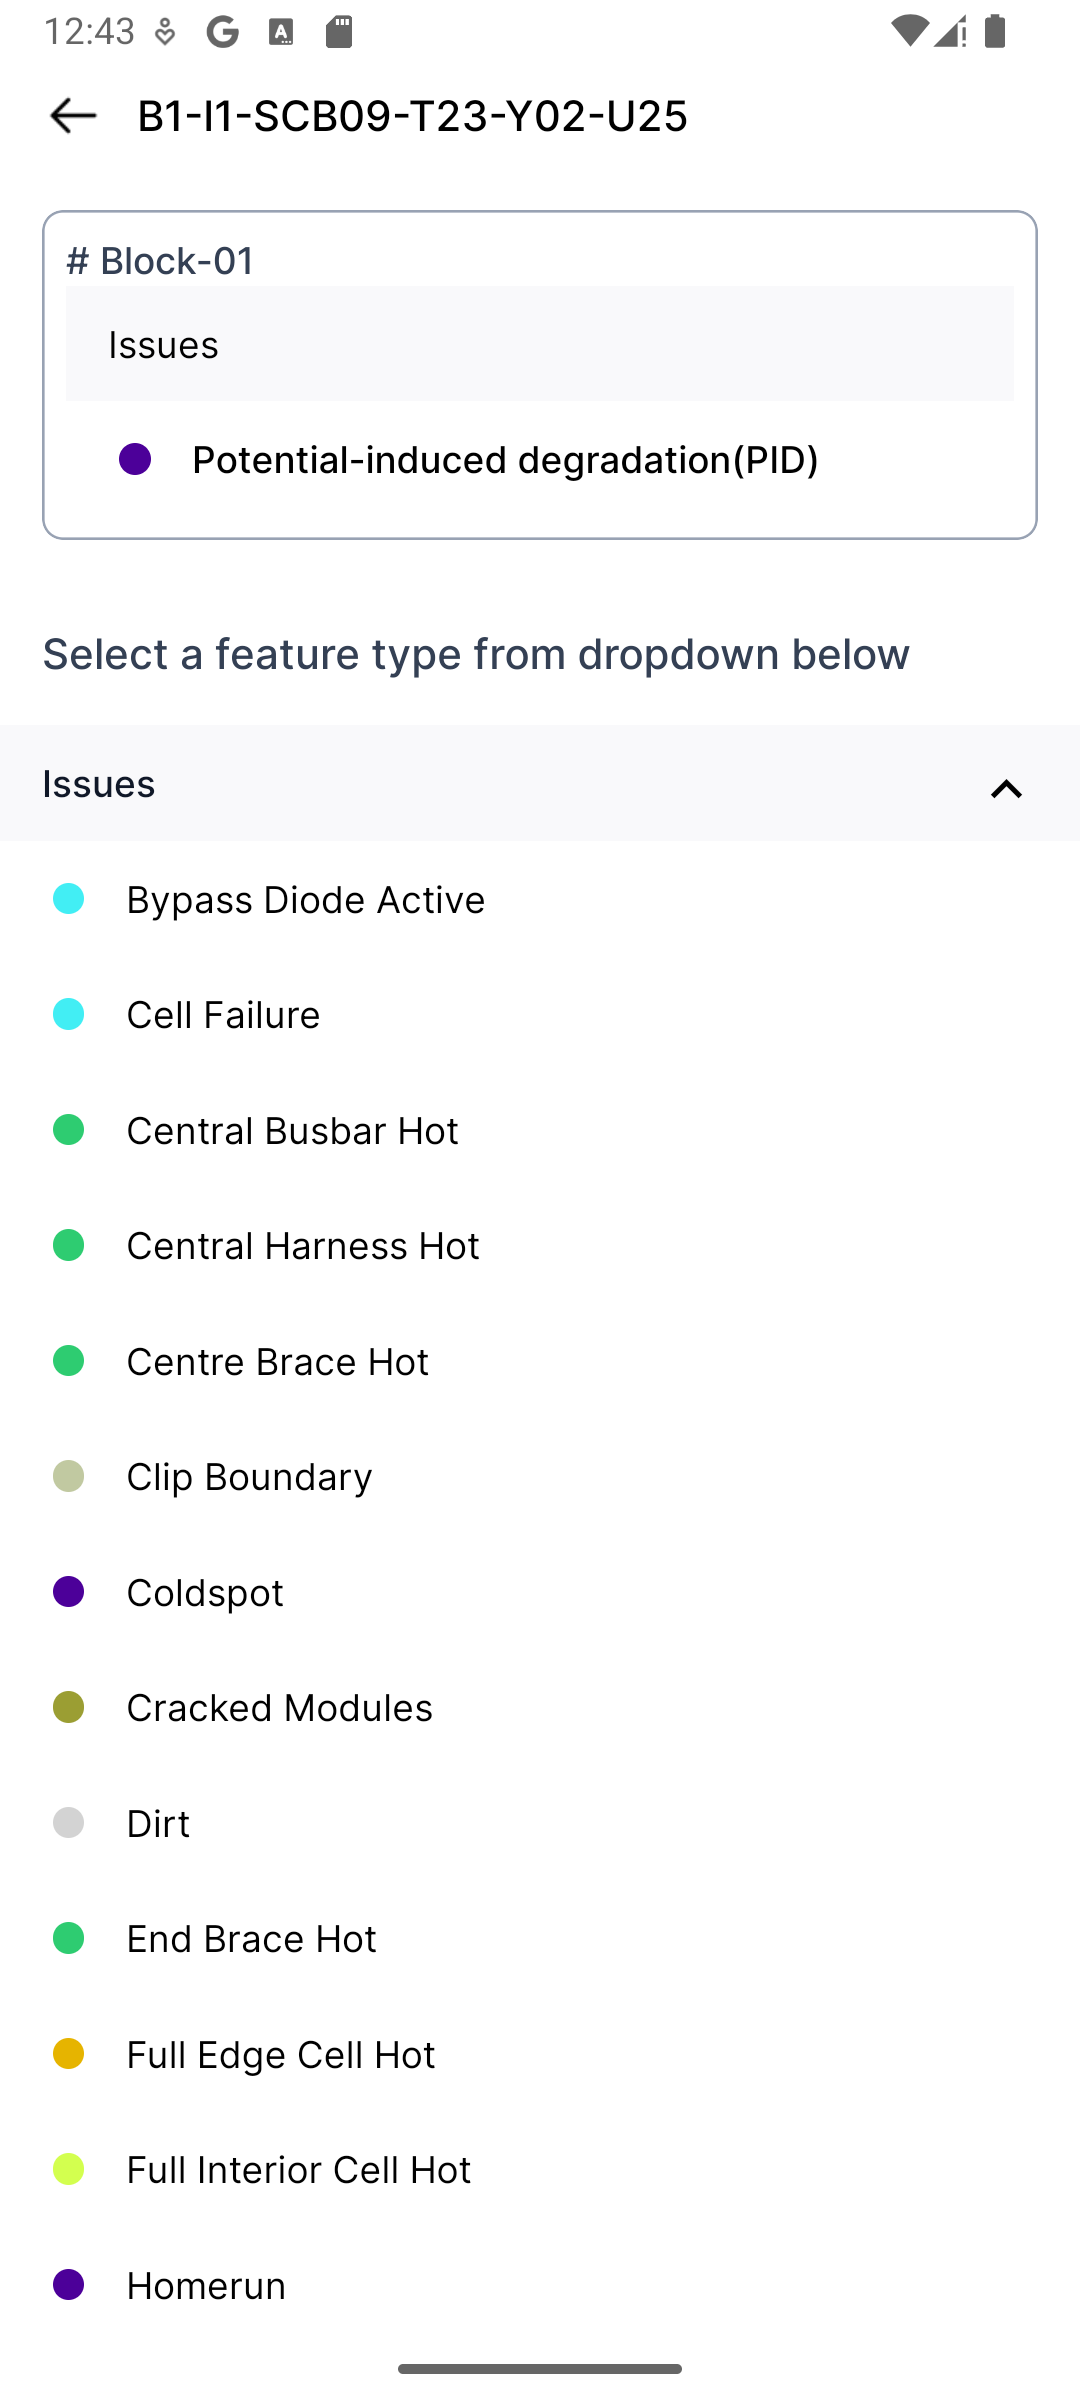
FIGURE 30: Defects re-classification in the mobile app
Therm FAQ
How to export reports from Therm?
To export a Therm report, click the 'Export' button and select 'Export as PDF' or 'Export as CSV' from the available options. This will allow you to extract the report in your preferred format.
How to change update defect with assignee/status and priority?
An identified defect can have an assignee, a relevant status, and a priority for the field team to validate and remediate the defects.
How to filter by defects in the map view?
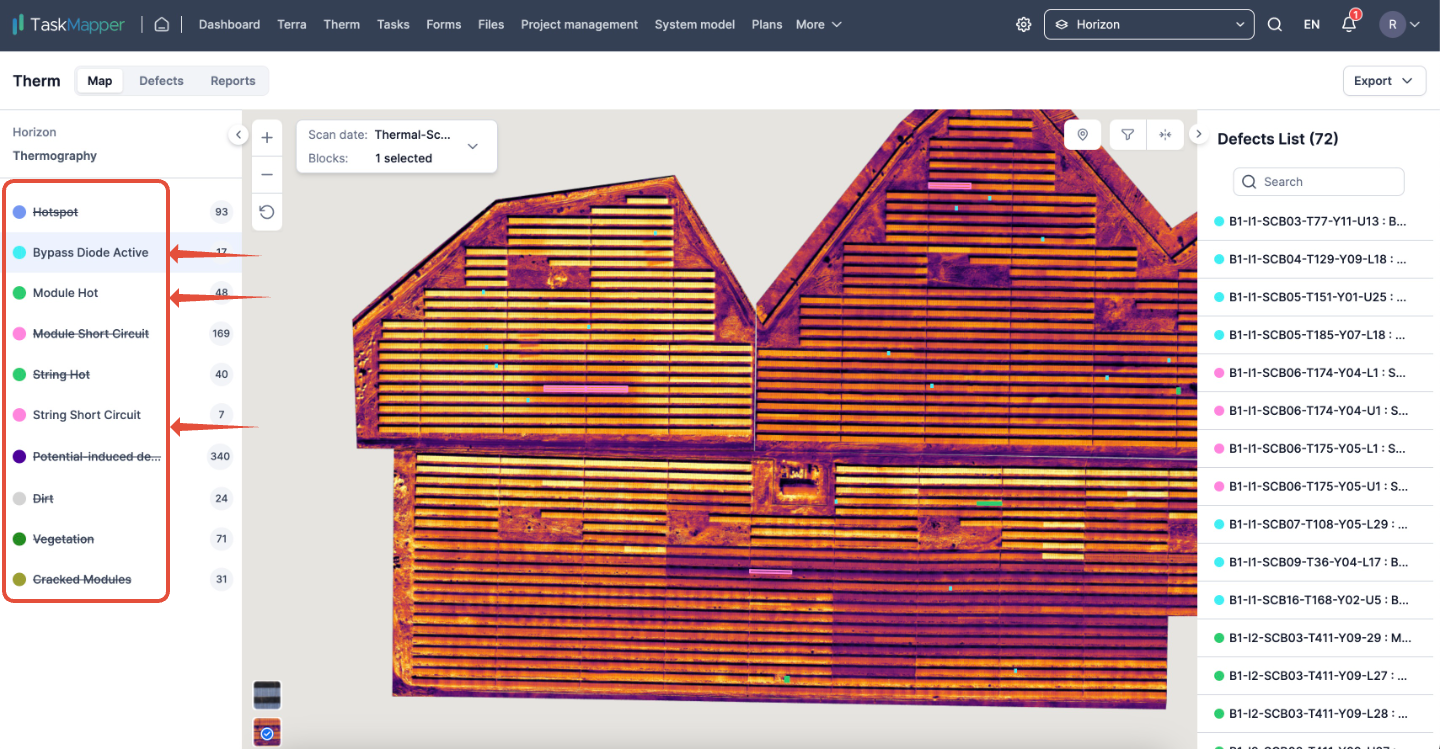
On the left side of the screen, you can find a list of defects that are colour-coded for easy identification on the map view. You can filter the defects on the map by selecting specific ones or deselecting multiple ones. Here are the steps to do so:
1) Filtering by a defect
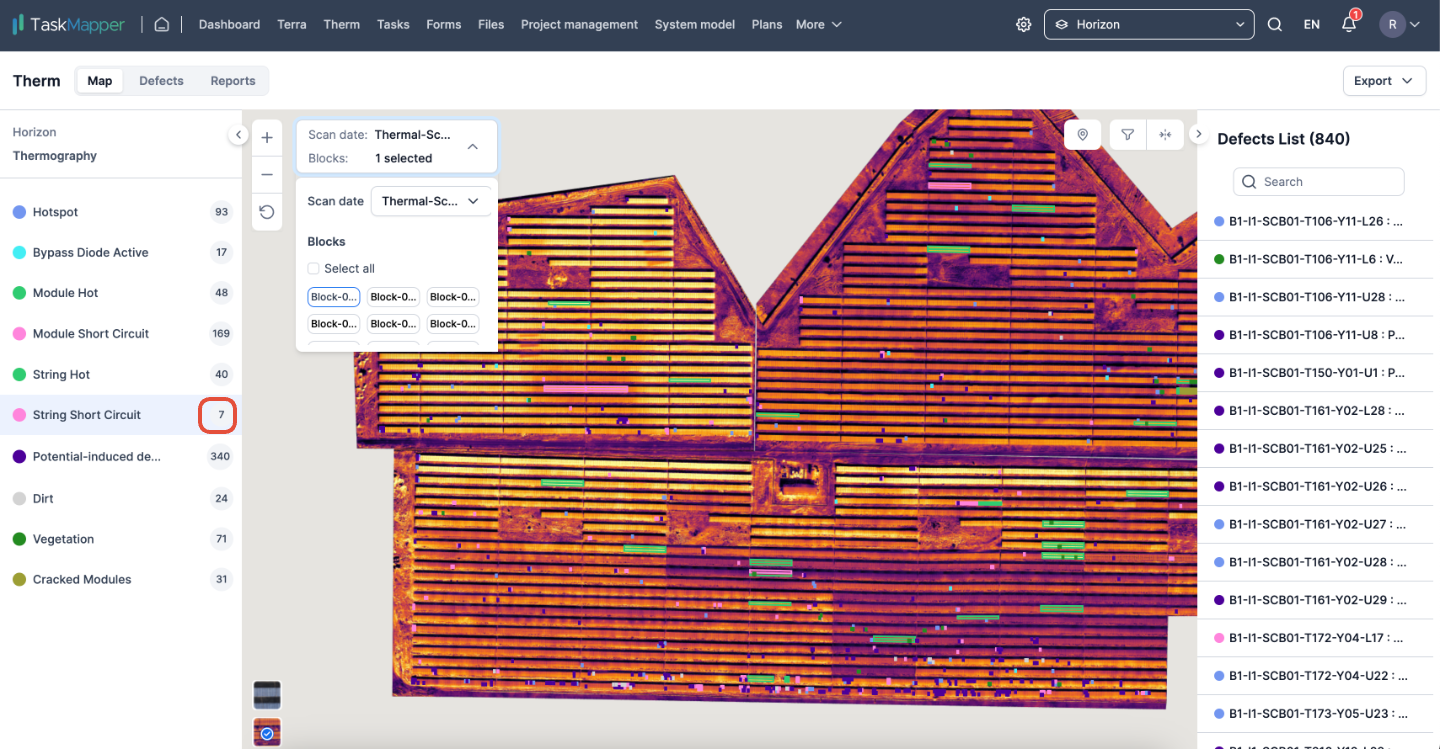
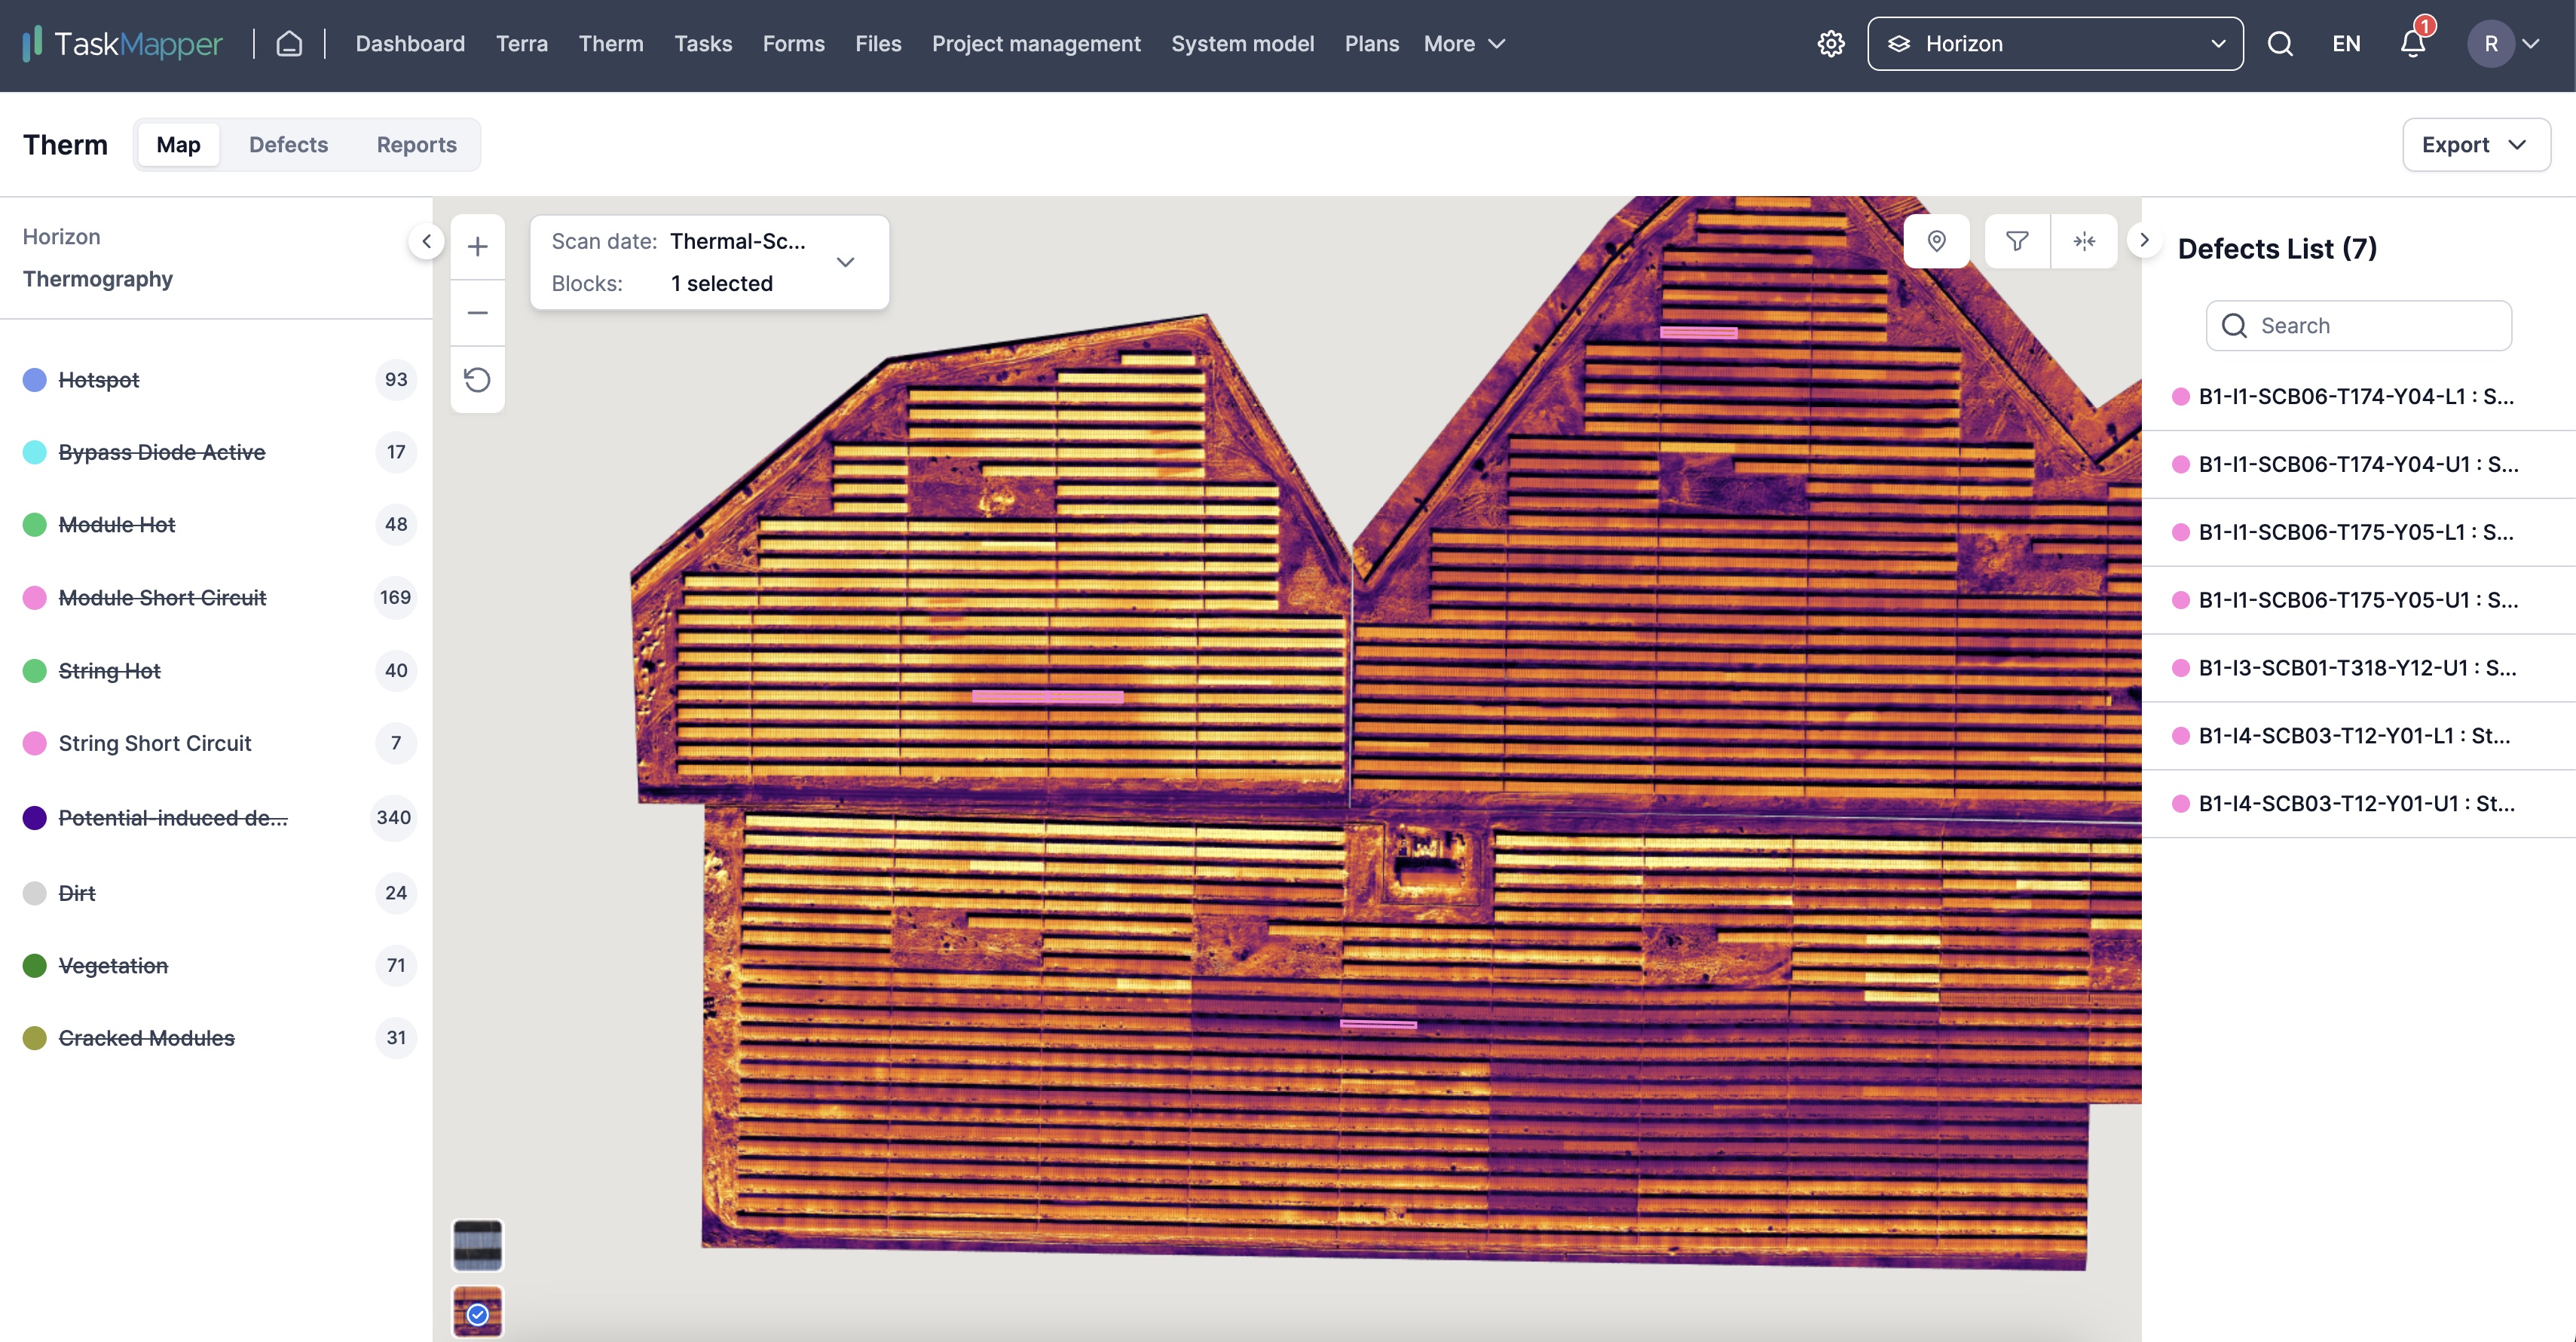
Click on the number next to the defect to view only that particular defect on the map and defect list.
Filtered view
2) Select/Deselect multiple defects
Click on the defect name to select or deselect the defect
How to filter by block/substation?
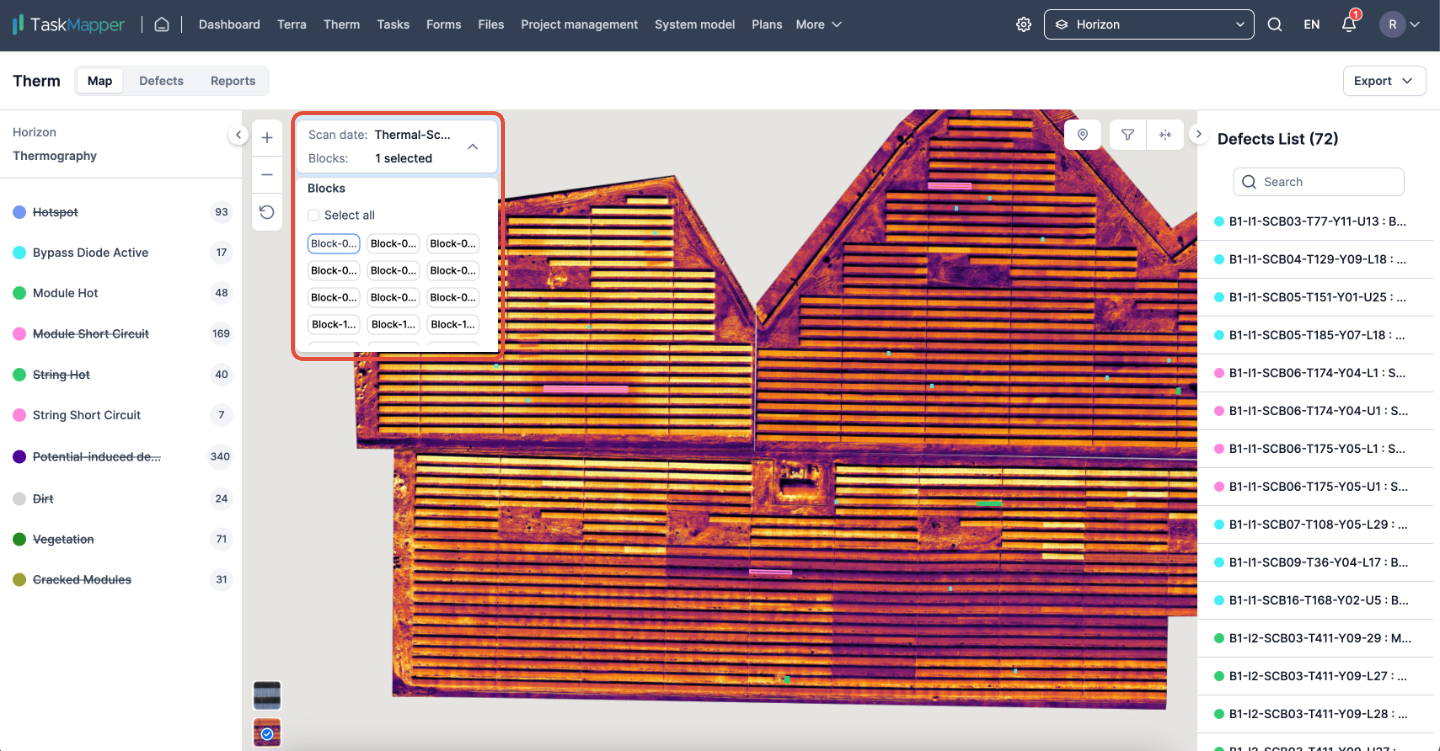
To filter by blocks, click on the Scan date/Block drop-down in the map view. Select the blocks you would like to view on the map.
How to create therm-specific dashboards?
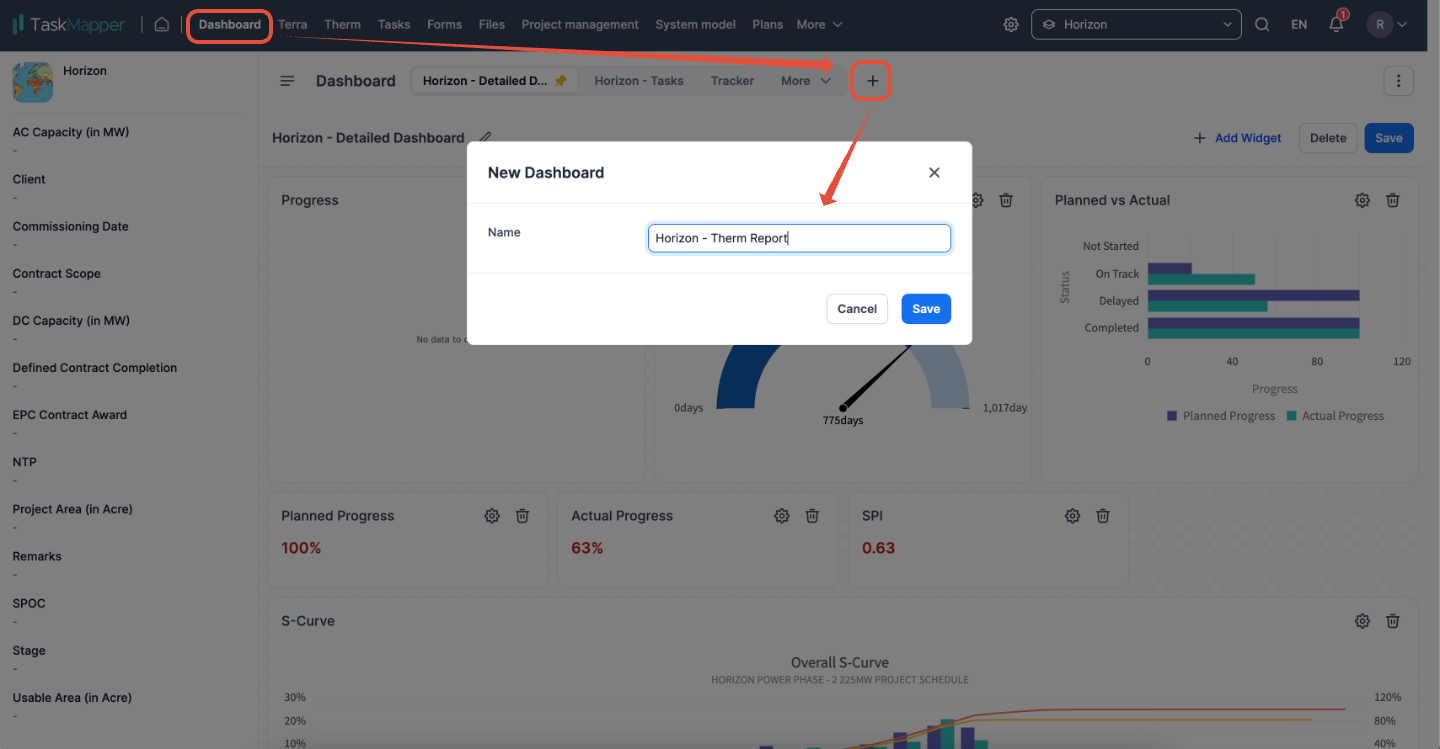
To create a dashboard with Therm data, go to the dashboard and click on the '+' icon to add a new dashboard.
Below are the further steps
1) Enter a dashboard name and click 'Save'.
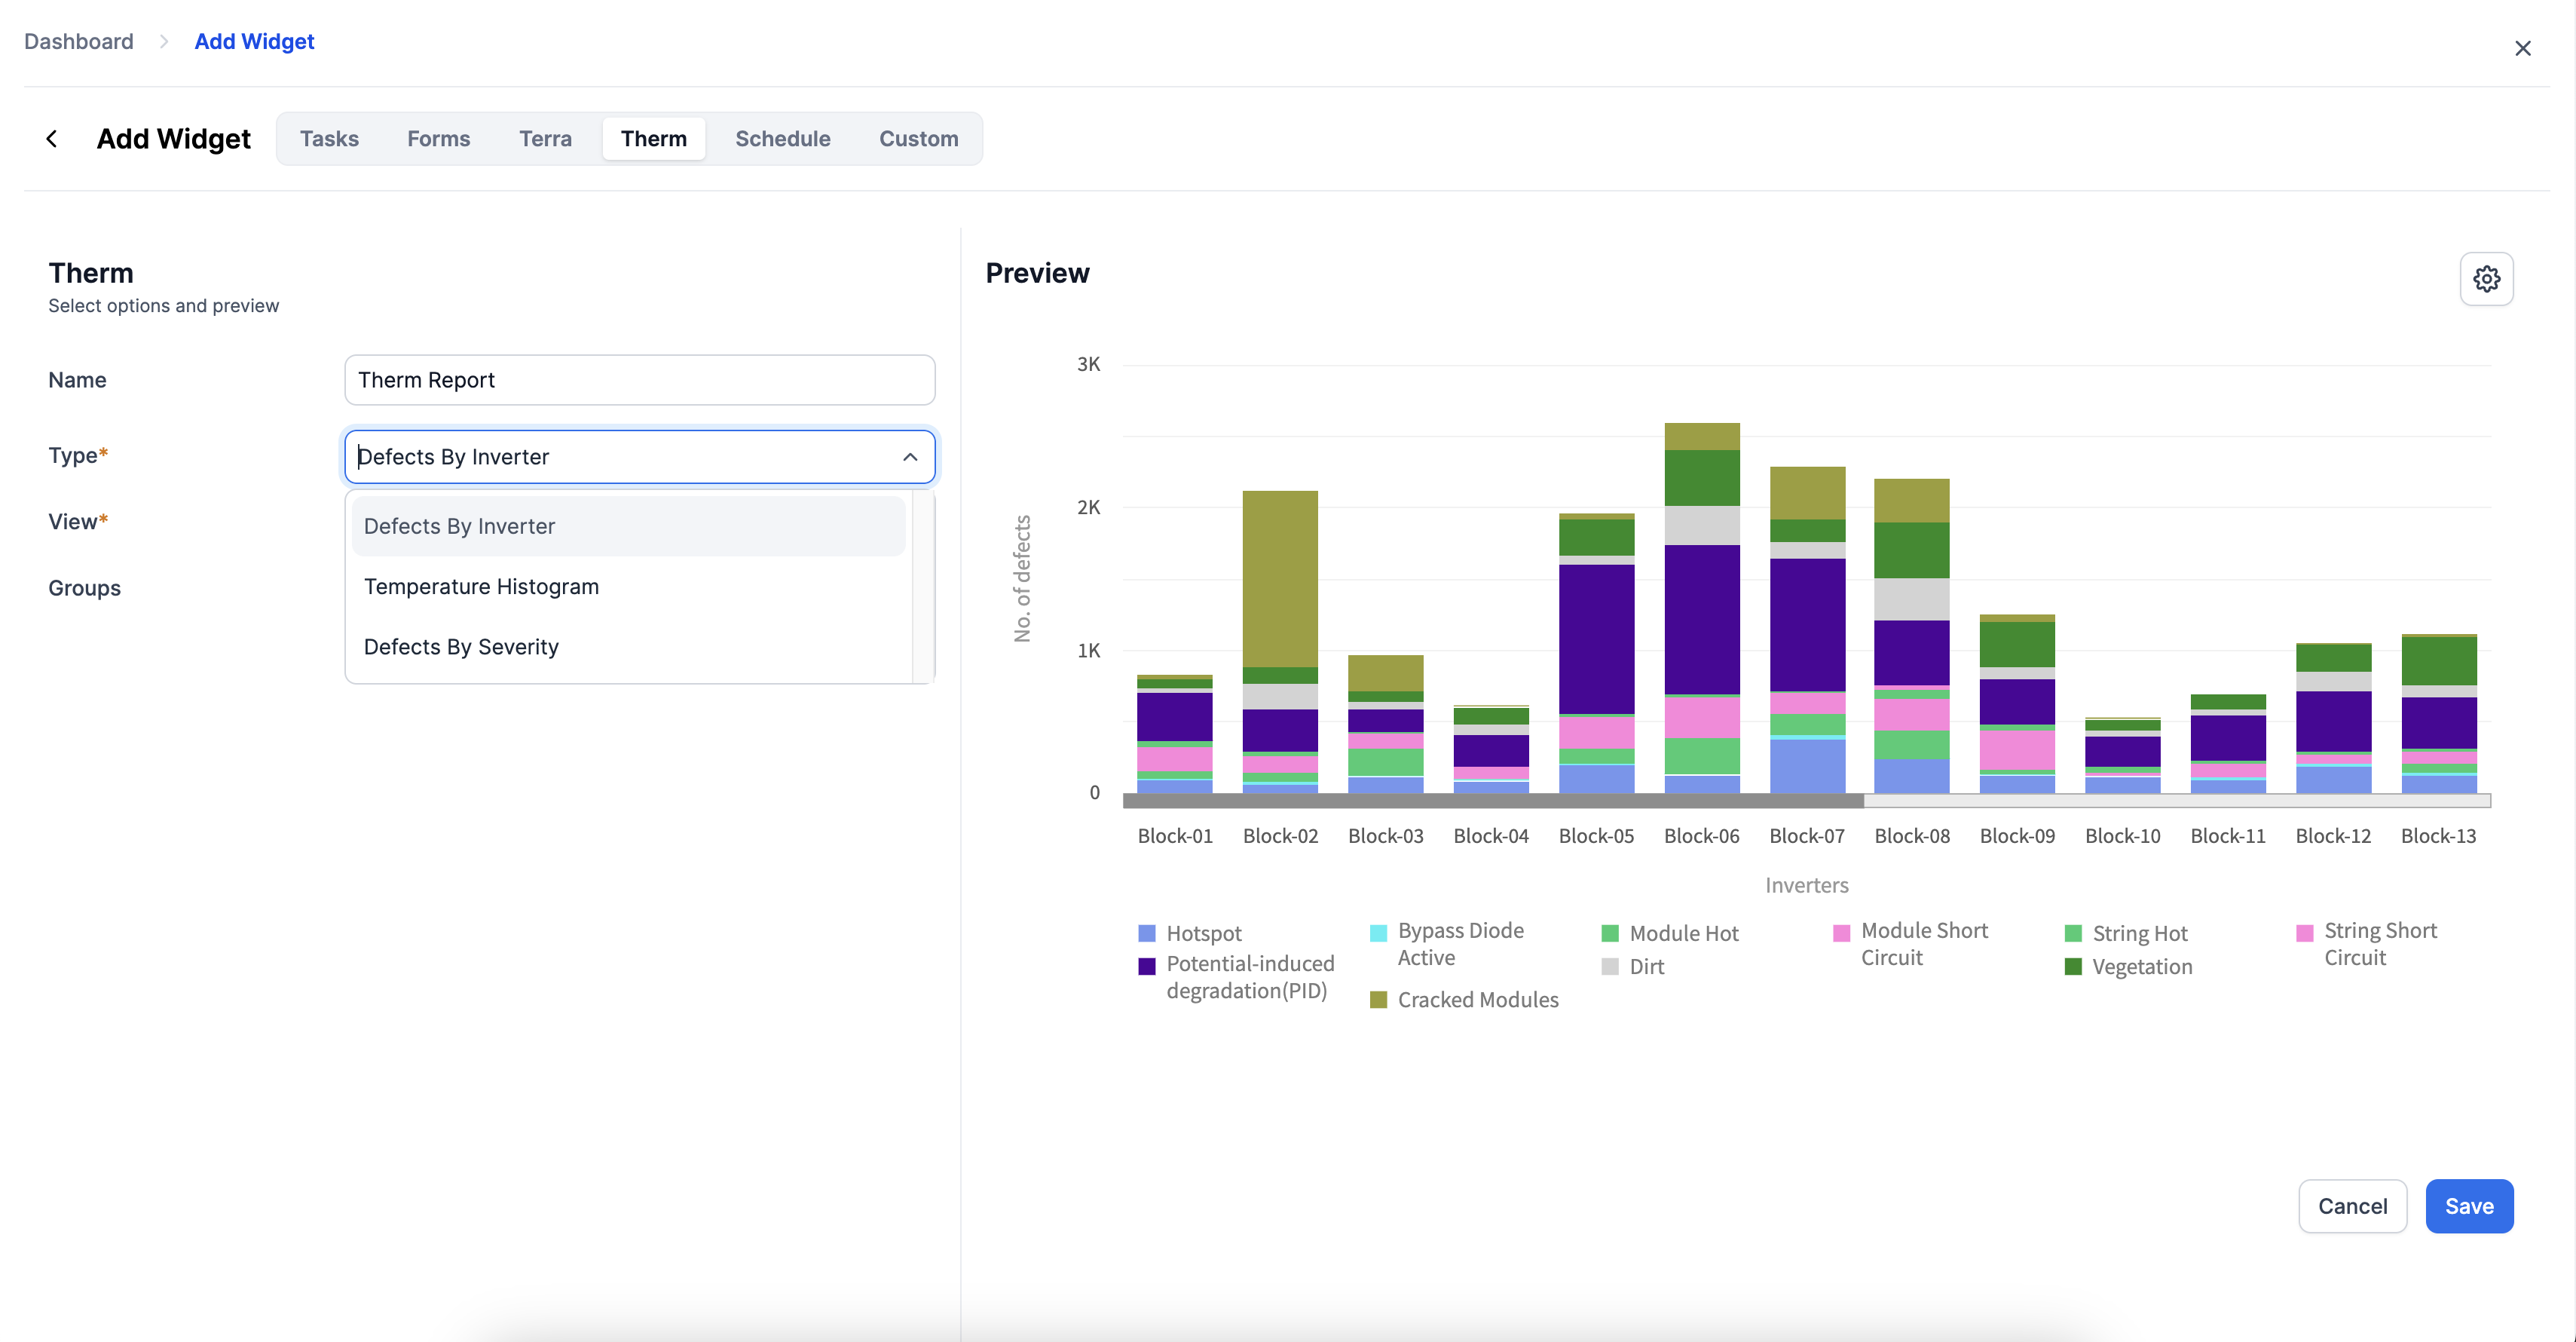
2) Click the 'Add Widget' button to add therm-specific widgets. From there, you can select which widgets to add to your dashboard. The options for therm-specific widgets include 'Defects by Inverter', 'Temperature Histogram', and 'Defects by Severity'. Click on 'Save' to complete.
Note: If you're looking to stay on top of your tasks, you might want to consider adding task widgets to your dashboard. This will make it easy to view all of your tasks or defects converted to tasks in one place and stay organized. Alternatively, you could create a separate dashboard specifically for tasks
How to download or print a dashboard?
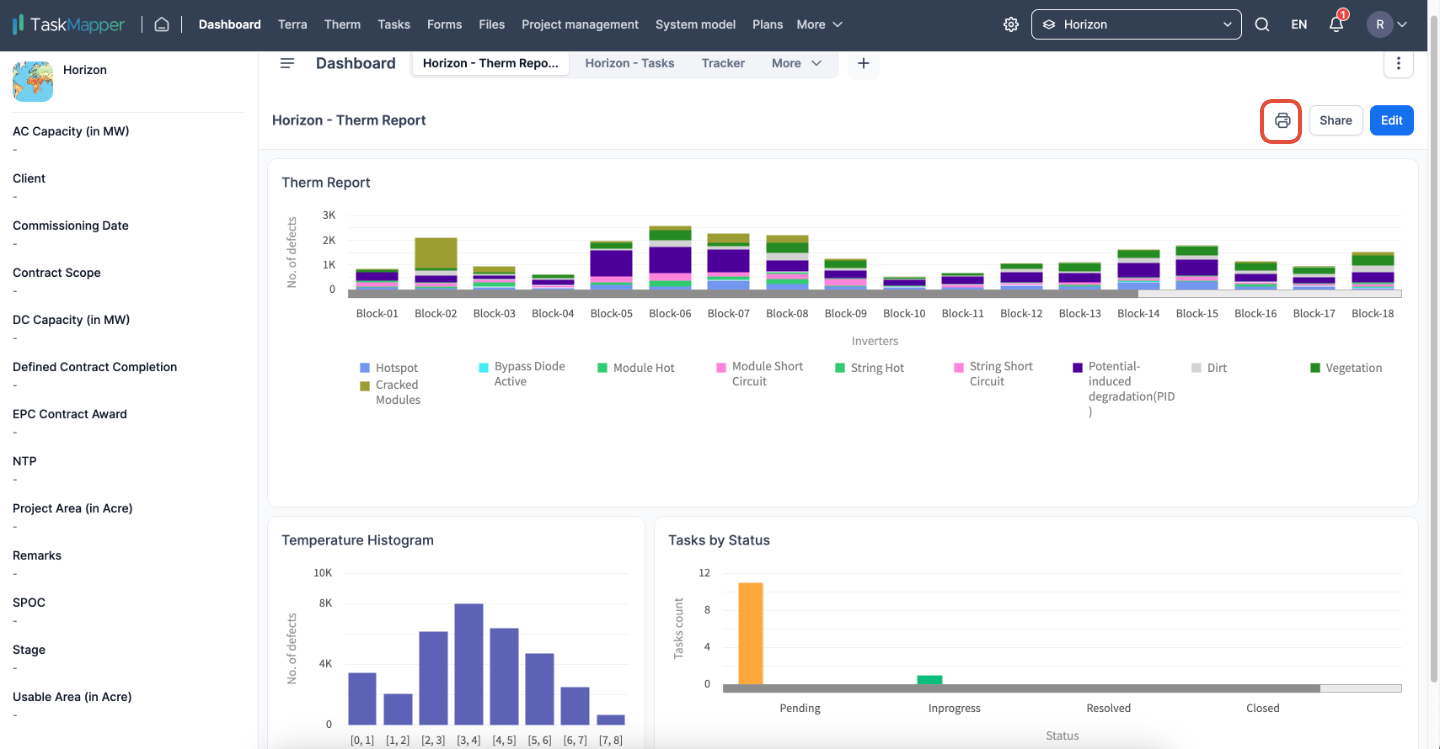
Click on the print icon in the dashboard view to generate a PDF report.


