Maps
Last updated October 7, 2024
TABLE OF CONTENTS
- How to add tasks or forms to the map?
- How to enable or disable zooming into the new map when switching between maps (toggle fly)?
- How to enable or disable labels?
- How to toggle visibility of tasks/ forms on the map?
- How to filter tasks/ forms that are visible on the map?
- How to filter vectors that are visible on the map by colour?
- How to filter vectors that are visible on the map by attribute?
- How to toggle map view between Street or Satellite?
- How to compare maps?
- How to edit a feature type?
How to perform volume calculations?
Volume calculations provide accurate measurements for the space in a given area. The cutting and filling area for each section is found using the polygon or net area calculation method, and the volume is determined by multiplying the average area by the distance between sections.
1. To begin calculating an area's volume, select the polygon tool from the toolbox and draw the area on the map.
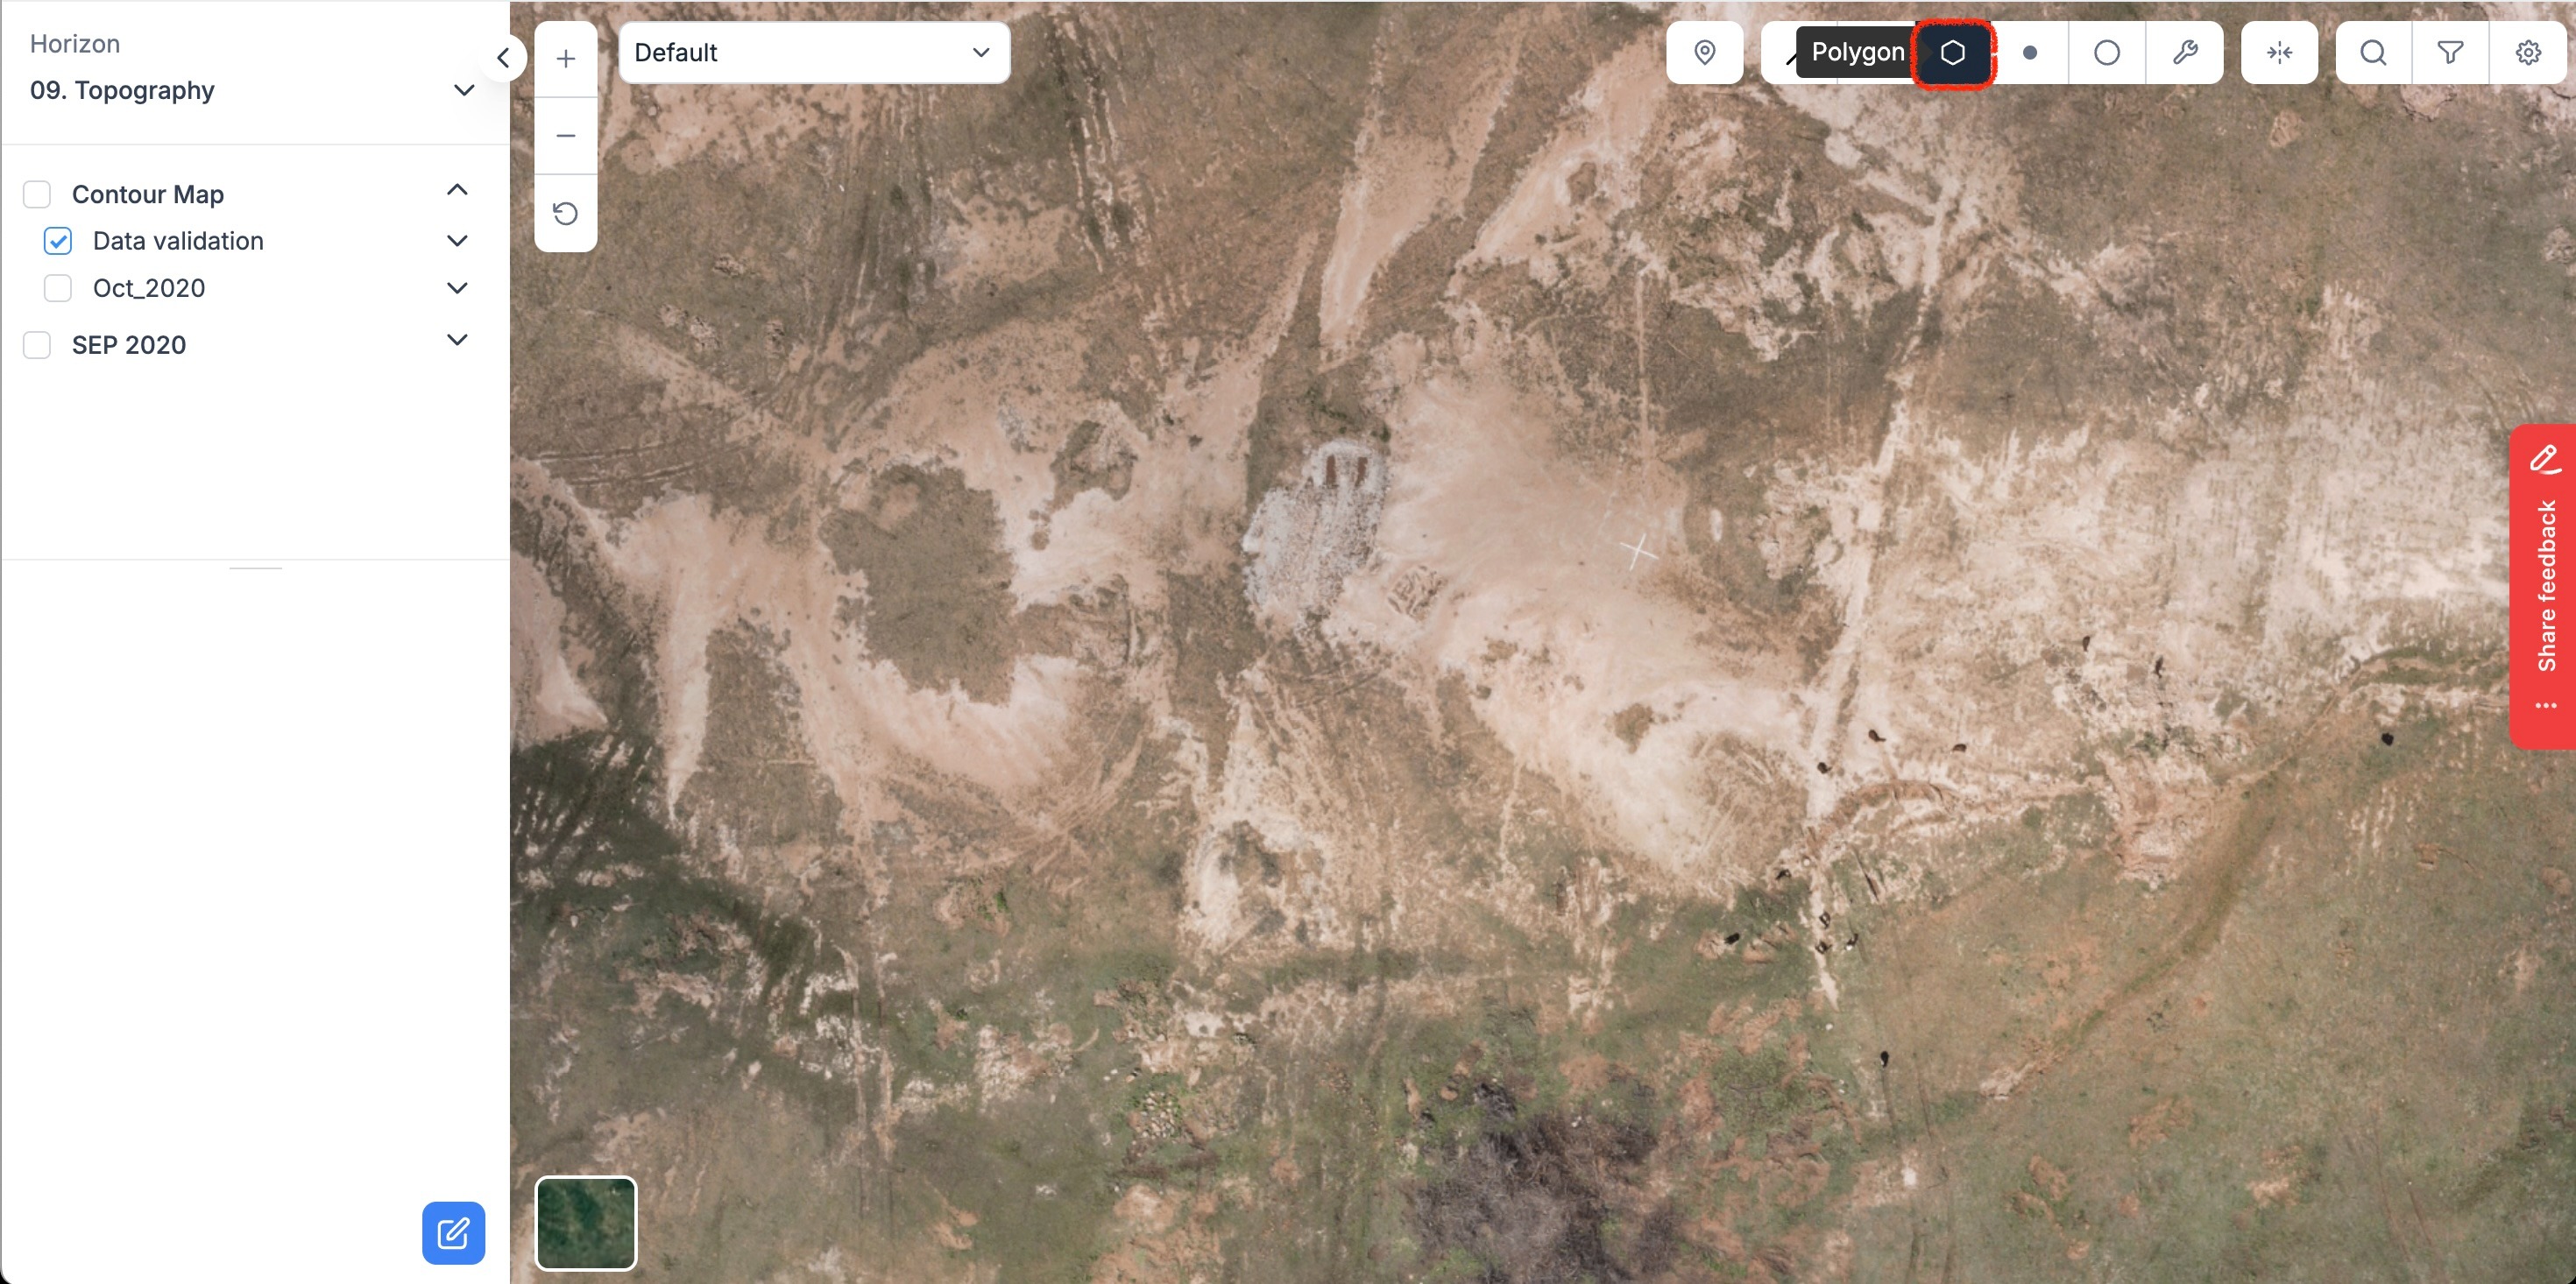
FIGURE 1: POLYGON MARKER TOOL
2. Click on the area and select 'Elevation Profile' from the toolbox. Select the method parameter as 'Base Height' and layer as 'DSM' in the dialogue box.
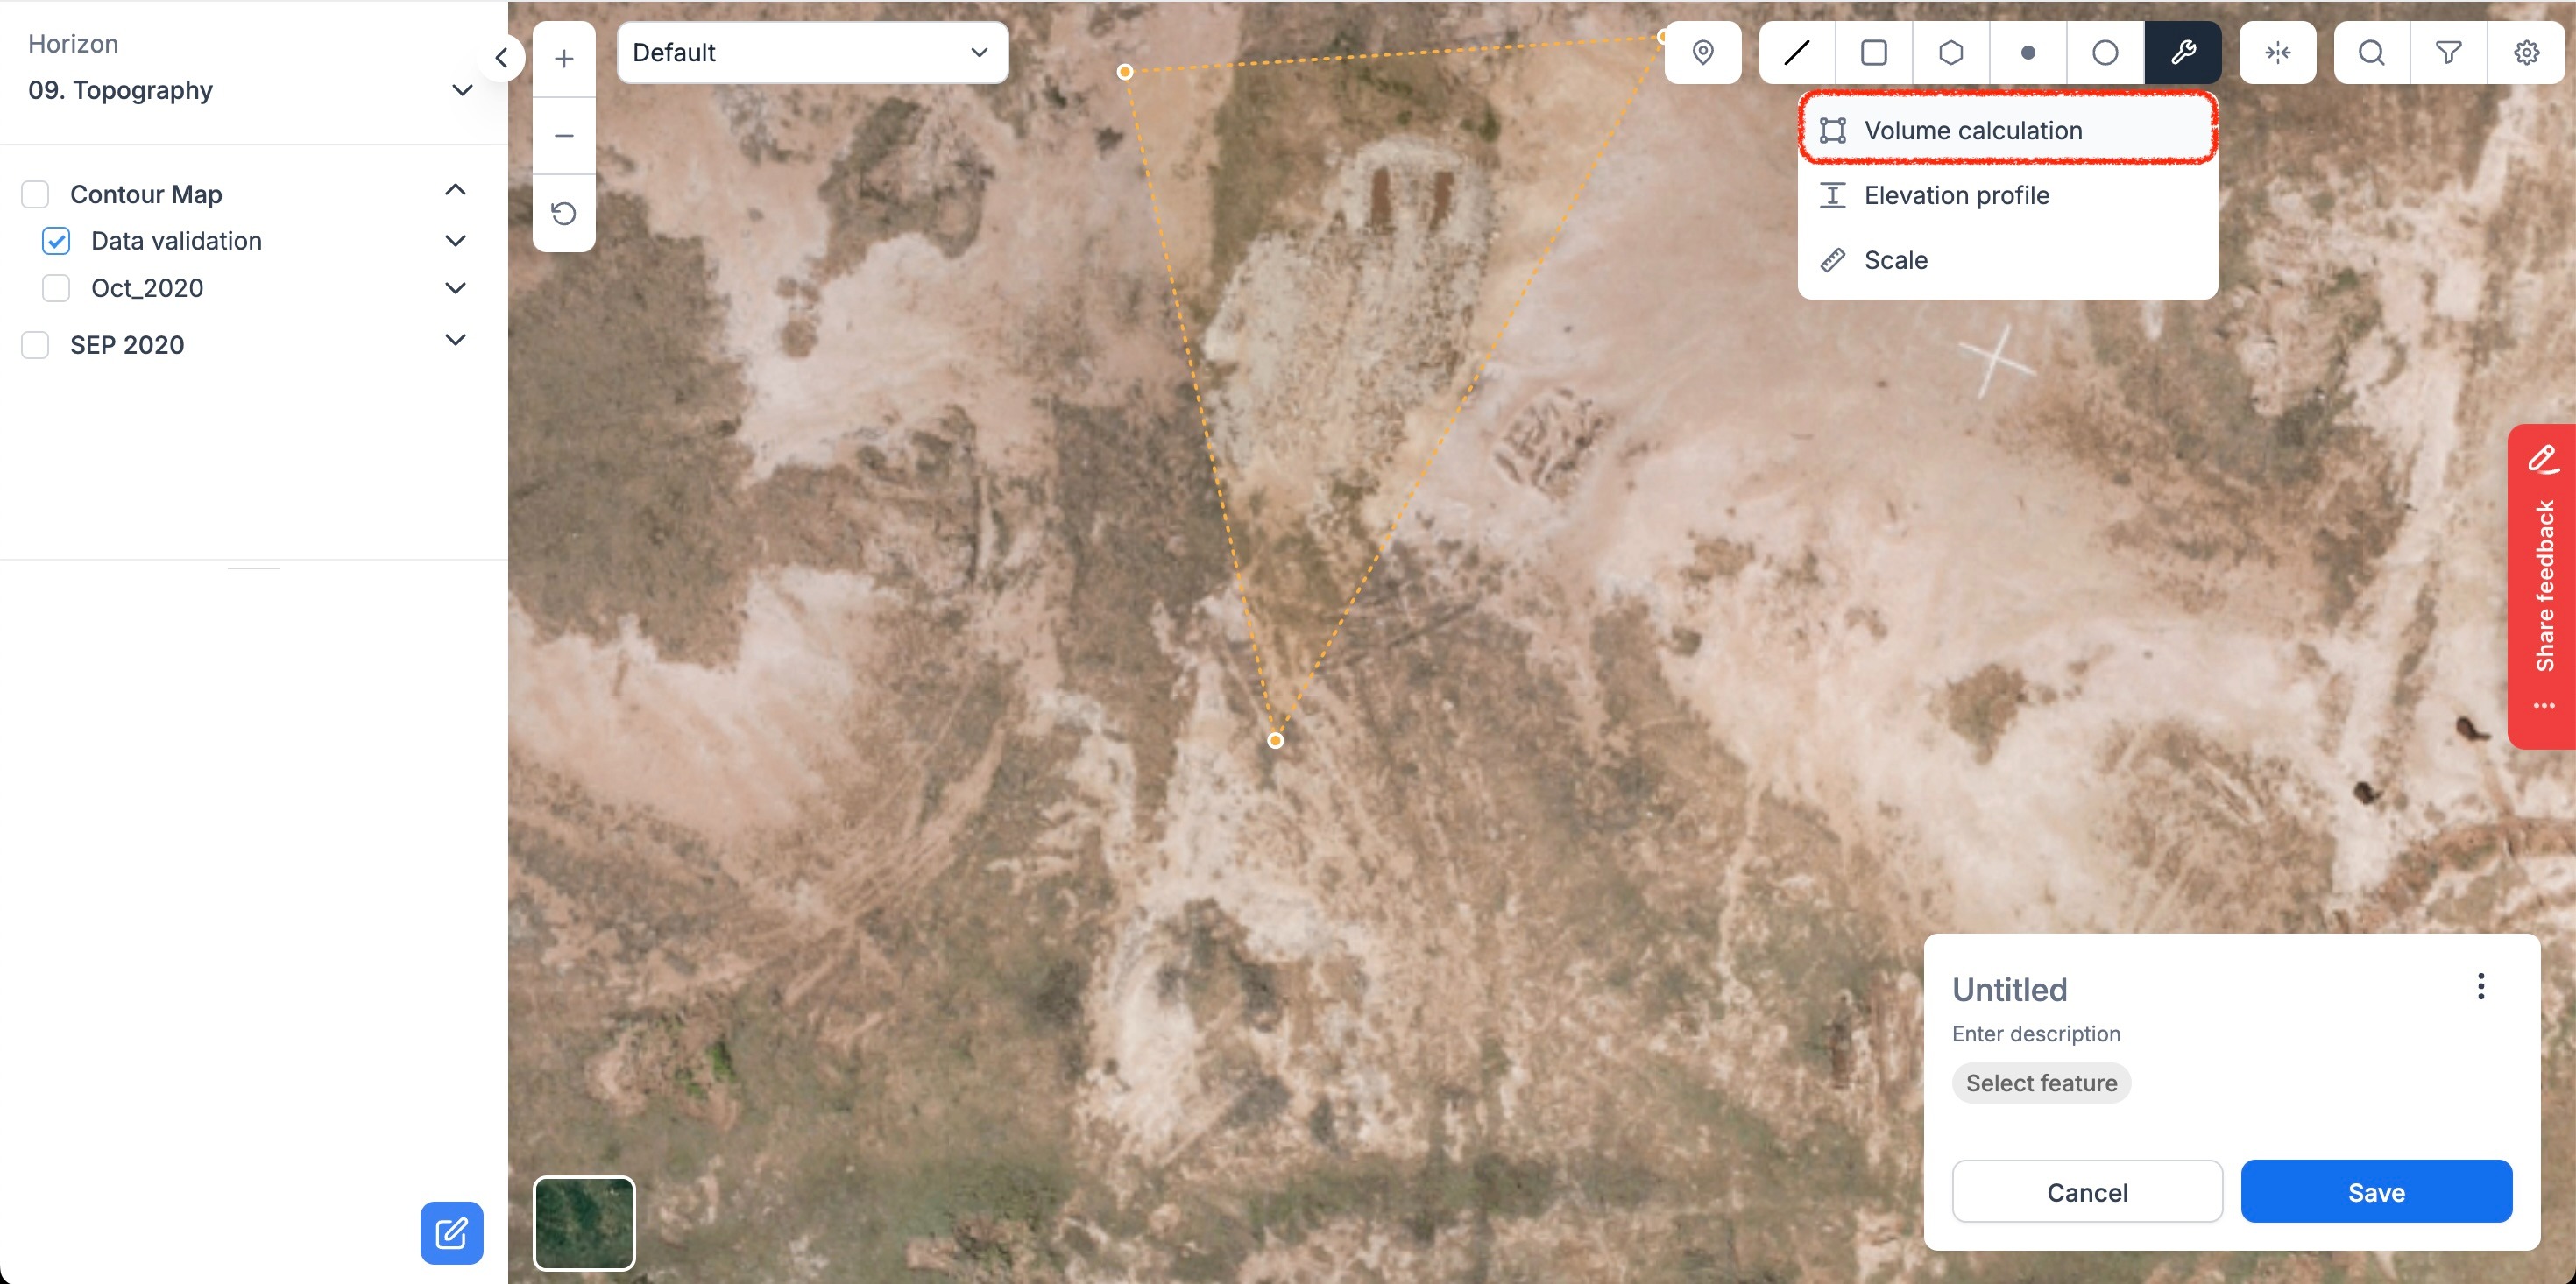
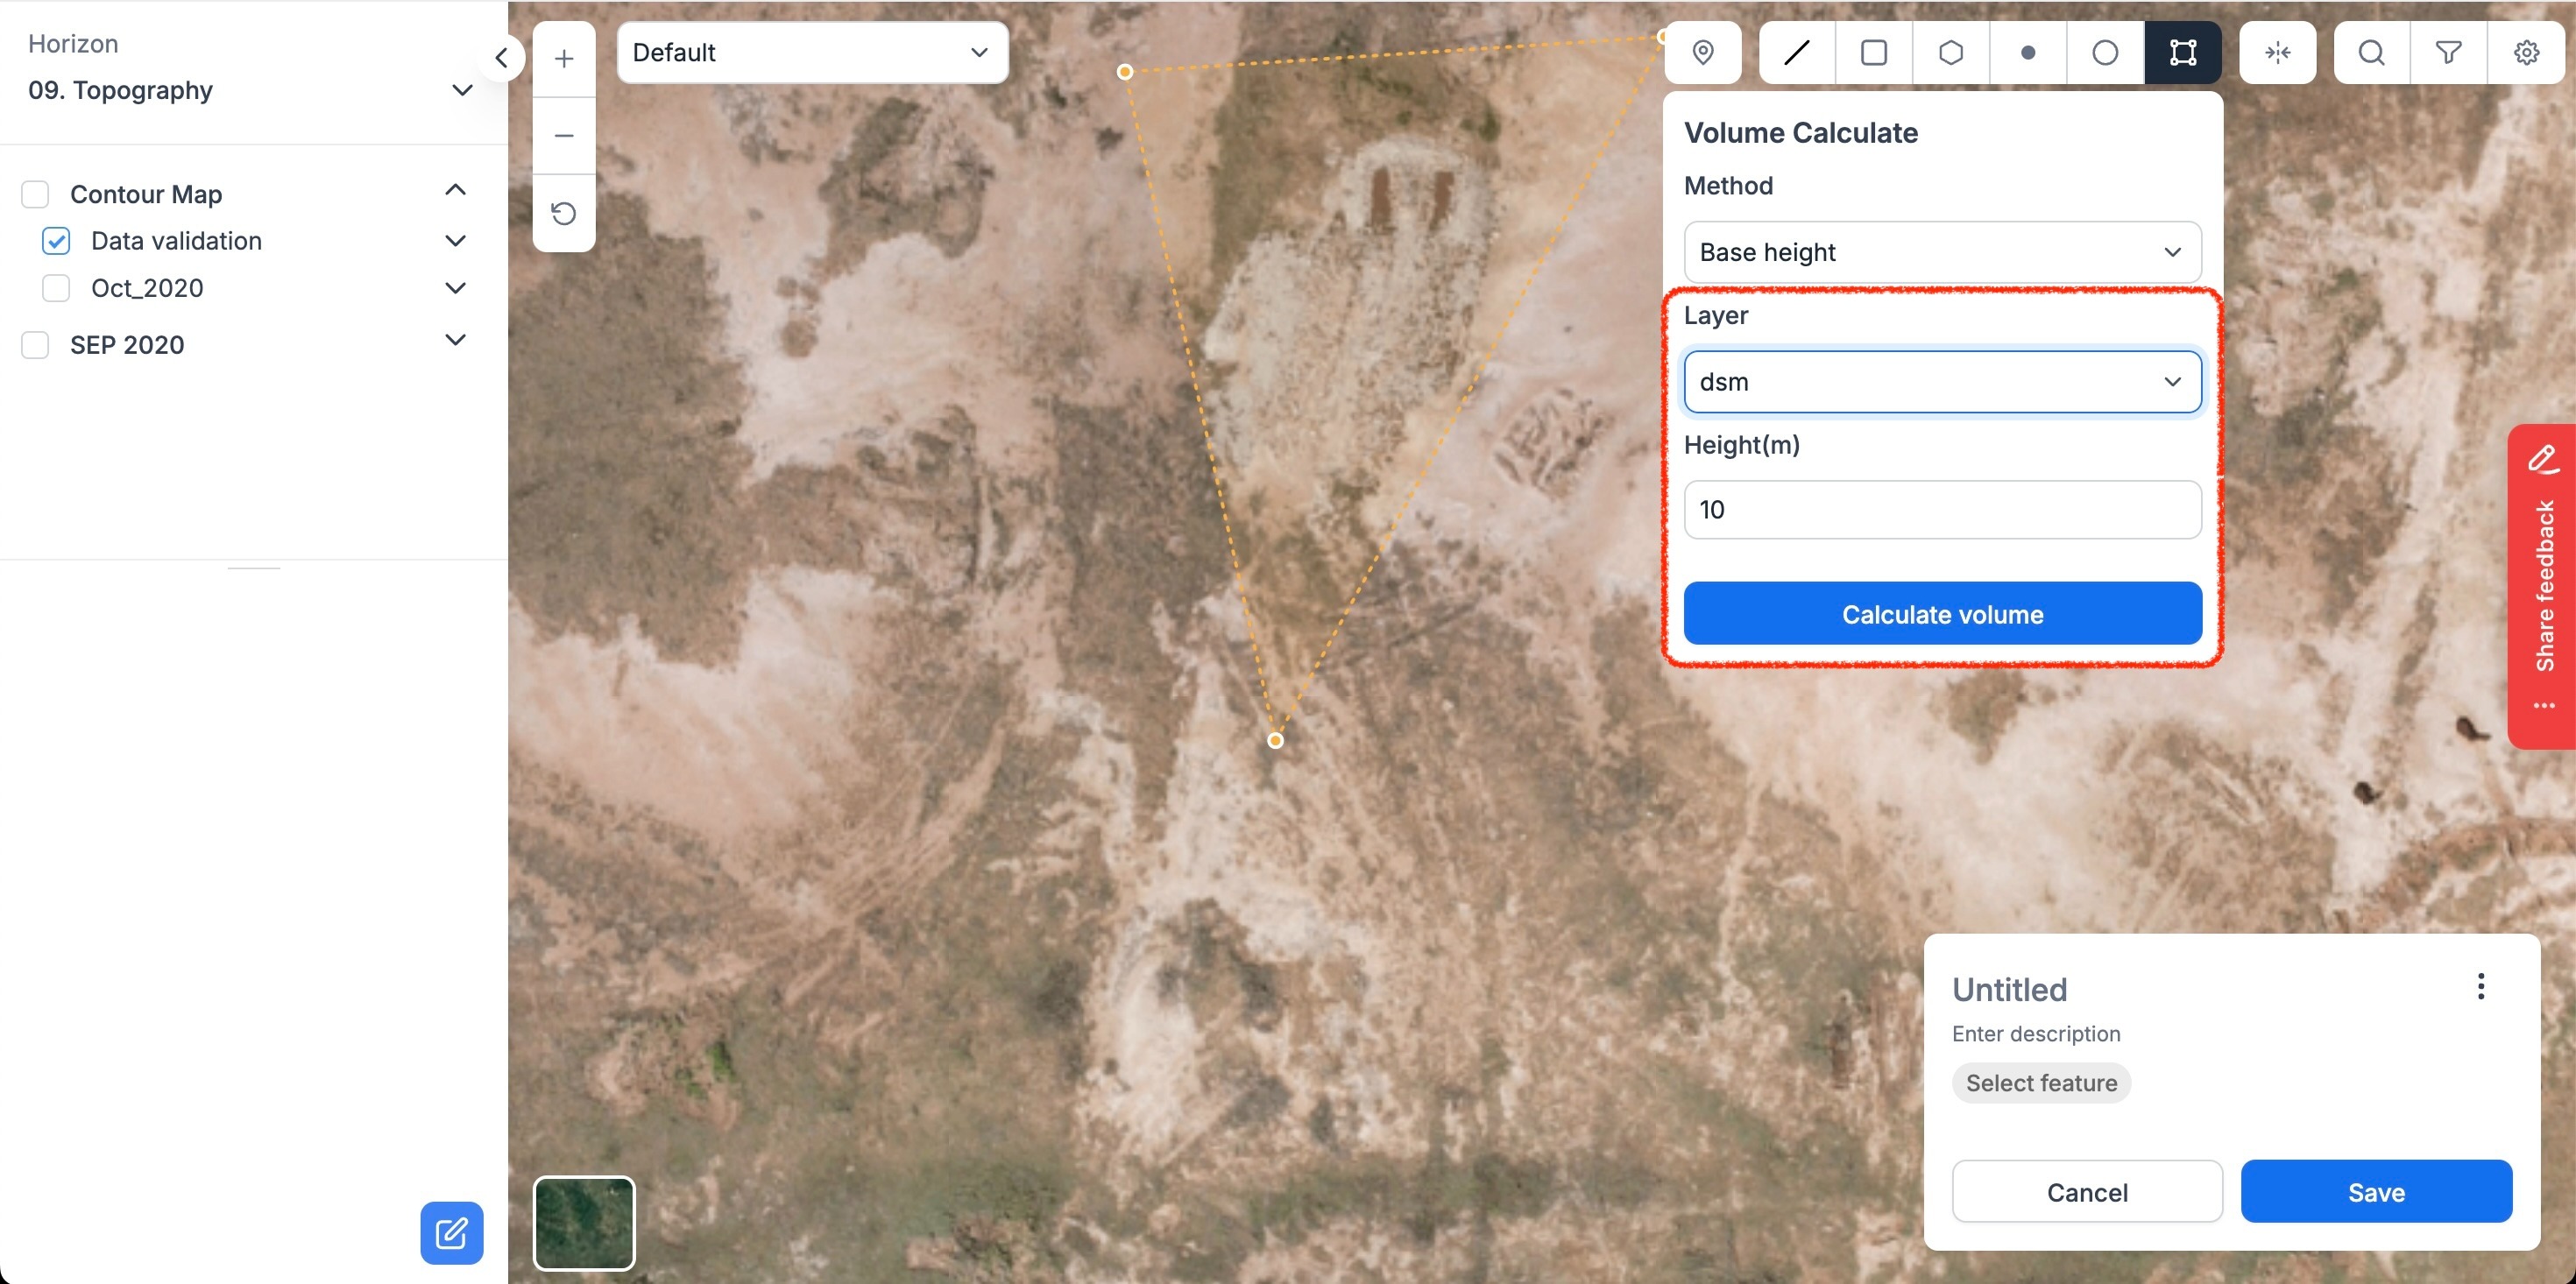
FIGURE 2: STEPS FOR VOLUME CALCULATION
3. Click on 'Calculate Volume' and view the result.
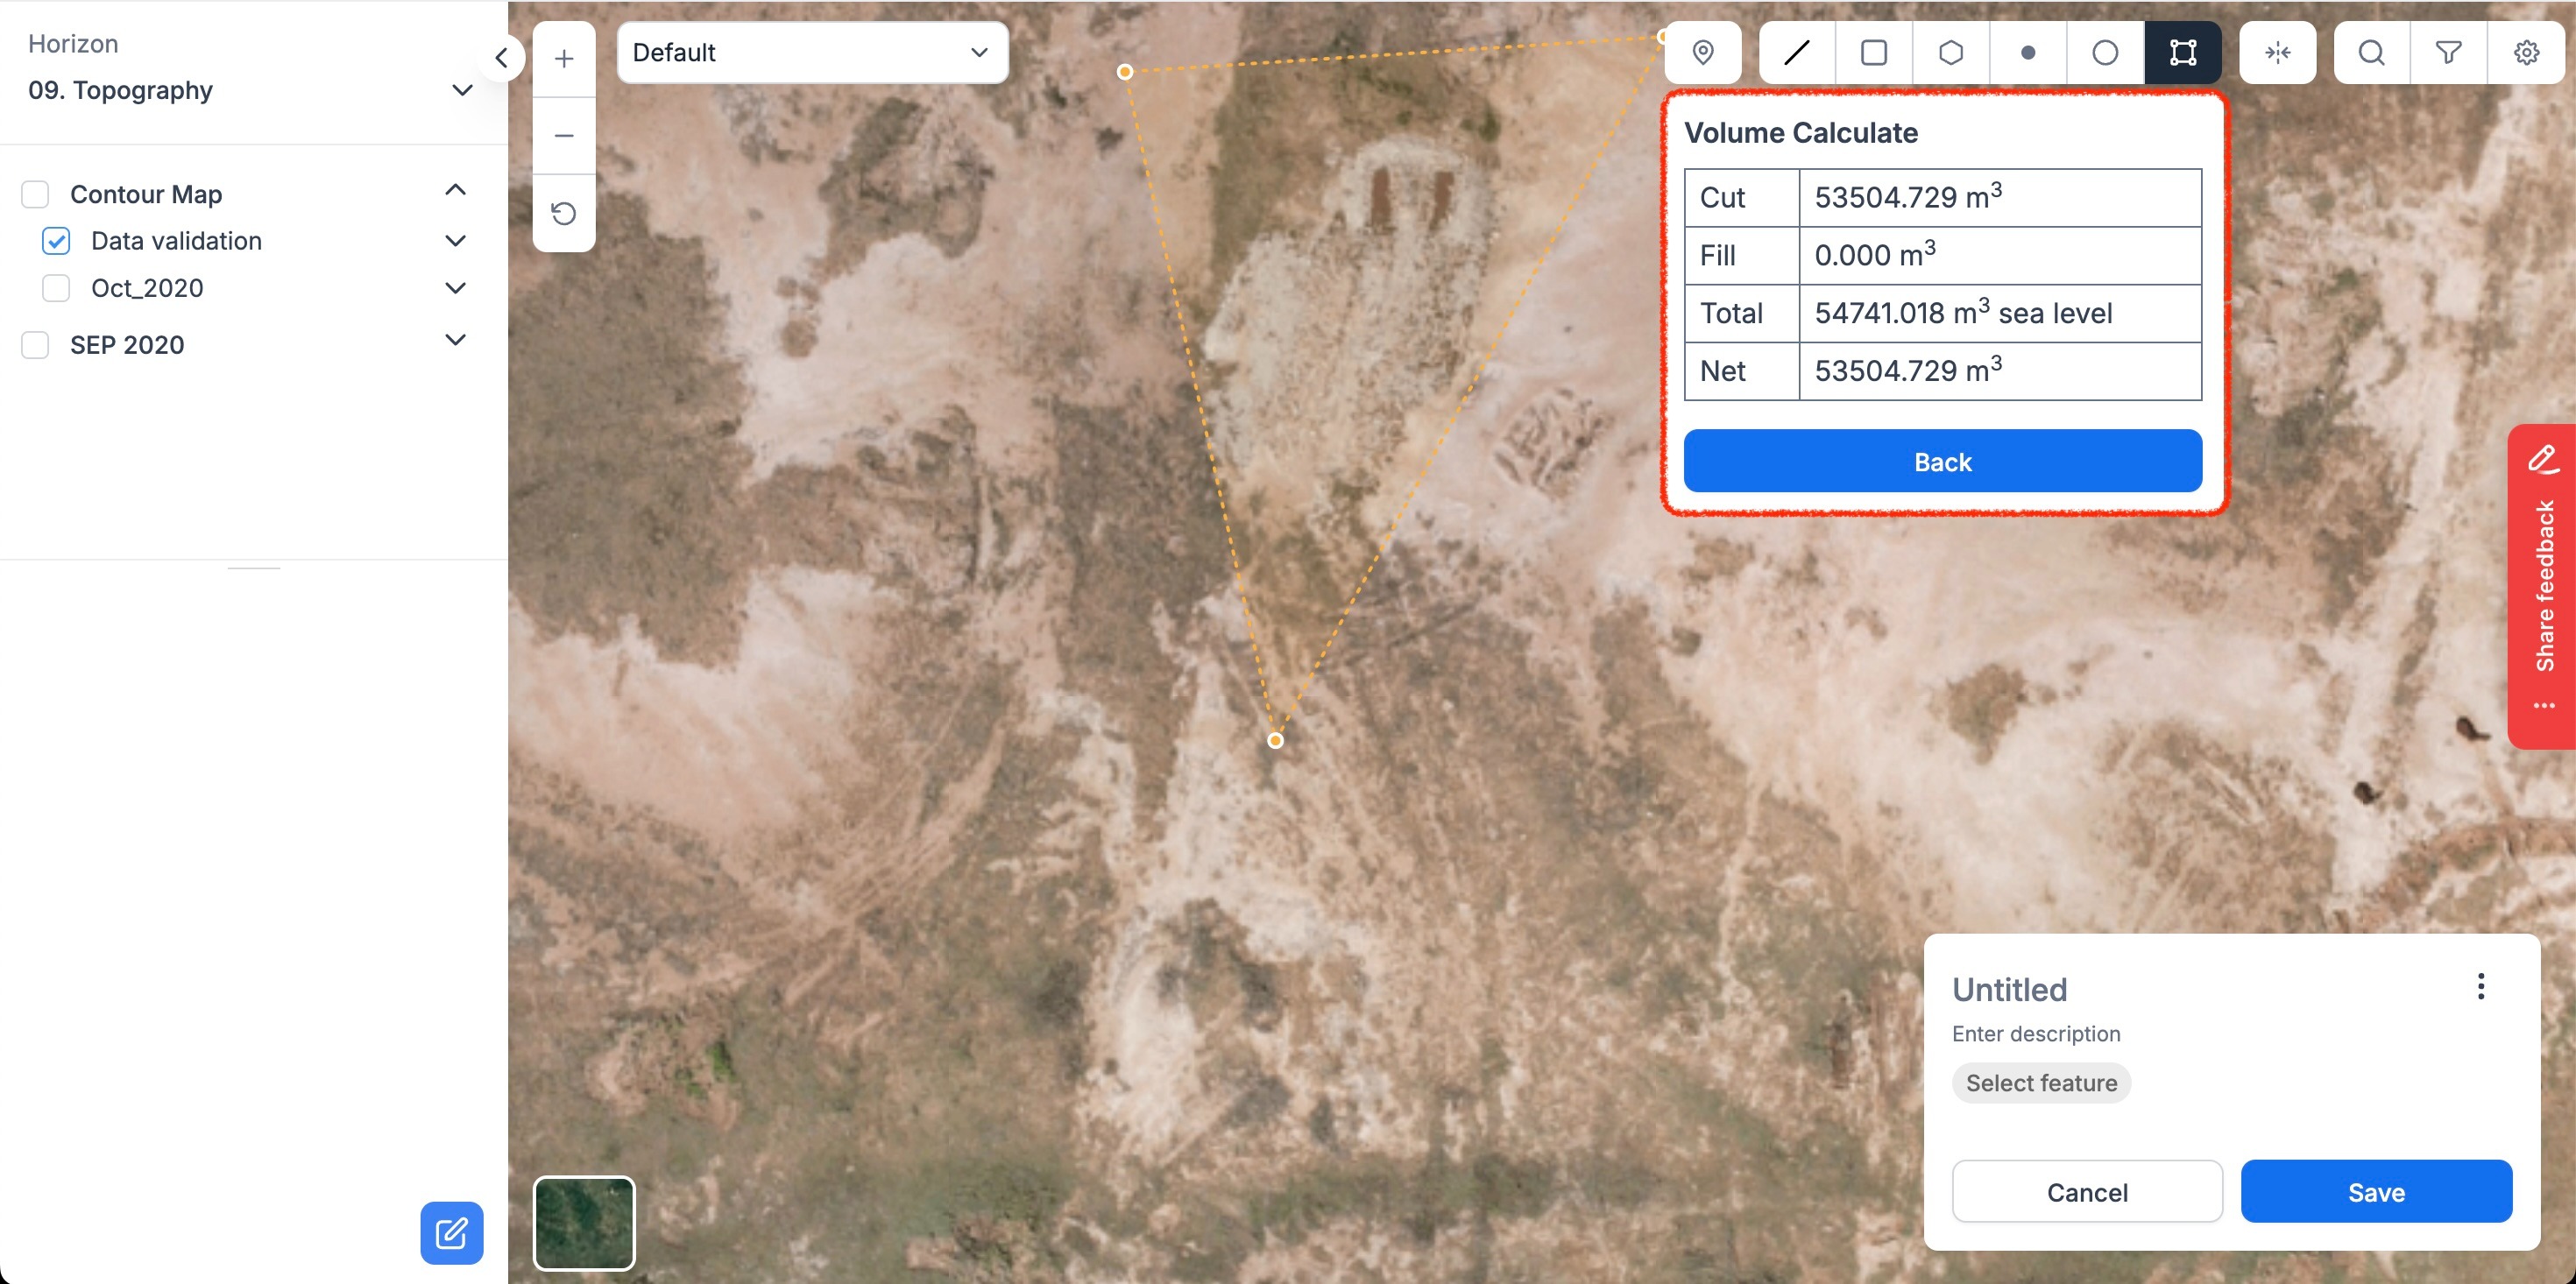
FIGURE 2(a): STEPS FOR VOLUME CALCULATION
How to perform elevation calculations?
Measuring Elevation Profile
An elevation profile is the description of a two-dimensional, cross-sectional landscape view. It provides a side view of a terrain elevation along a line drawn between locations on the map.
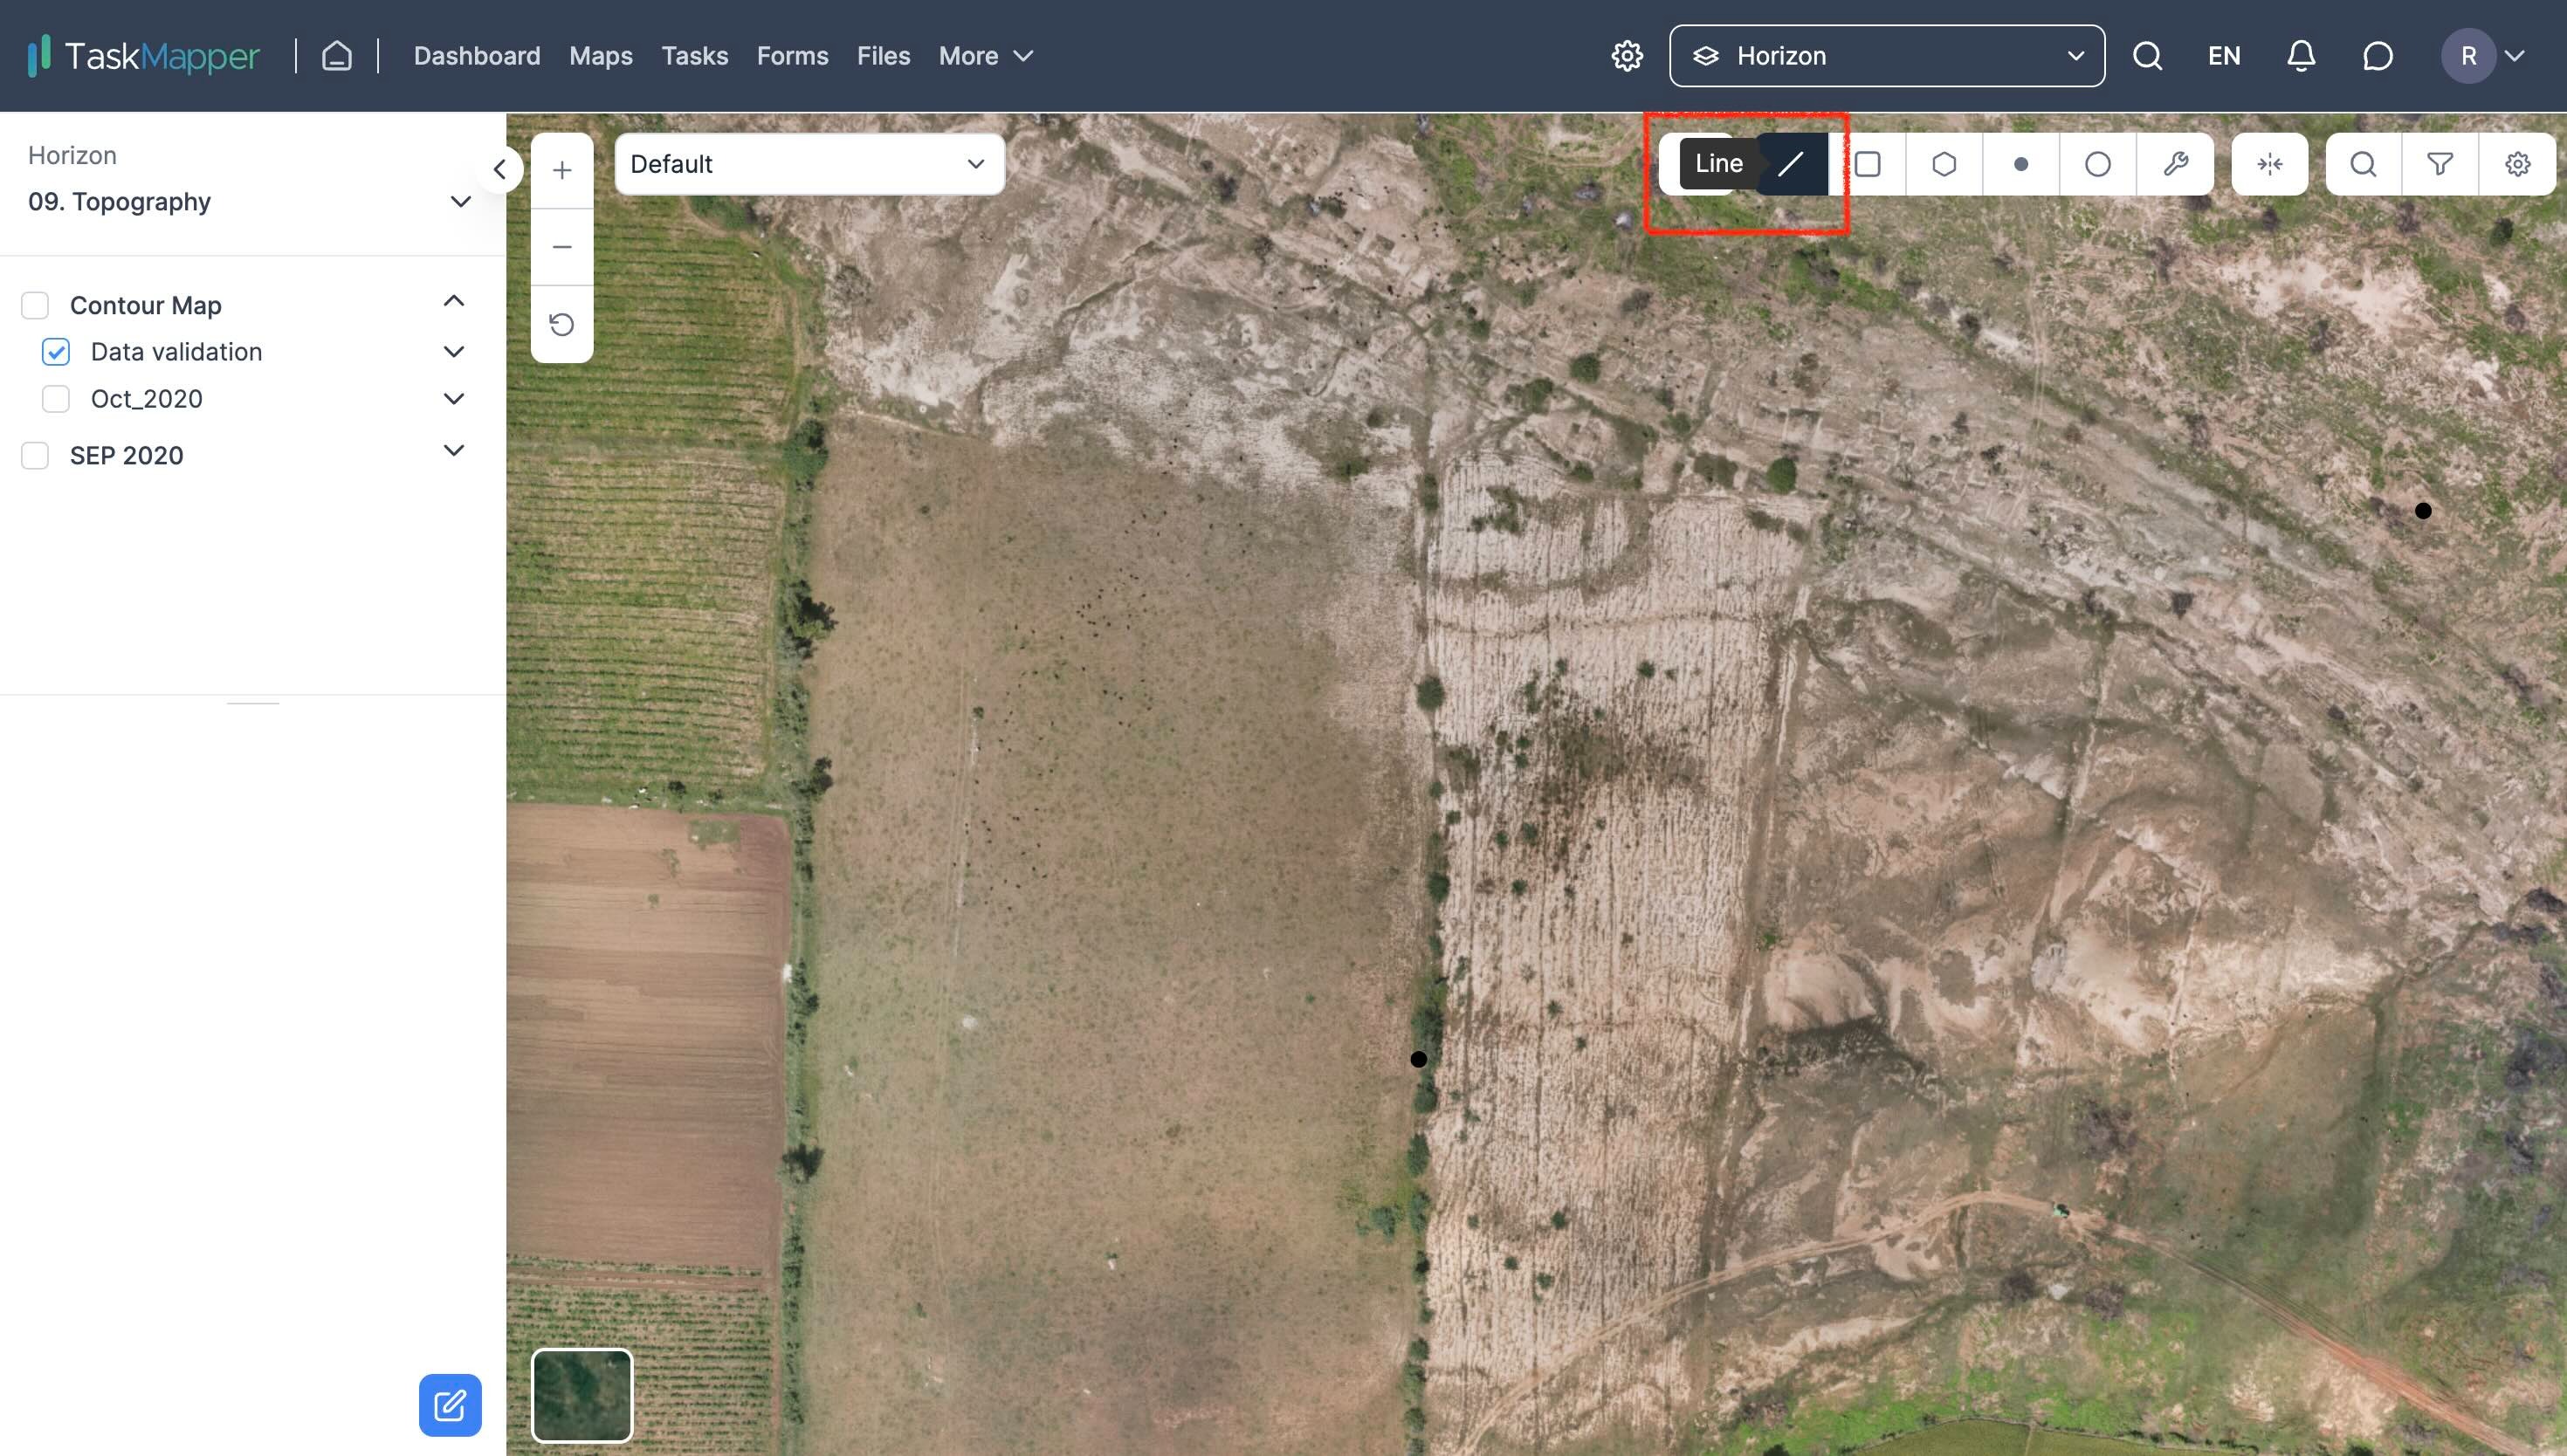
FIGURE 3: LINE STRING TOOL
2. Click on the line drawn and select 'Elevation Profile' from the toolbox.
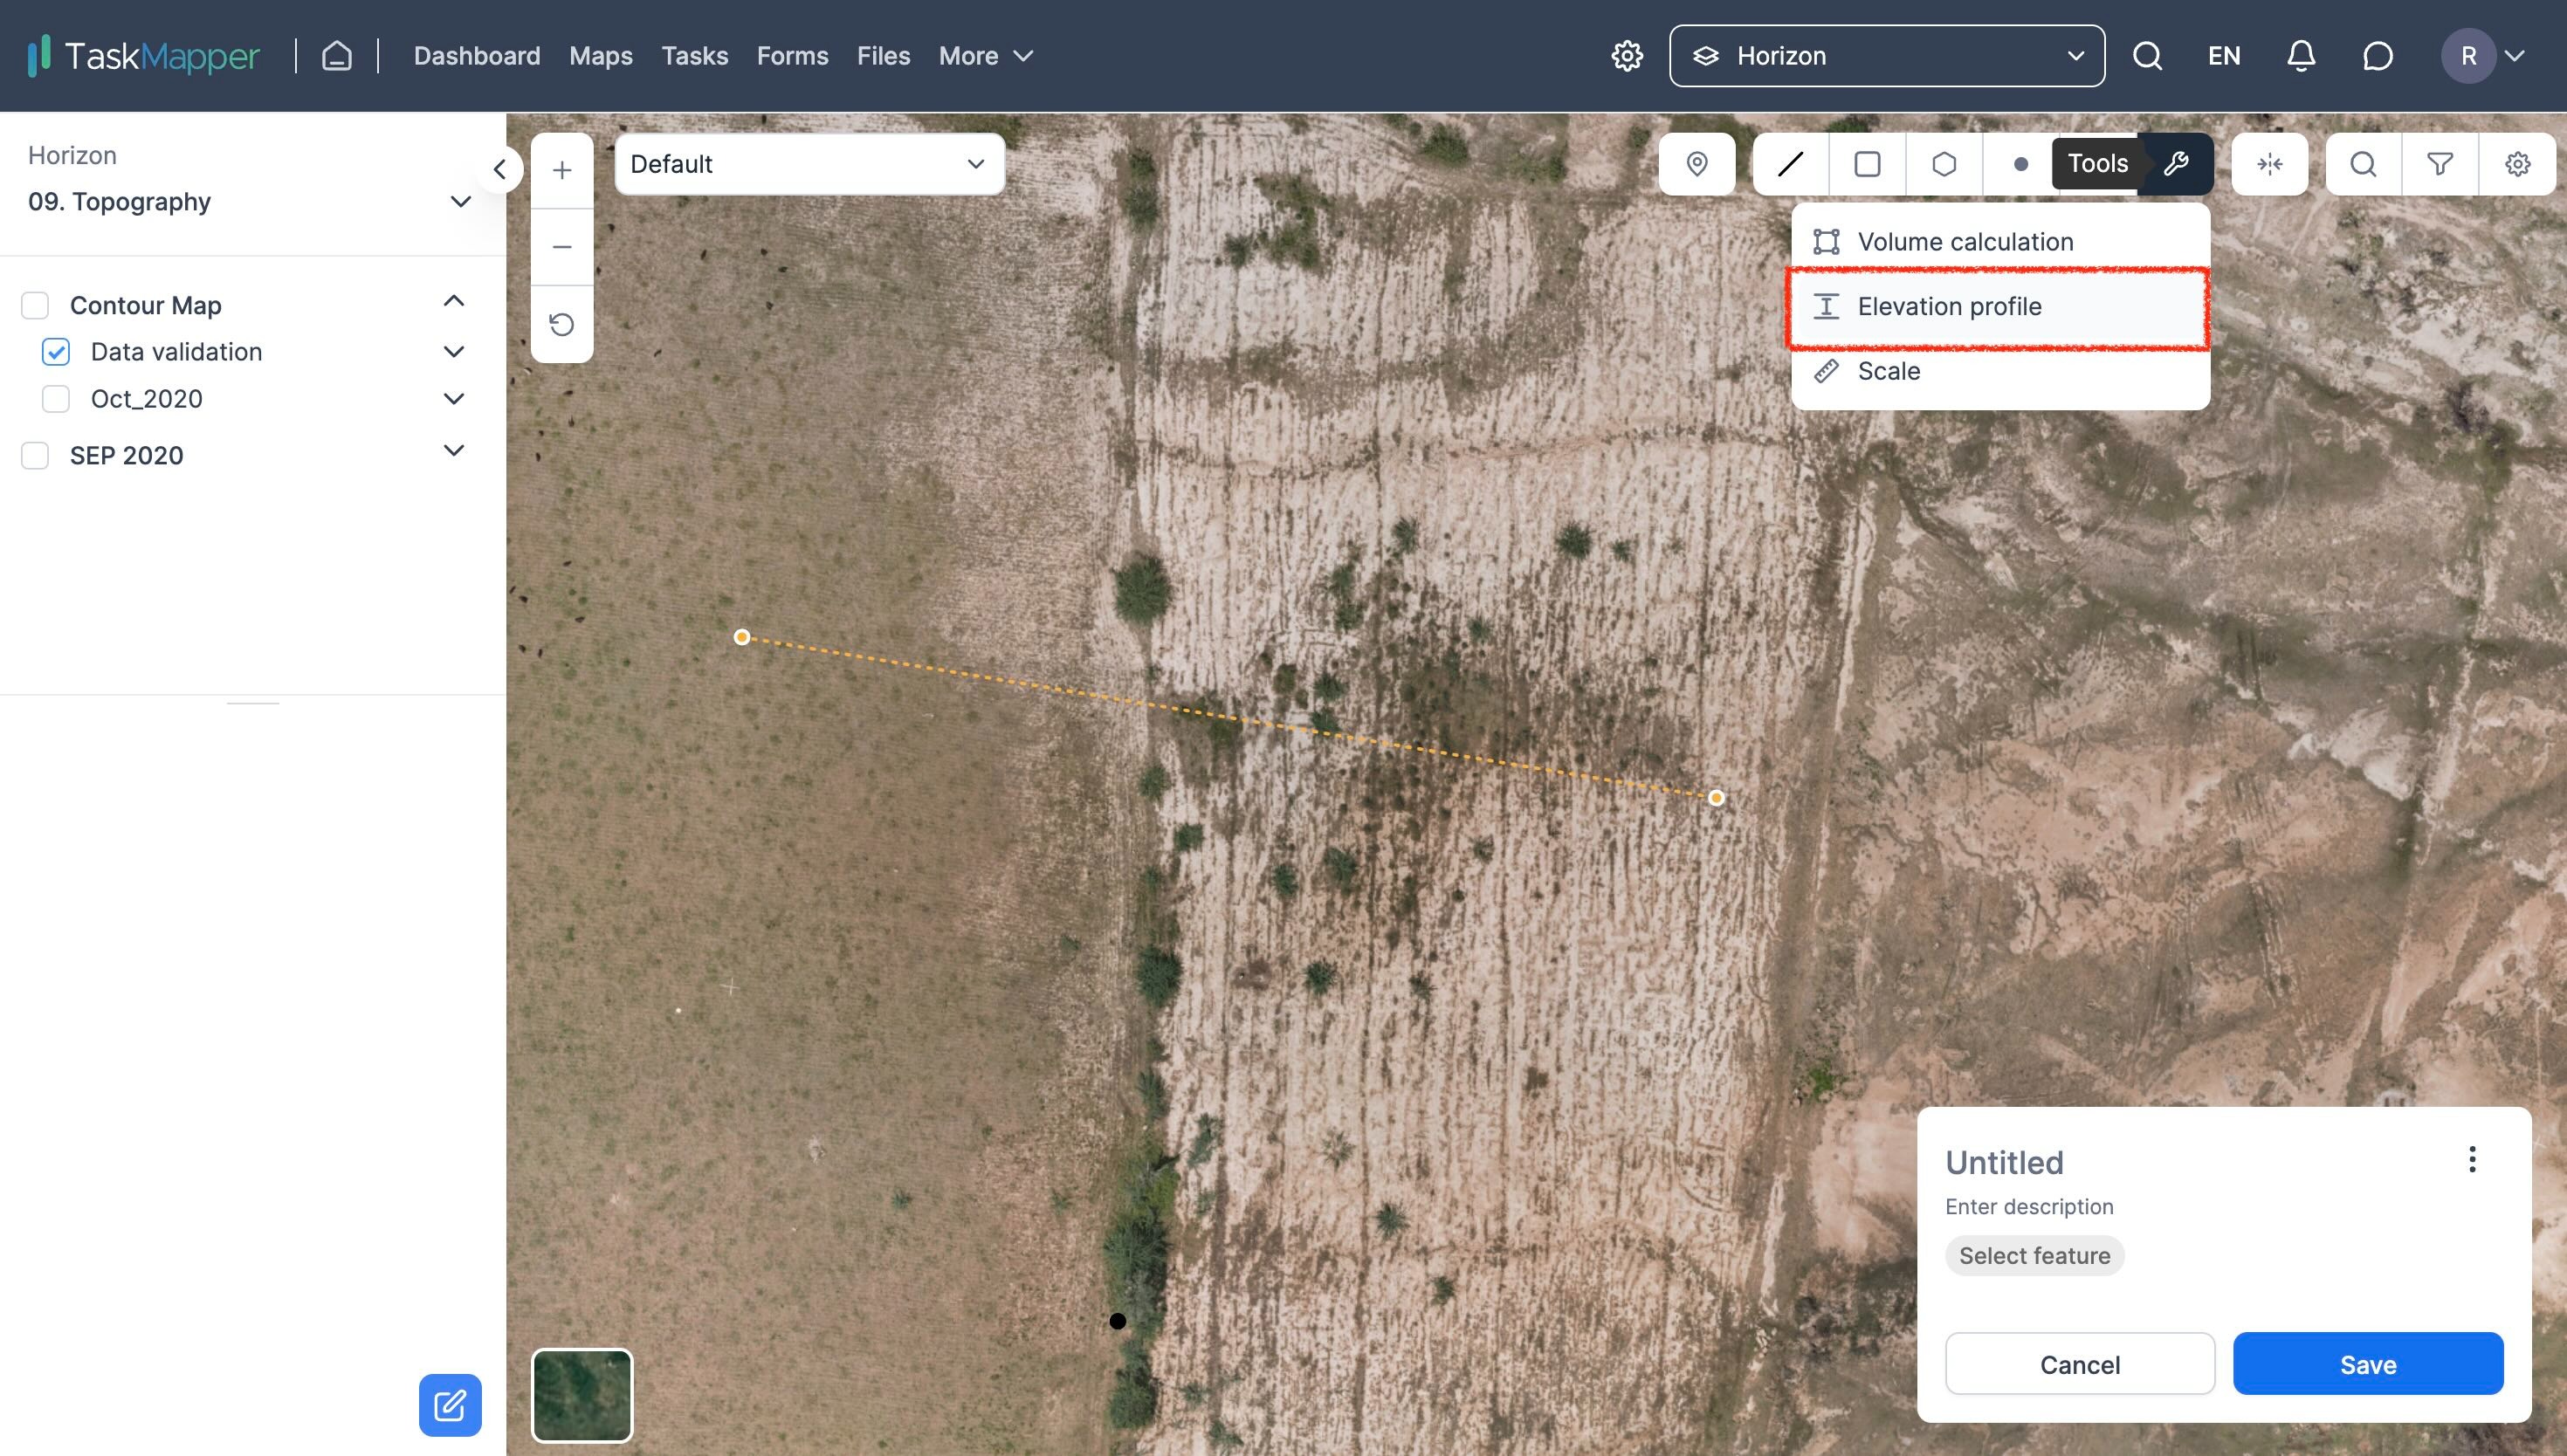
FIGURE 4: ELEVATION PROFILE
3. In the elevation profile dialogue box, set the parameters. Choose the method as 'Line' and the interval as '1m' or lower. Set the layer as 'DSM' and click on 'Calculate Elevation'.
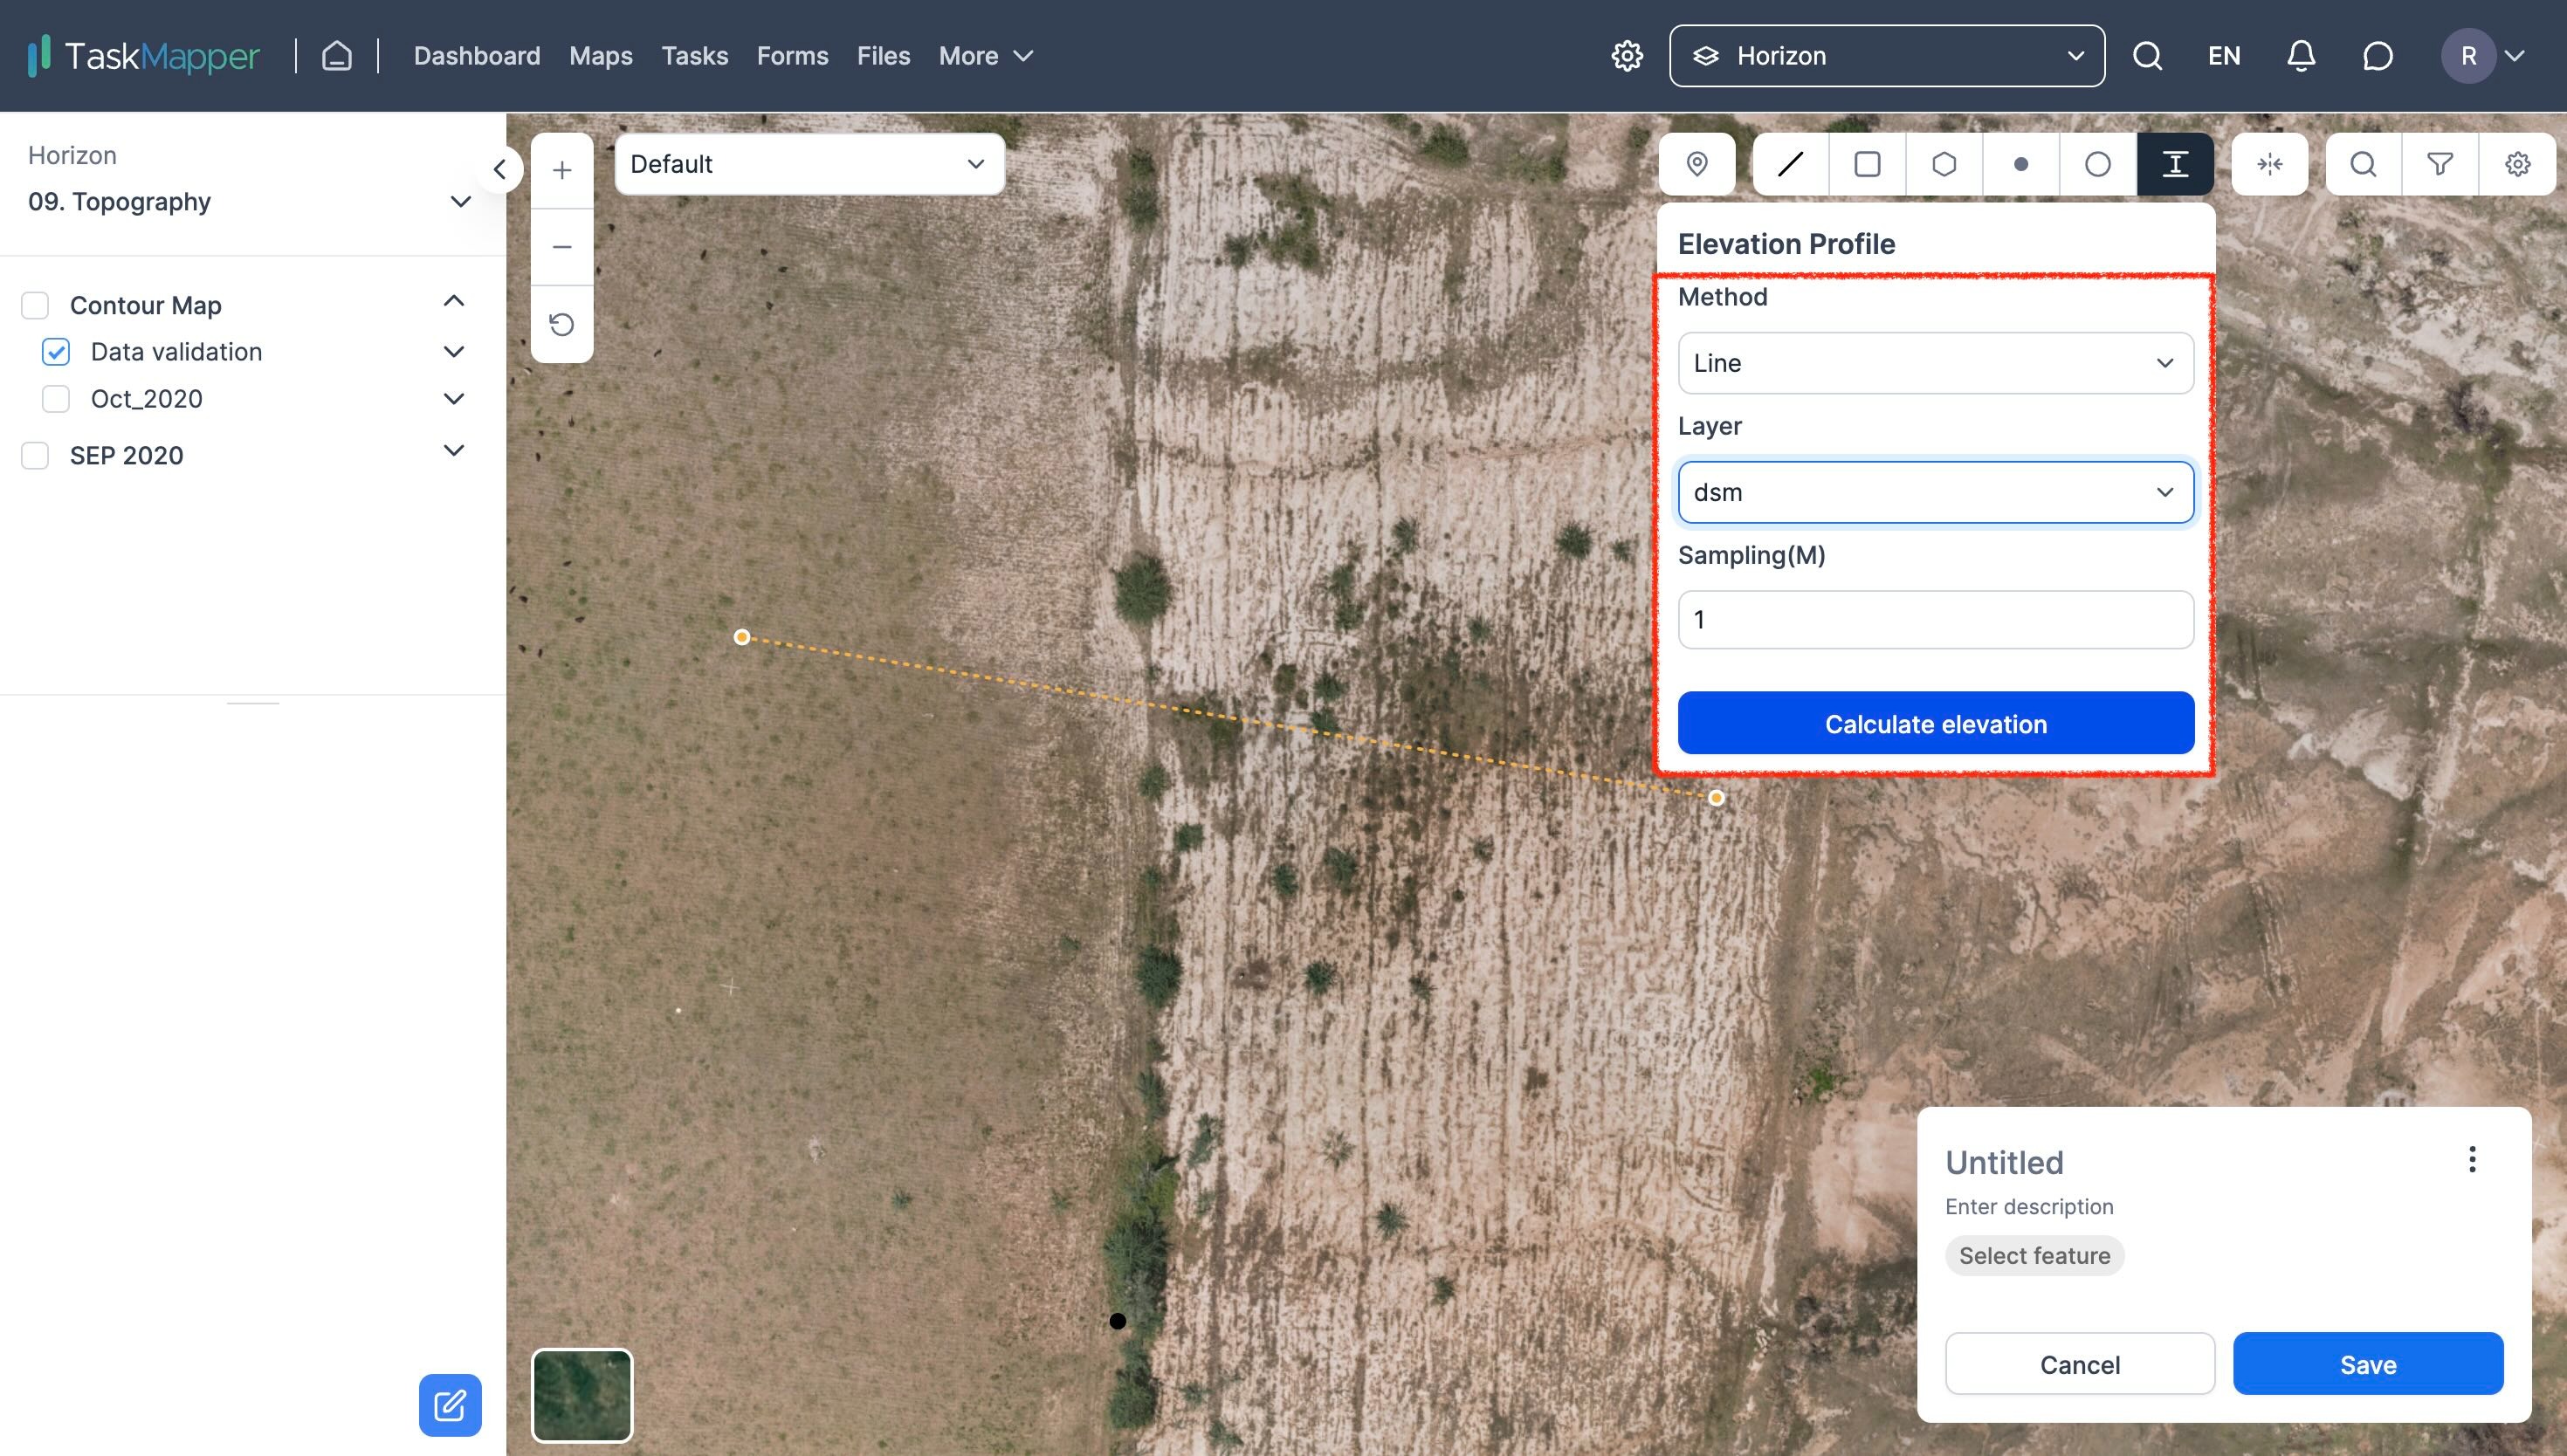
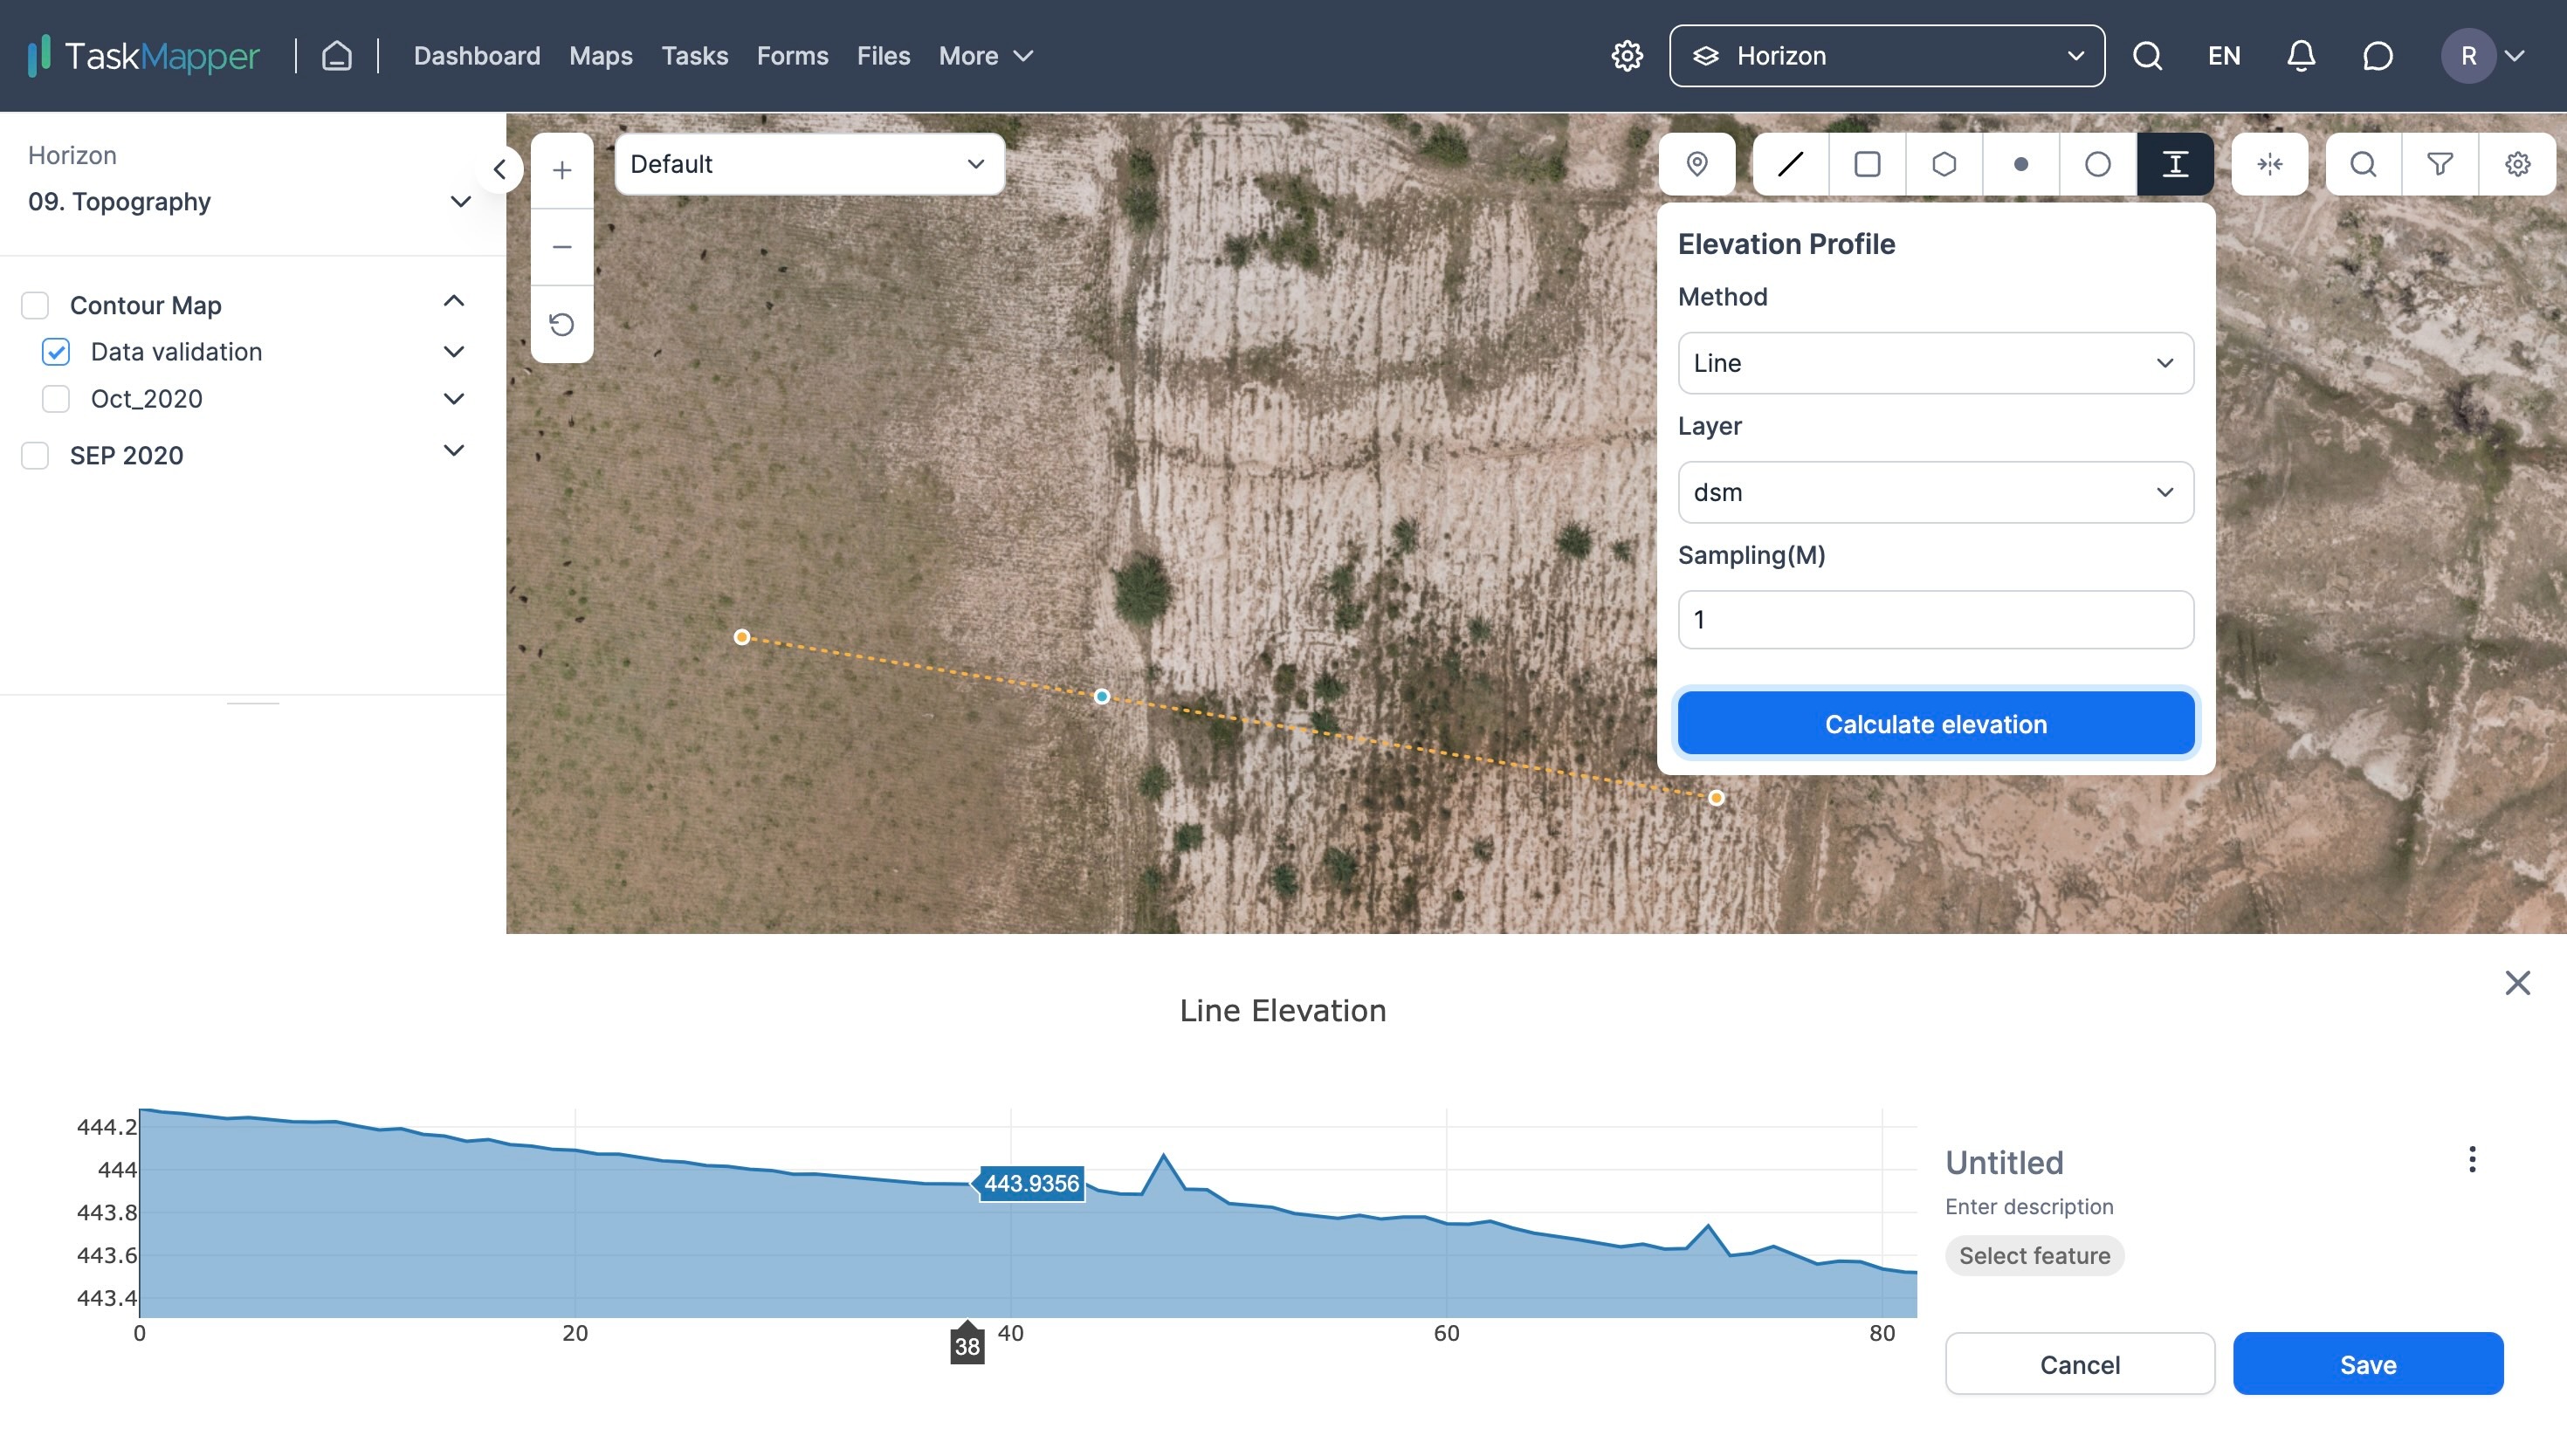
FIGURE 5: STEPS TO MEASURE ELEVATION PROFILE
Measuring Spot Elevation
Spot elevation, or a point on a map or chart, indicates points higher than their surroundings. Spot elevation displays the actual elevation of a selected point and the top and/or bottom elevation of elements with a thickness.
1. To check spot elevation, select the marker tool from the toolbox and place it on the desired point on the map. Then select 'Elevation Profile' from the toolbox.
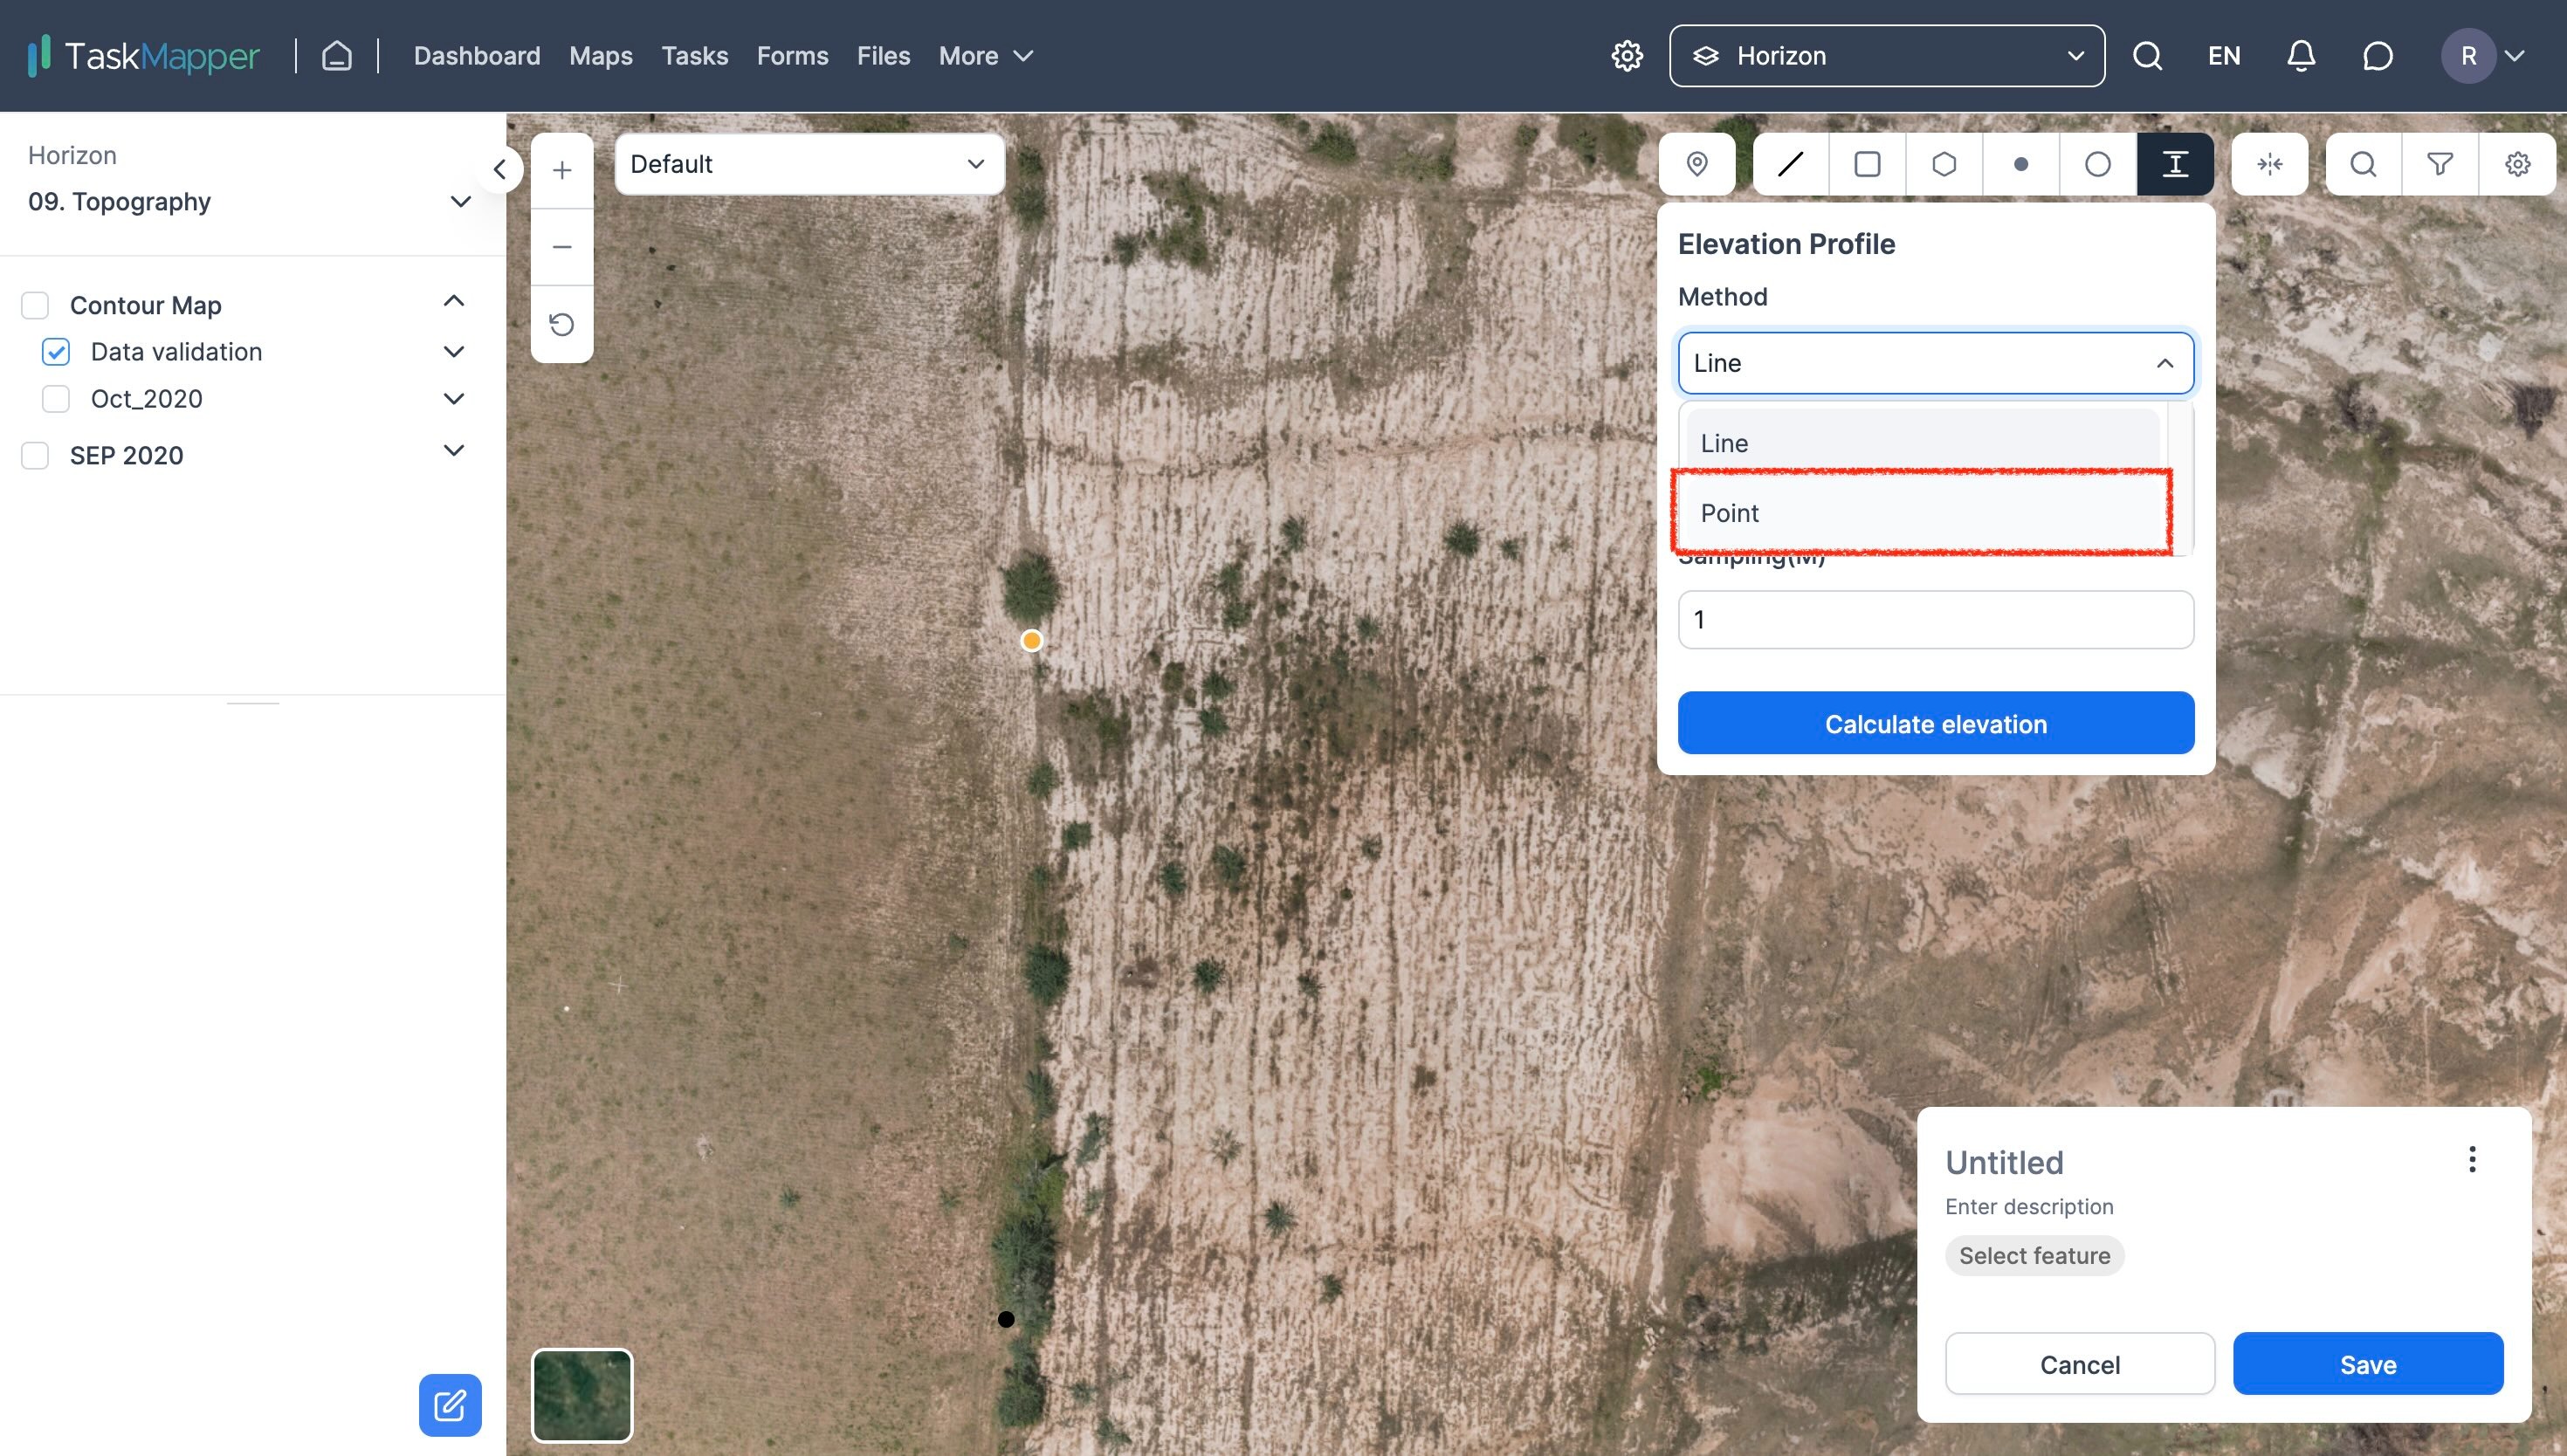
FIGURE 6: SPOT ELEVATION MARKER
2. In the Elevation Profile dialogue box, select the method parameter as 'Point' and layer as 'DSM'.
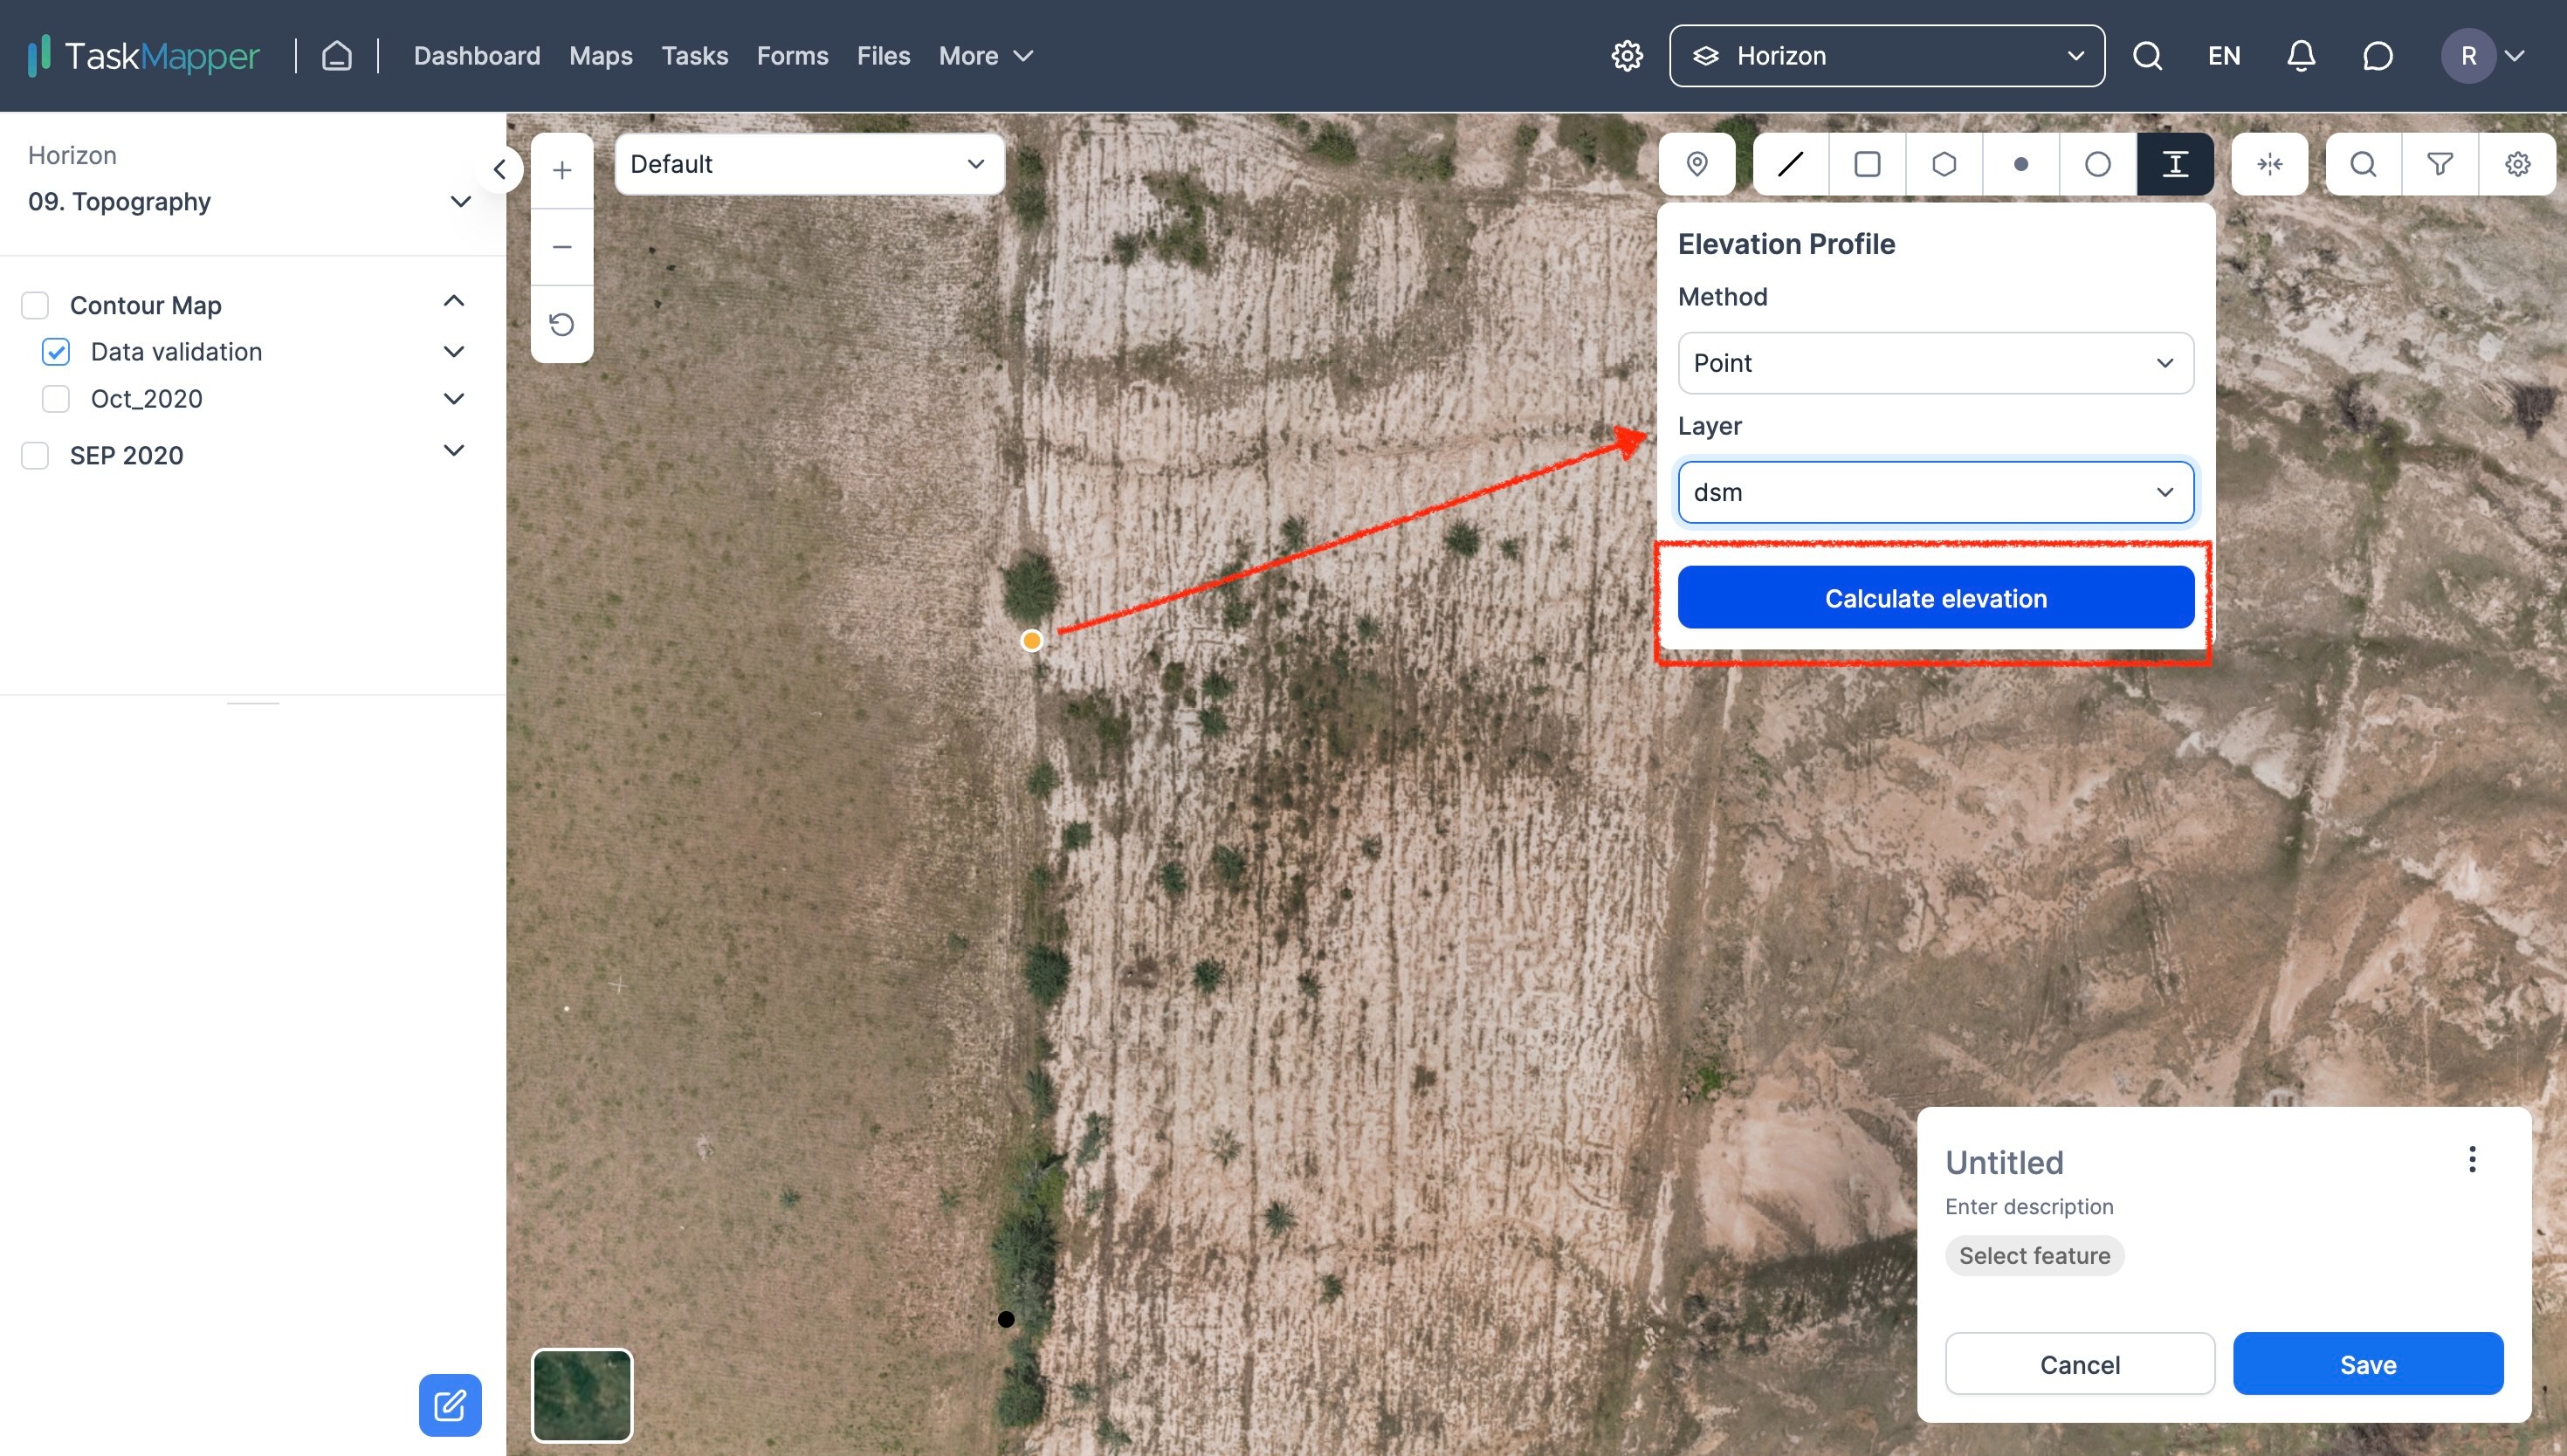
FIGURE 7: ELEVATION PROFILE
3. Click 'Calculate Elevation' to get the spot elevation results.
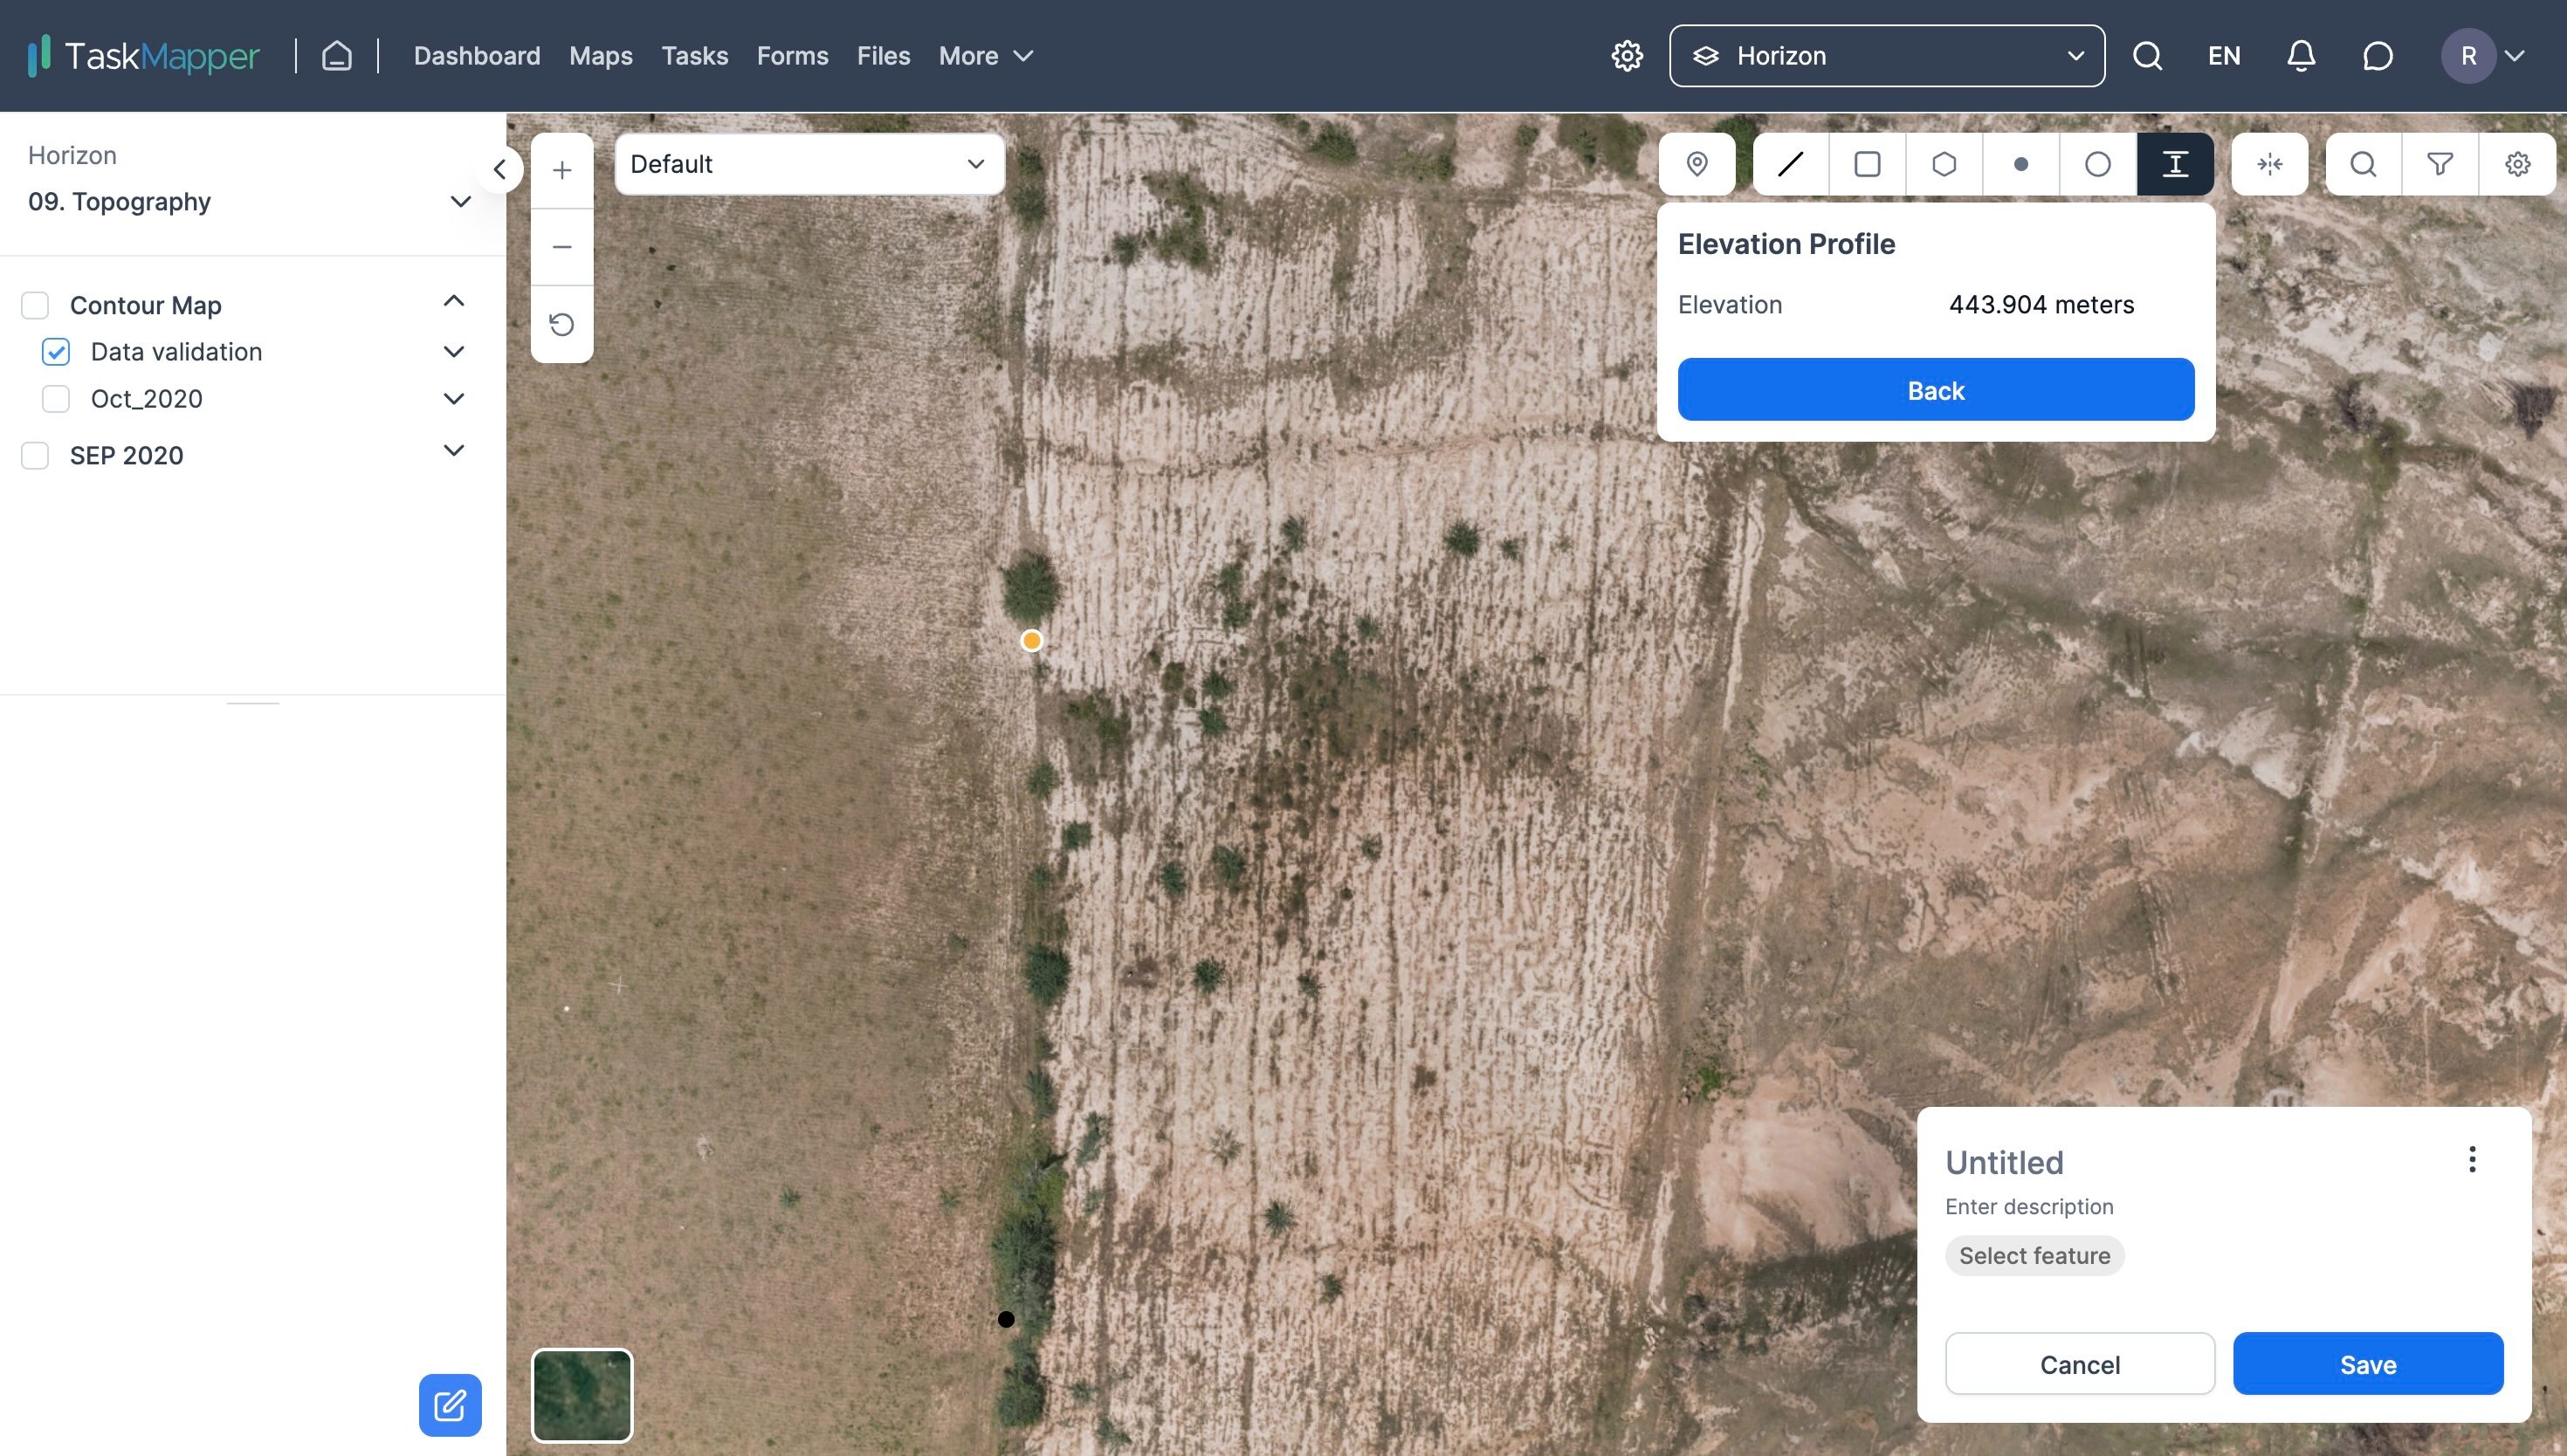
FIGURE 8: STEPS TO MEASURE SPOT ELEVATION
How to add tasks or forms to the map?
You can add a task or form to an individual component on the map or select multiple components and add them in bulk. Below are the steps to add a task on the map or associate it with a component on the map
1) Click on the GPS icon on select the options to create a task or a form
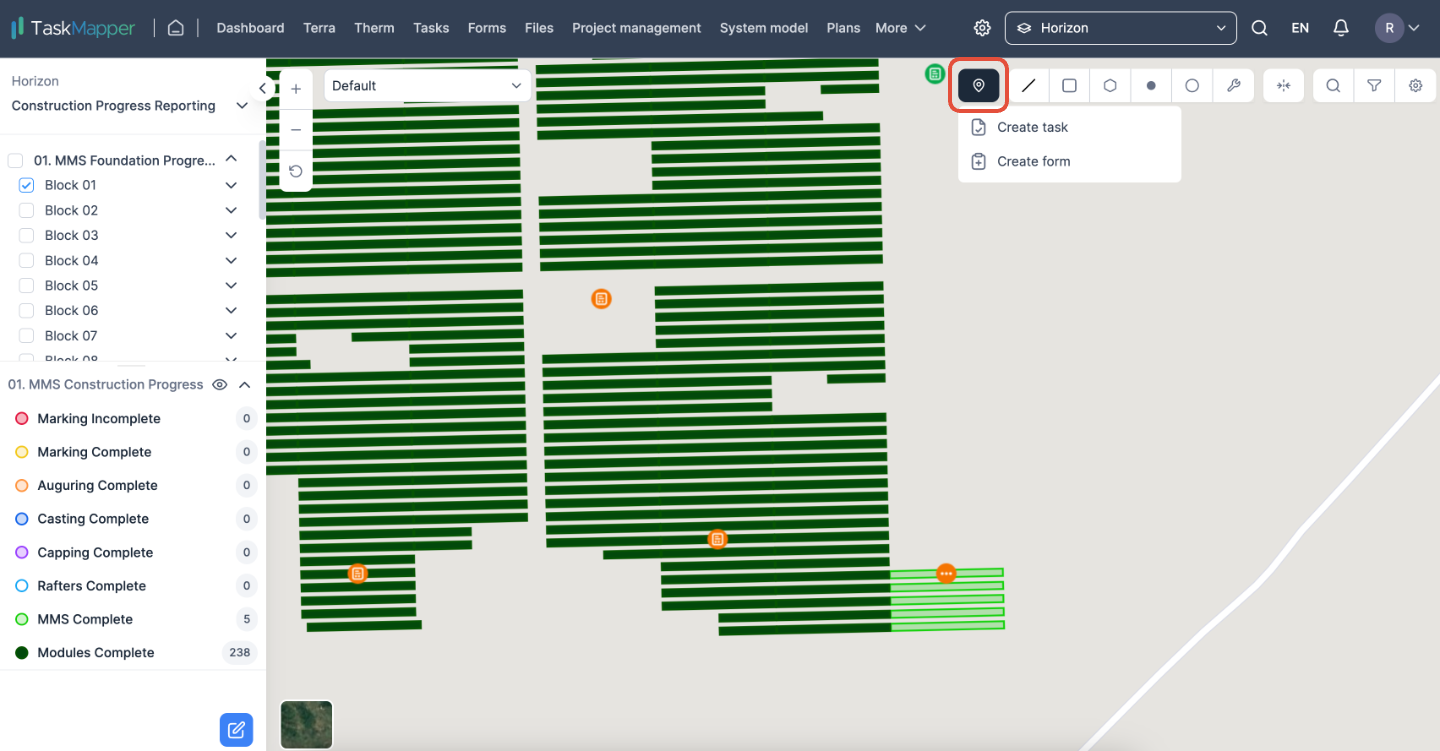
FIGURE 9: CREATE TASK/FROM
2) Click anywhere on the map or click on the component on the map to confirm the task's location. Click on confirm to add the task.
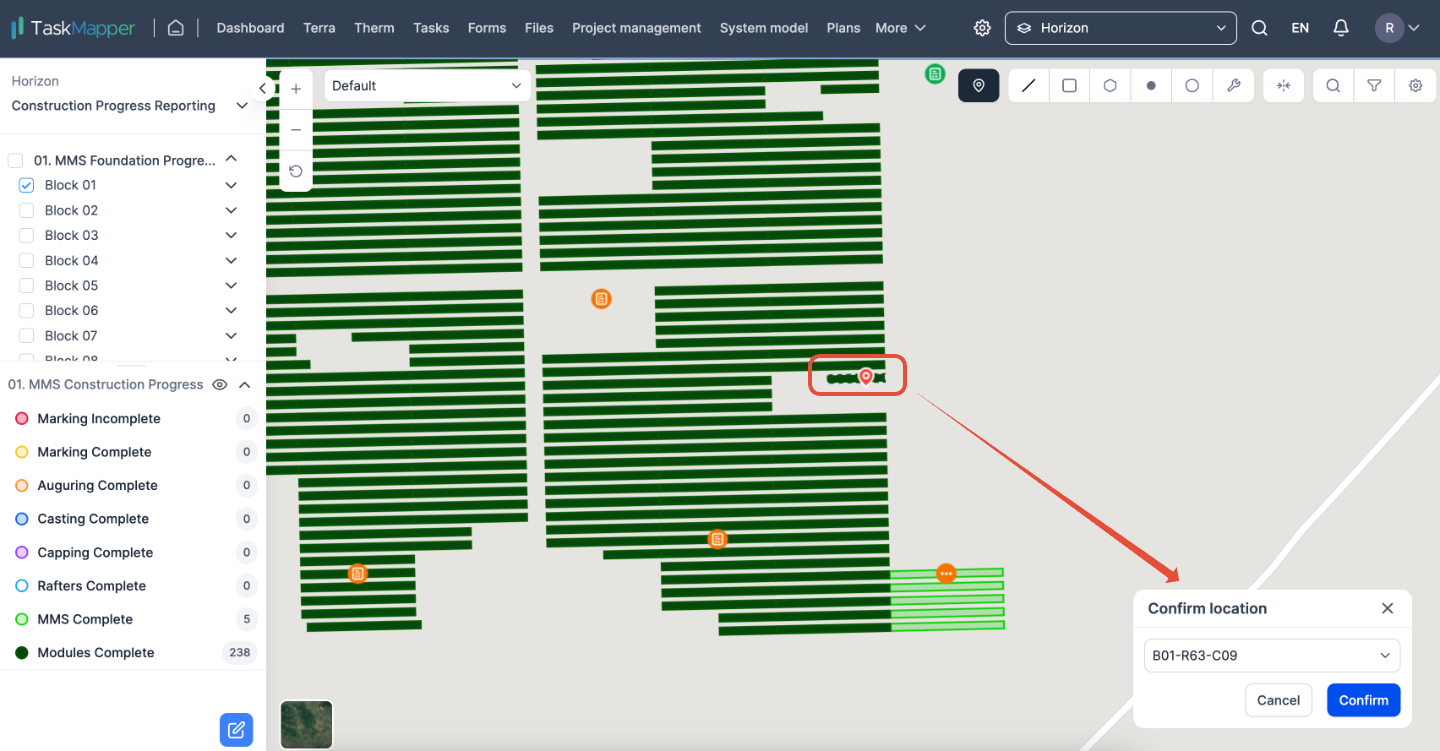
FIGURE 10: LOCATION CONFIRMATION FOR TASK/FORM
3) If you want to add a task to multiple components on the map or associate a task with several components simultaneously, hold down the shift key on your keyboard and select the desired components using your mouse or trackpad.
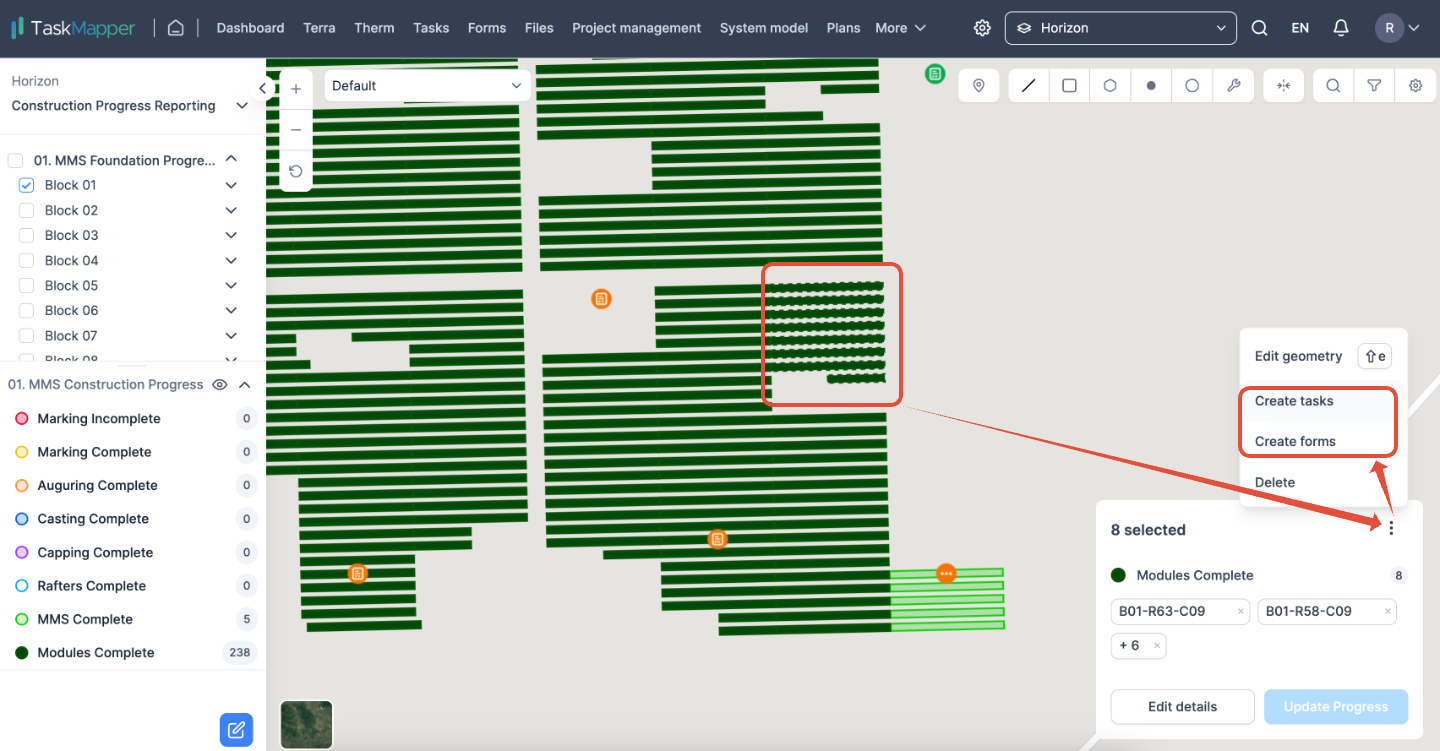
FIGURE 11: BULK ADDITION OF TASK/FORM
How to enable or disable zooming into the new map when switching between maps (toggle fly)?
In the map view, click on the gear icon and click on the option ' Fly to map' to enable or disable the zooming when switching between maps.
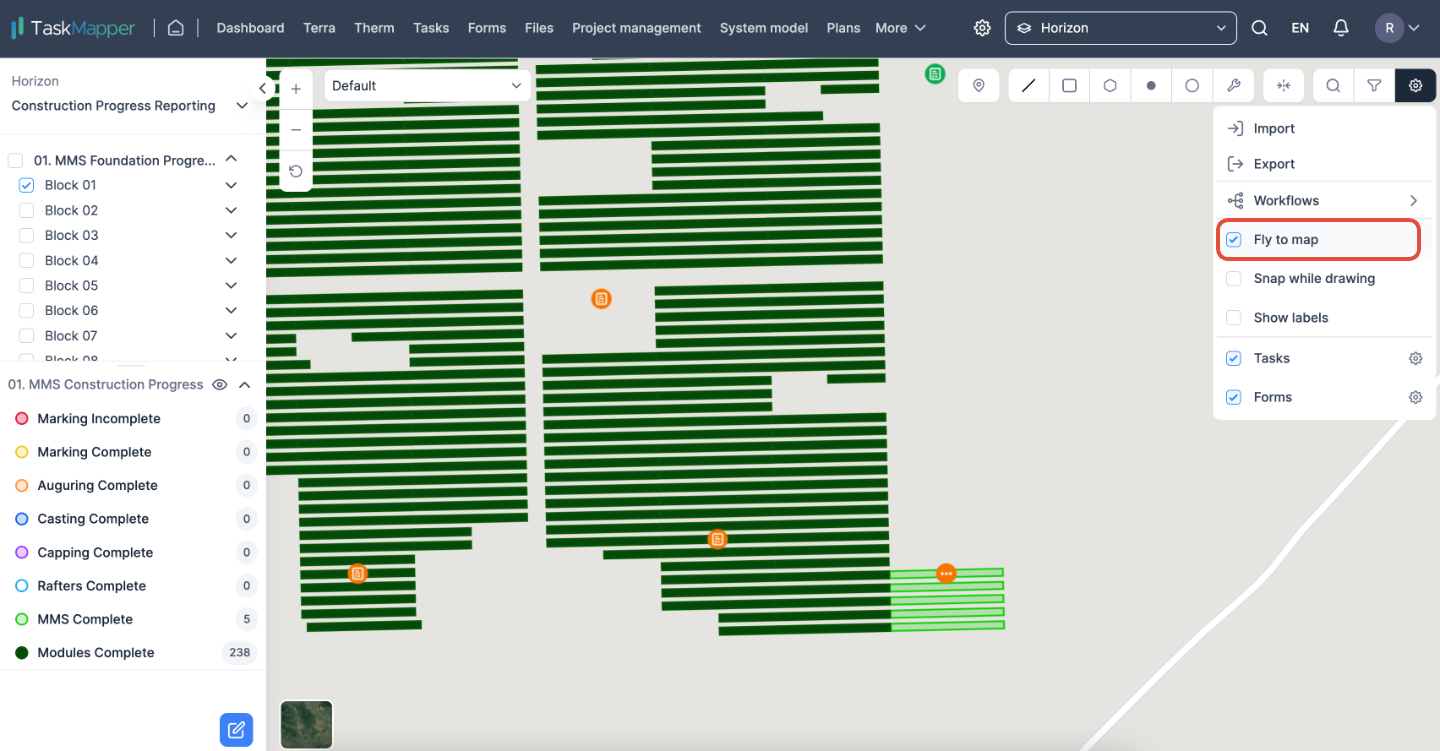
FIGURE 12: FLY TO MAP
How to enable or disable labels?
To view the component labels on the map, click on the option 'Show labels' in the map view.
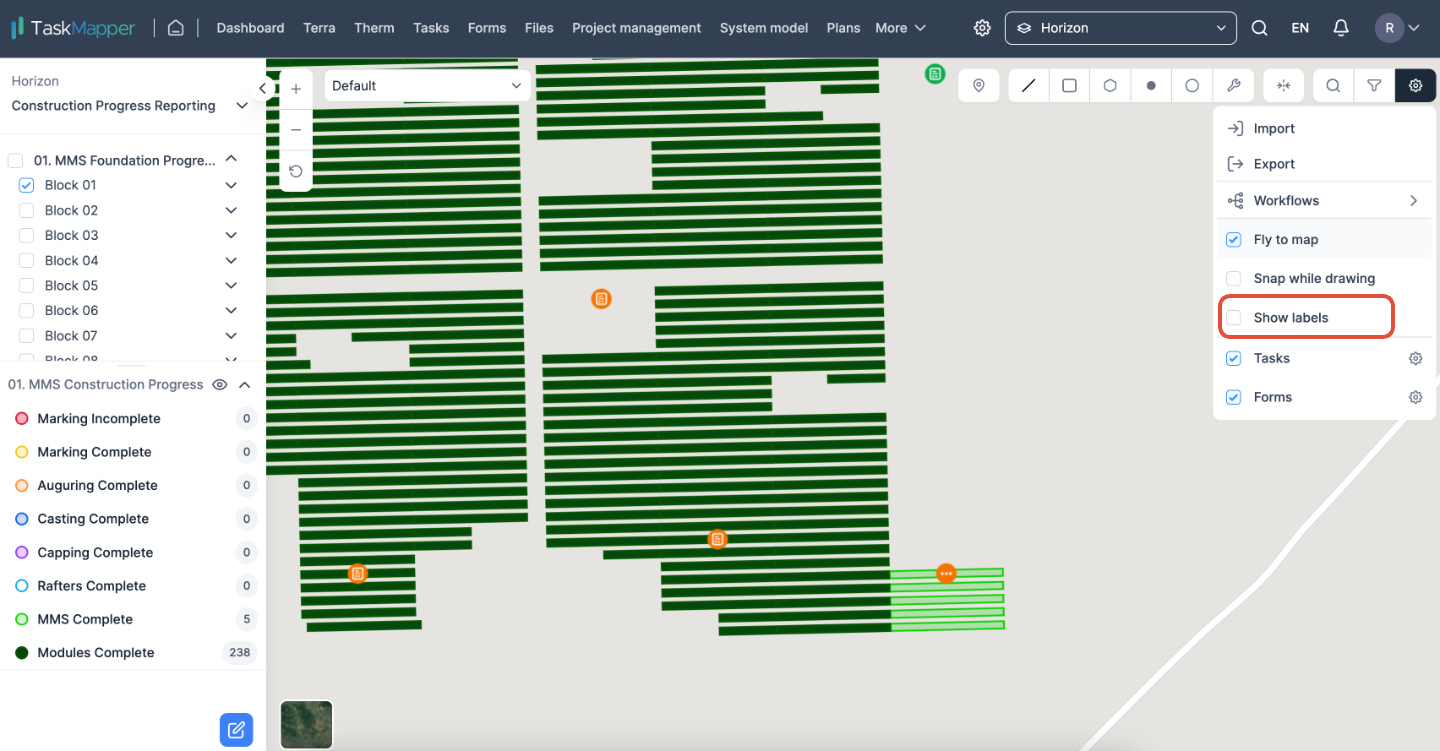
FIGURE 13(a): SHOW LABELS
When enabled
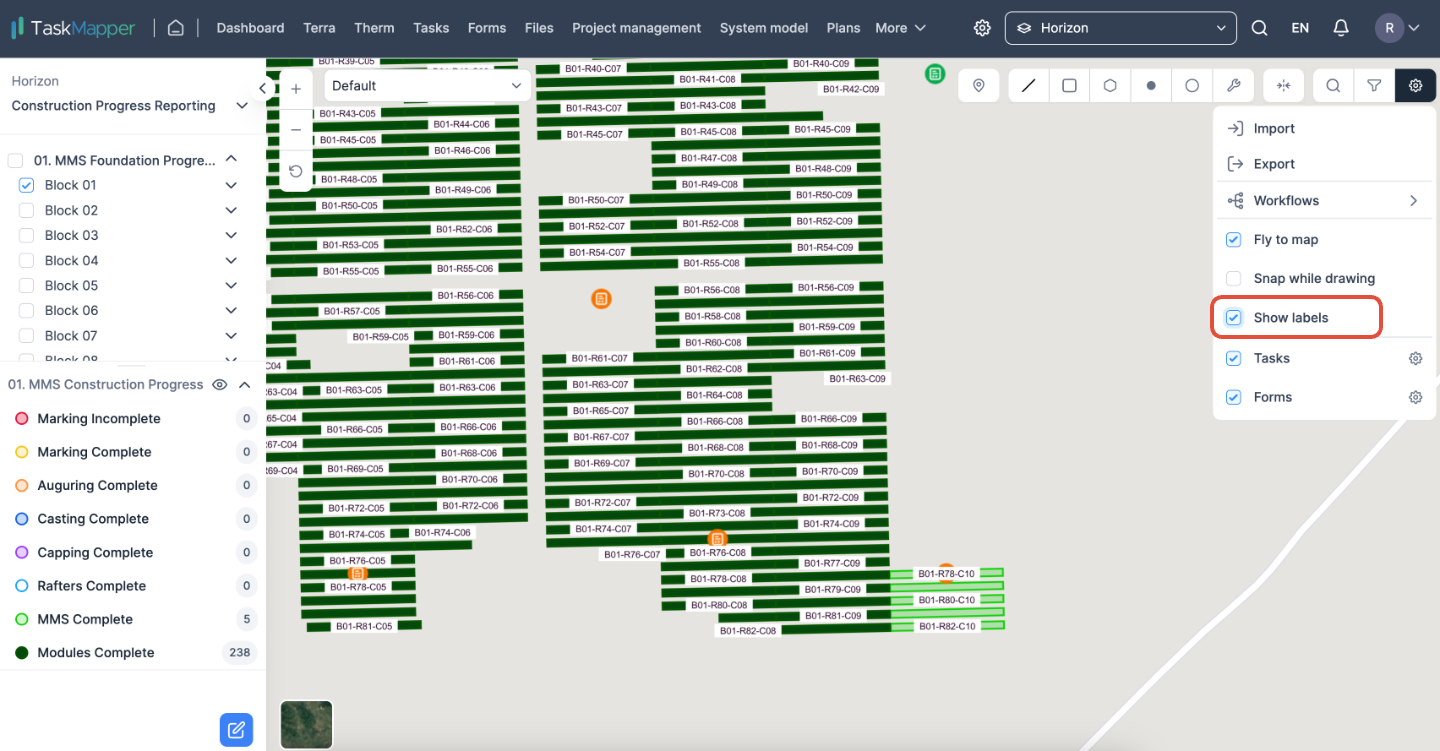
FIGURE 13(b): SHOW LABELS
How to toggle visibility of tasks/ forms on the map?
To toggle the visibility of tasks/forms on the map, check or uncheck for tasks/forms.
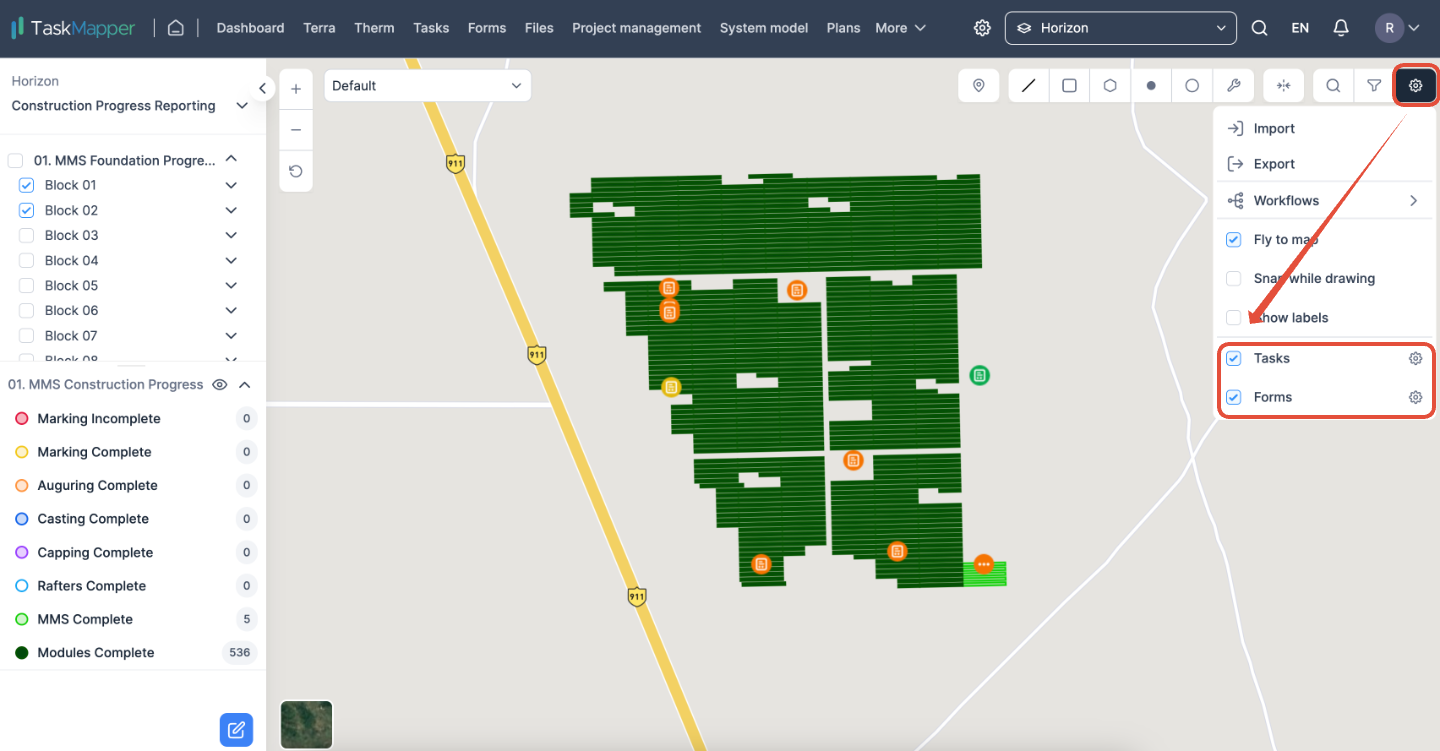
FIGURE 14: TOGGLE VISIBILITY OF TASKS/FORMS
How to filter tasks/ forms that are visible on the map?
To filter tasks/forms on the map view, click on the gear icon next to tasks and forms.

FIGURE 15(a): FILTERS
Set the required filter and click on save to view the filtered tasks on the map view.
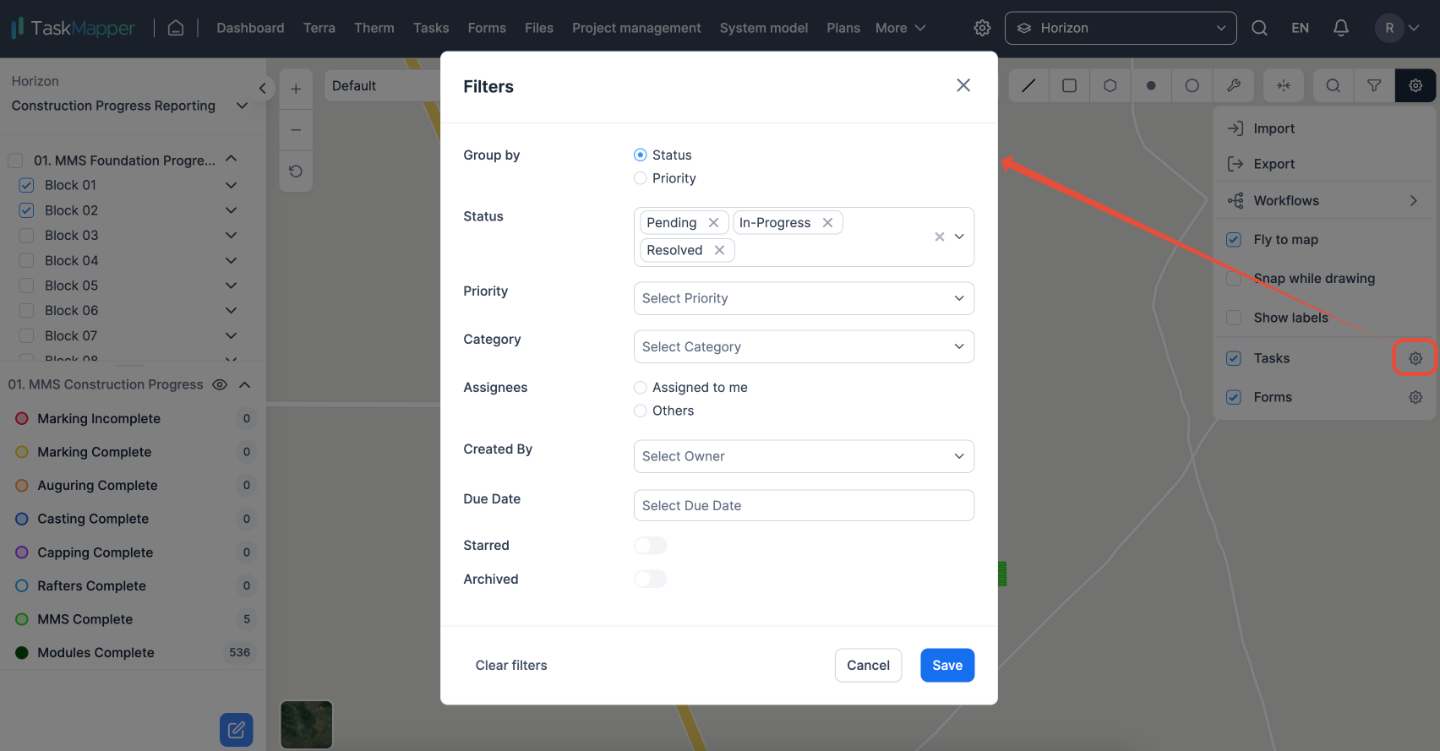
FIGURE 15(b): FILTERS
How to filter vectors that are visible on the map by colour?
If you want to filter vectors on the map, just click on the legend located on the left side of the screen. By clicking on the number displayed in the legend, you can view only the selected vector on the map.
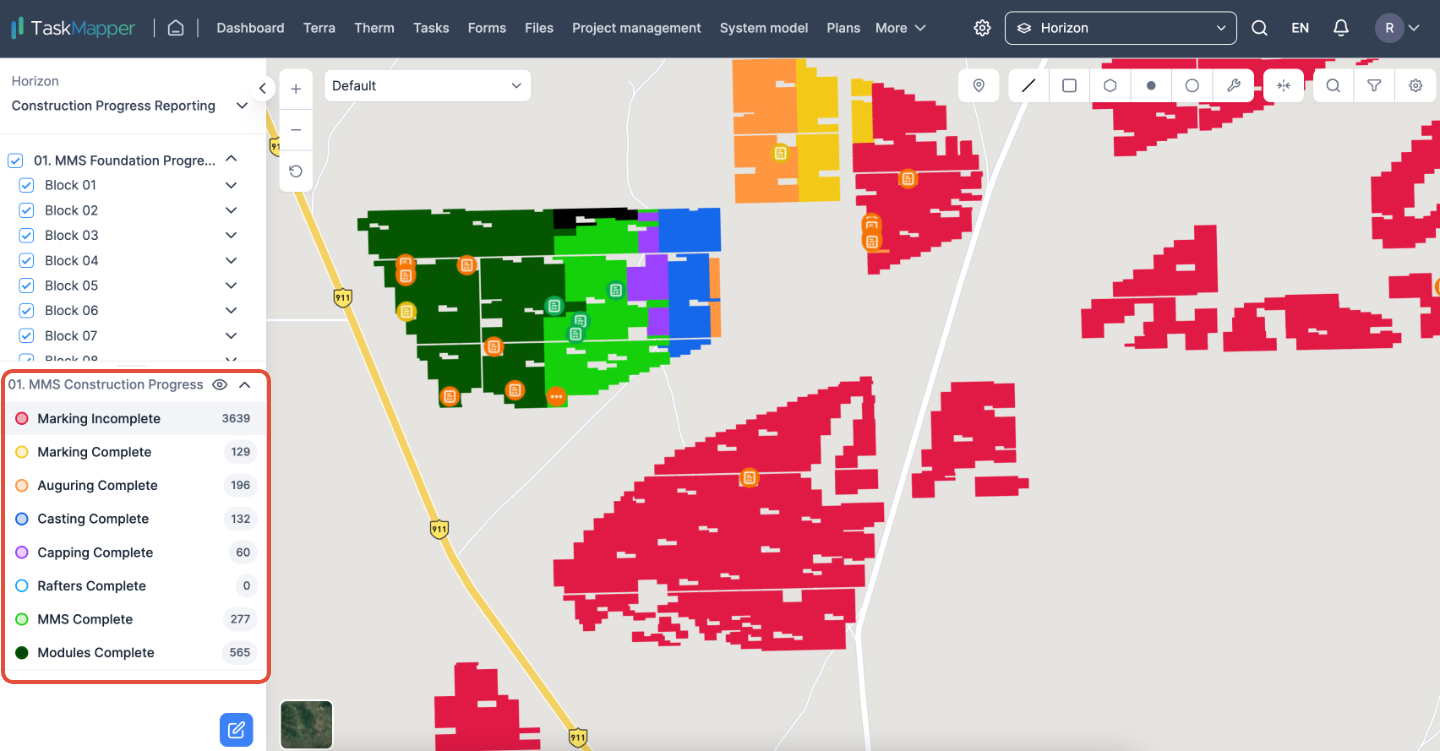
FIGURE 16(a): VECTOR FILTERS
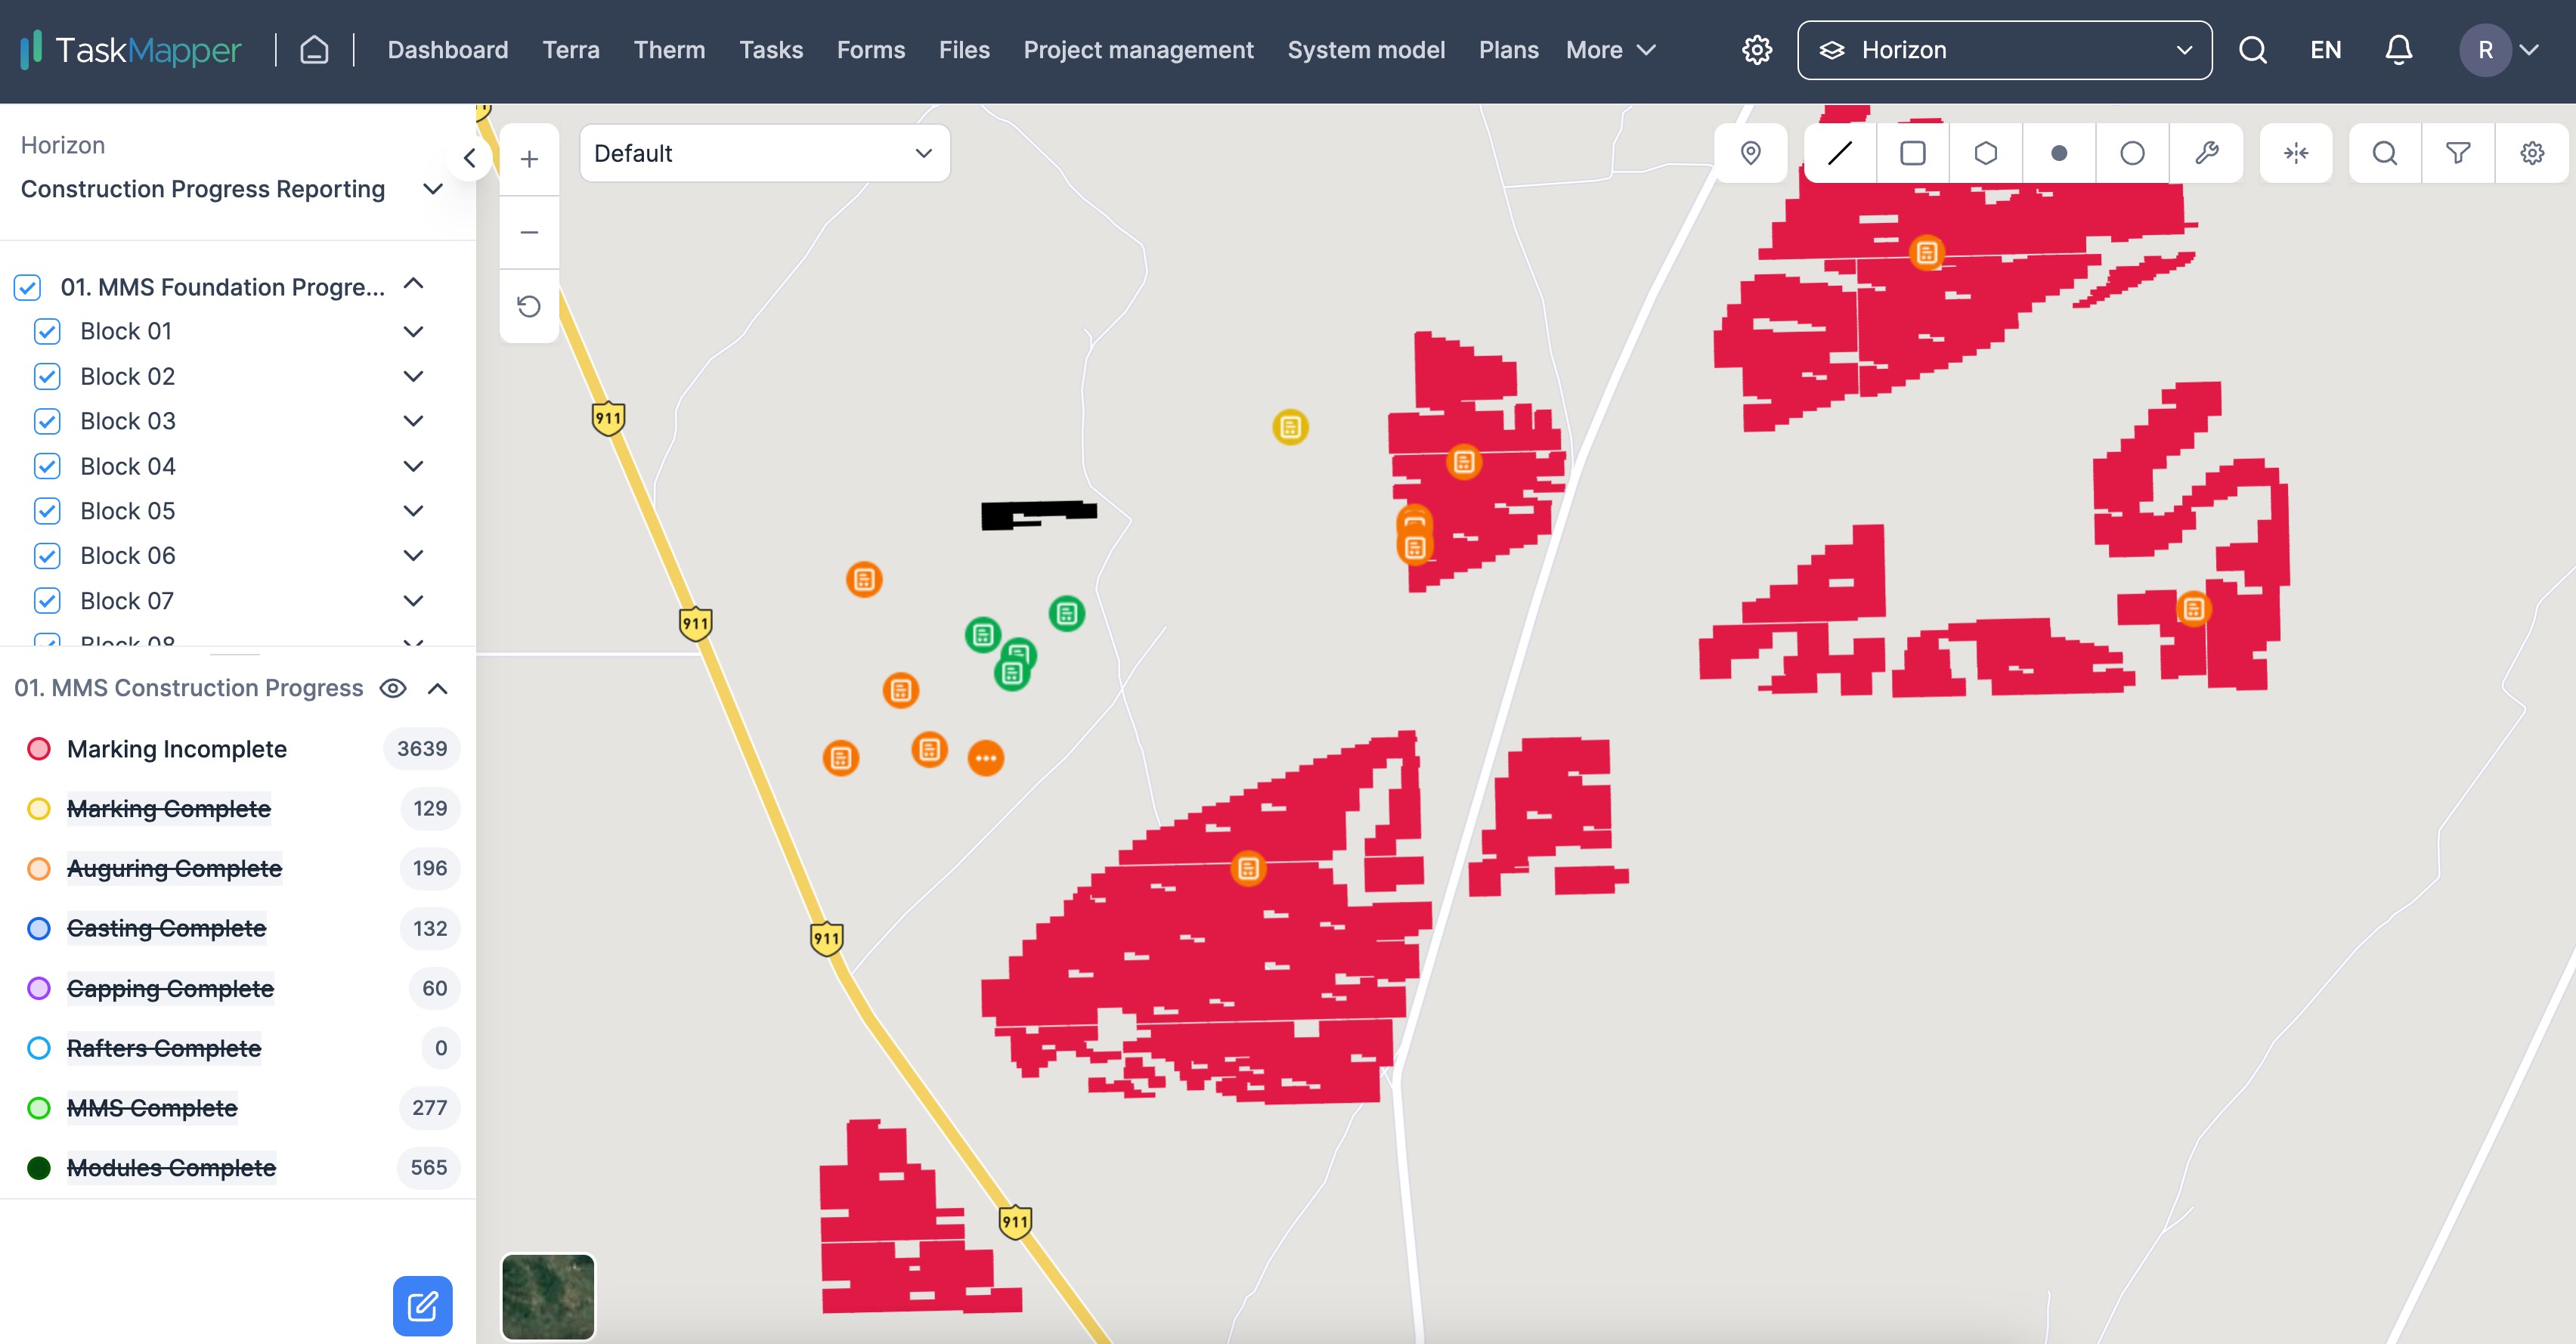
FIGURE 16(b): VECTOR FILTERS
How to filter vectors that are visible on the map by attribute?
To filter by attribute/property, simply click on the filter icon, choose the attribute/property and its value, and then click on the apply button.
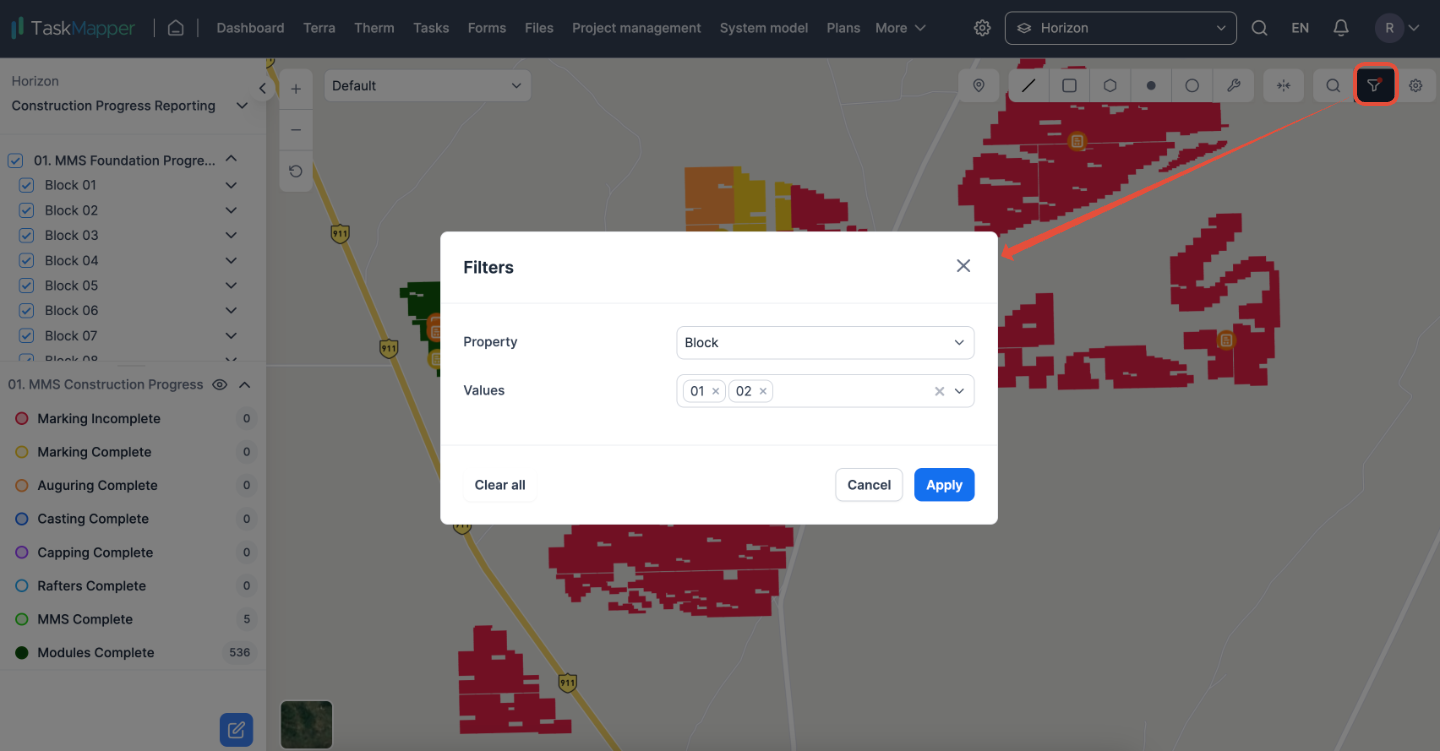
FIGURE 17: ATTRIBUTE/PROPERTY FILTERS
How to toggle map view between Street or Satellite?
To toggle map view between streen or satellite, click on the icon at the bottom left on the map view
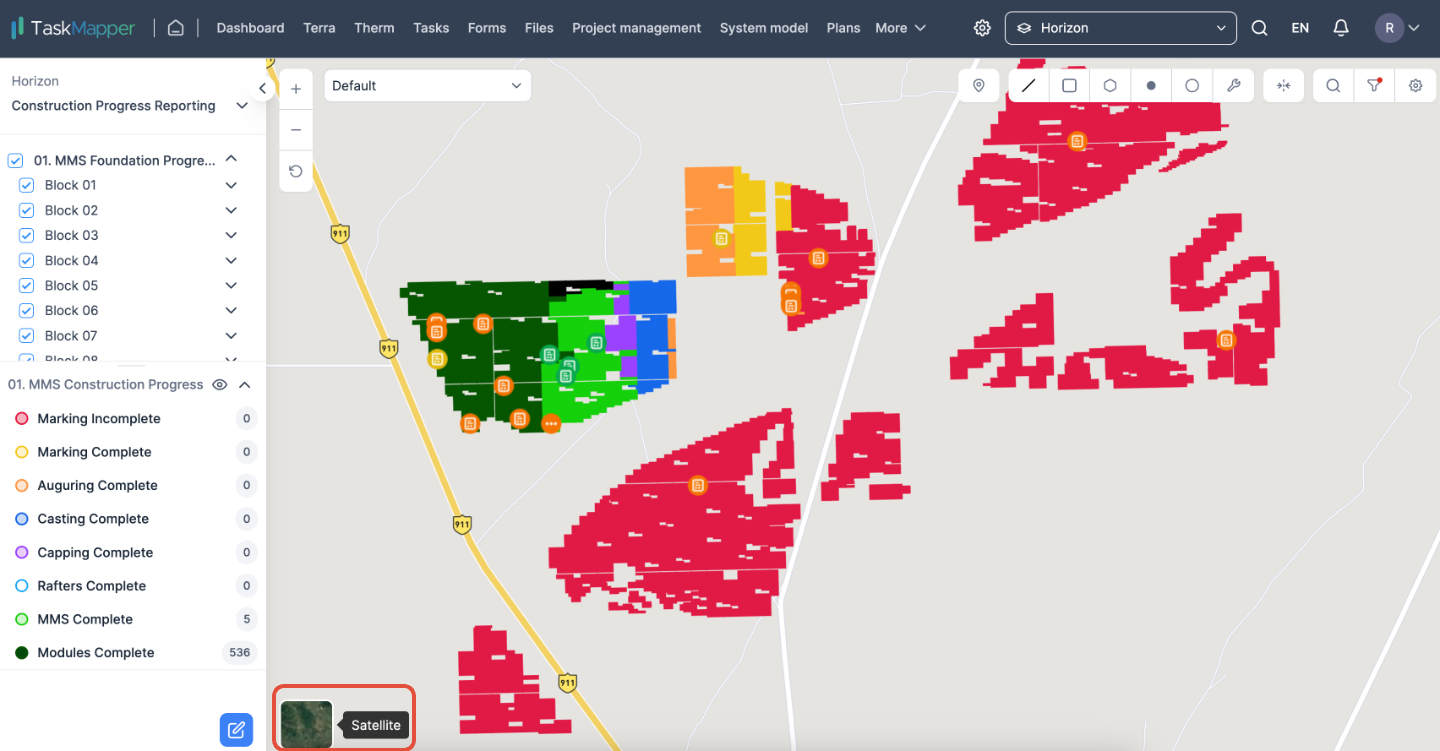
FIGURE 18: VIEWS - STREET VIEW

FIGURE 18: VIEWS - SATELLITE VIEW
How to compare maps?
If there are multiple scan dates, the Compare feature will help understand the progress. Comparing two scan dates will allow for an easy visual understanding of the work progress based on the map's colour-coded feature types.
FIGURE 19: COMPARE
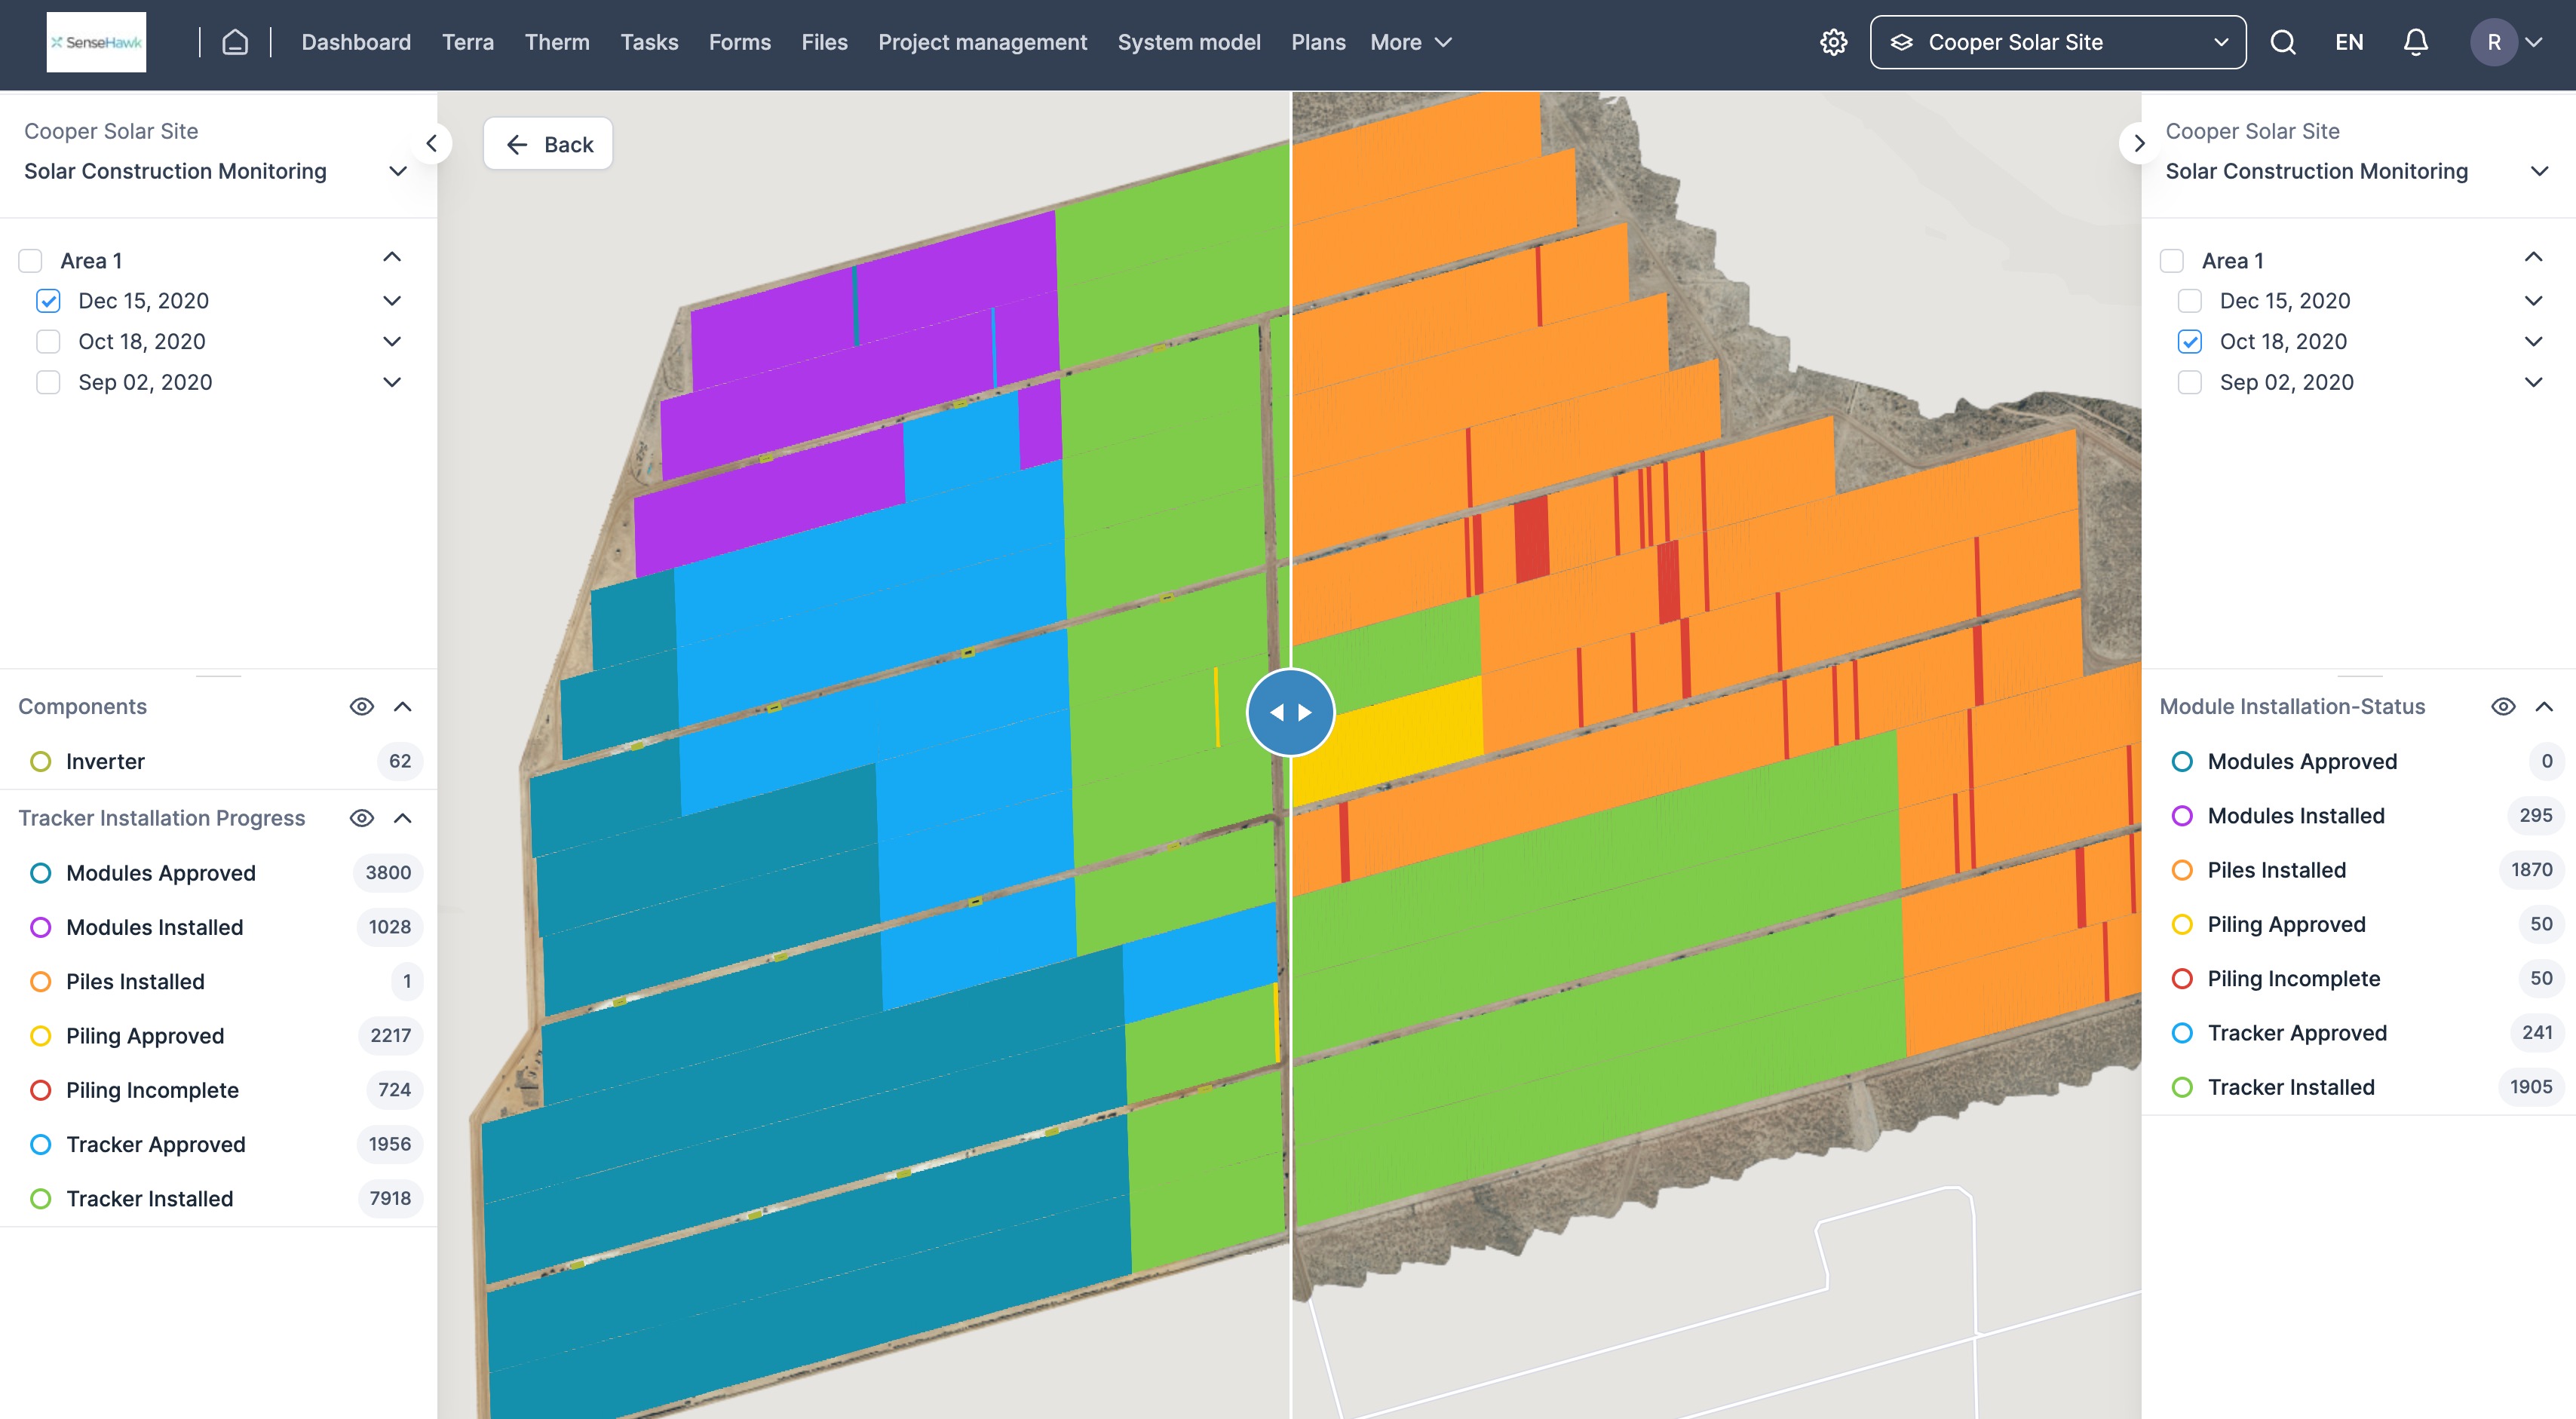
FIGURE 19(a): SCAN DATES SELECTION FOR COMPARISION
How to edit a feature type?
A feature type can be edited and the options available in the edit are name, choose options between fill colour or pattern and fill opacity. Below are the steps to edit
1) Click on the edit icon on the left-hand side of the screen
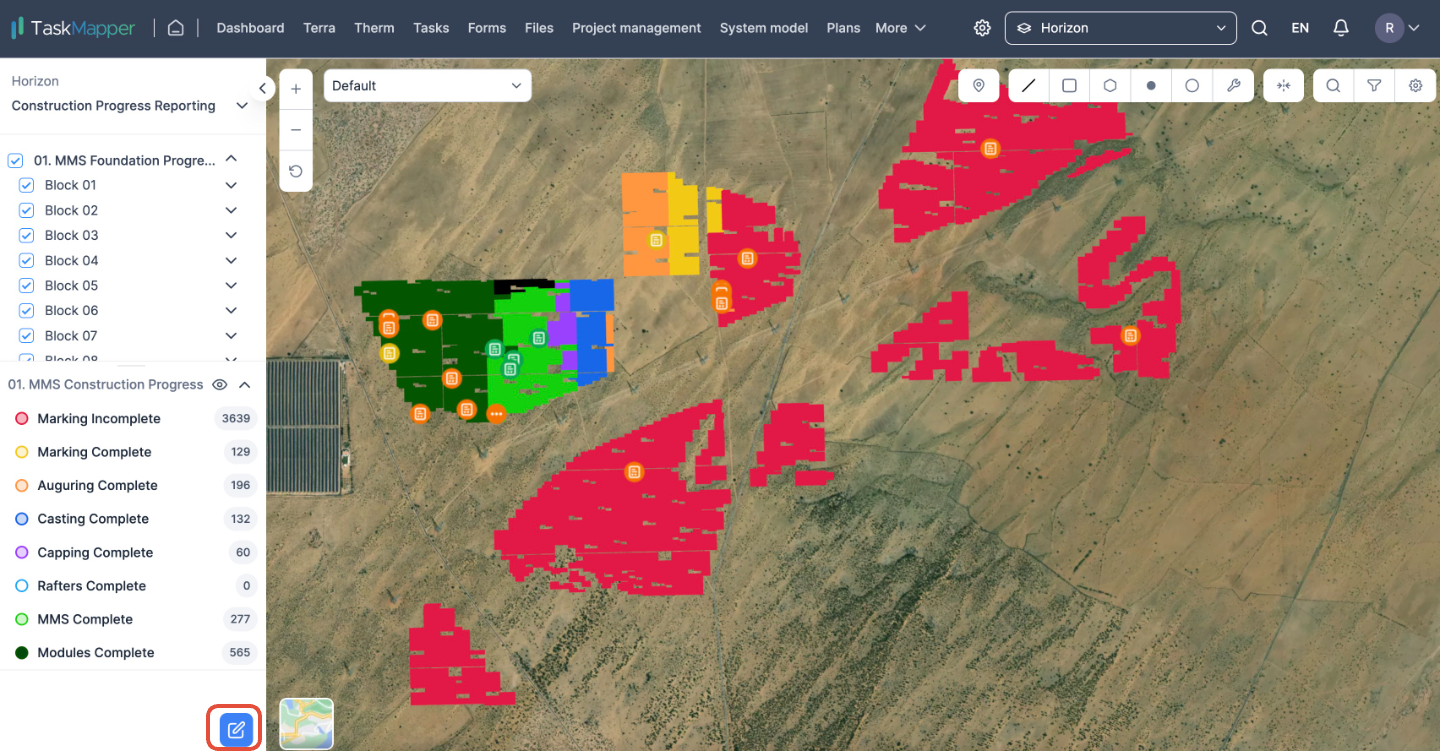
FIGURE 20(a): FEATURE TYPE EDIT
2) Edit the group in which the feature type needs changes
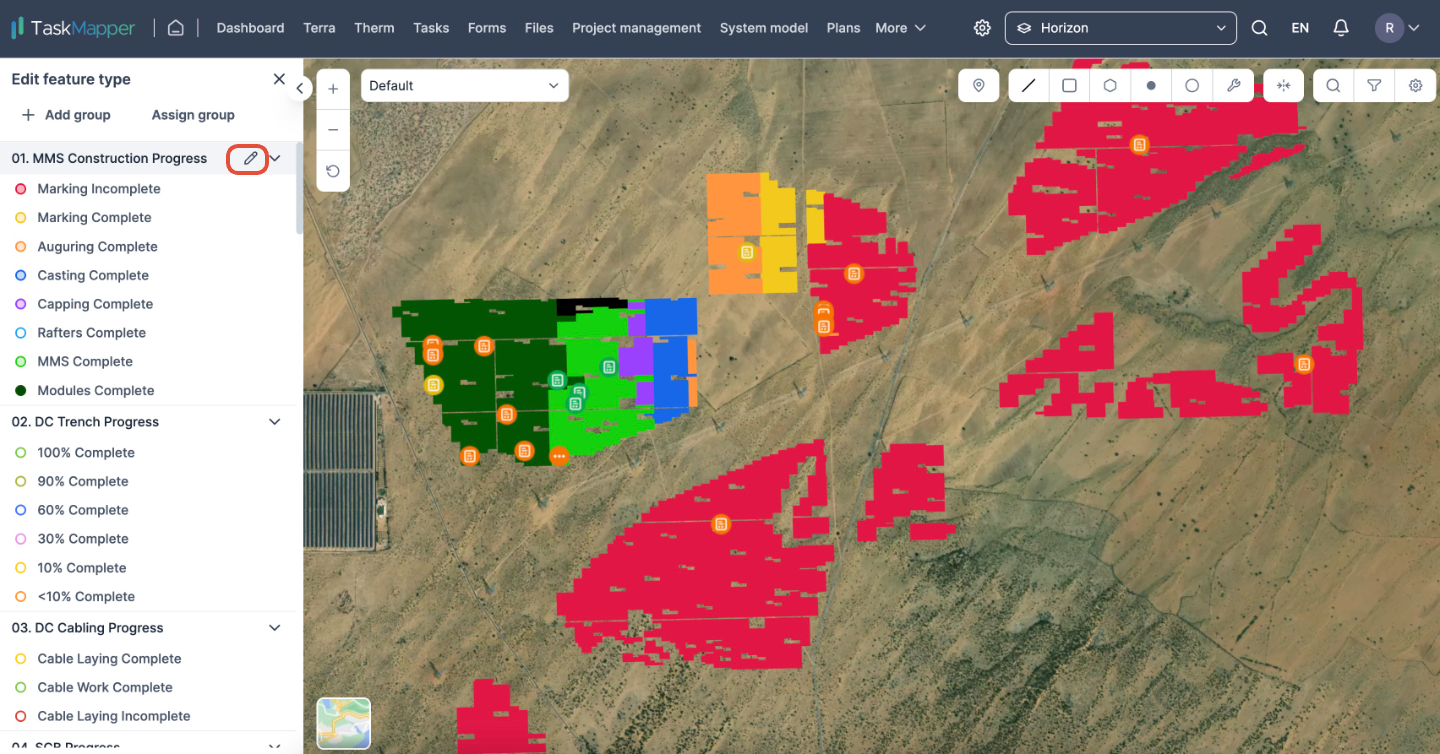
FIGURE 20(b): FEATURE TYPE EDIT
3) Edit the Feature type
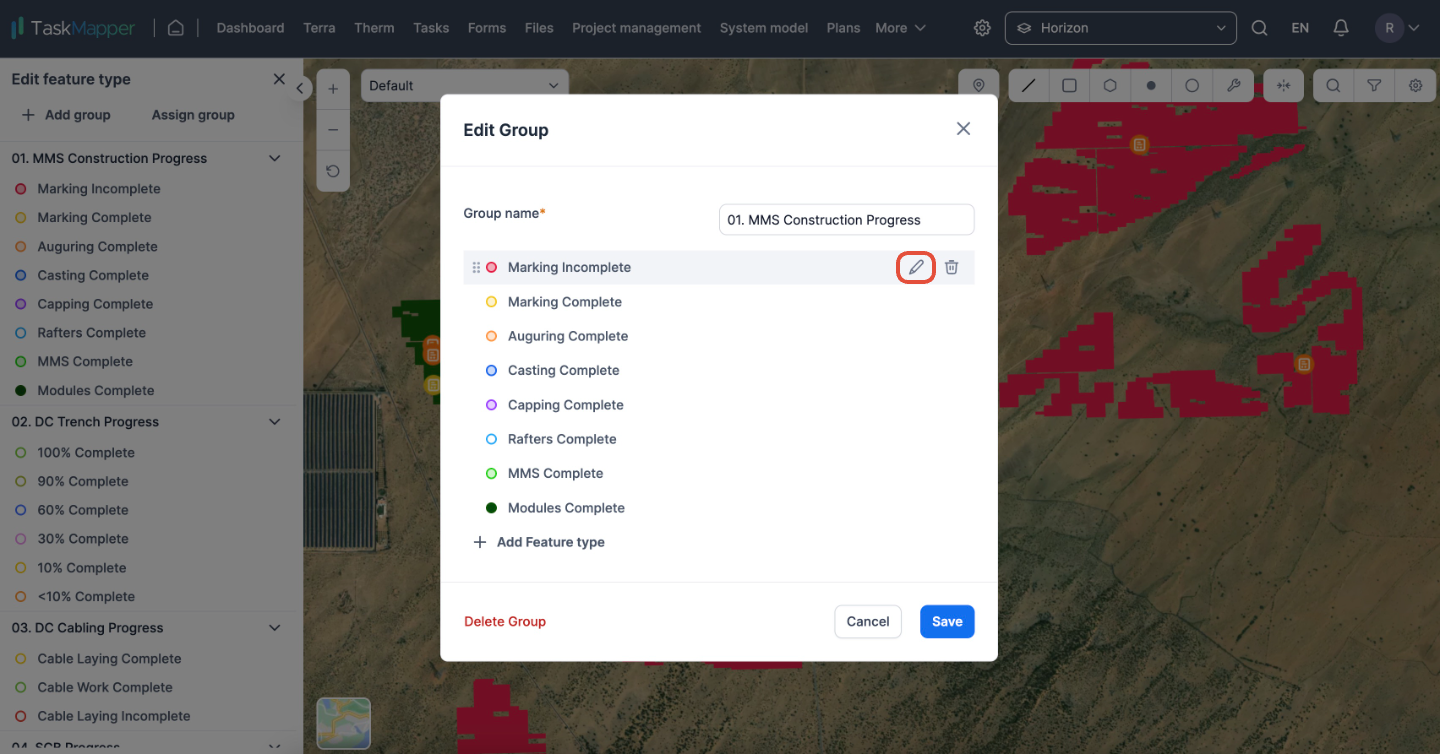
FIGURE 20(c): FEATURE TYPE EDIT
4) Editable options are name, color (Fill or Pattern), and Opacity. Click on 'Save' when complete.
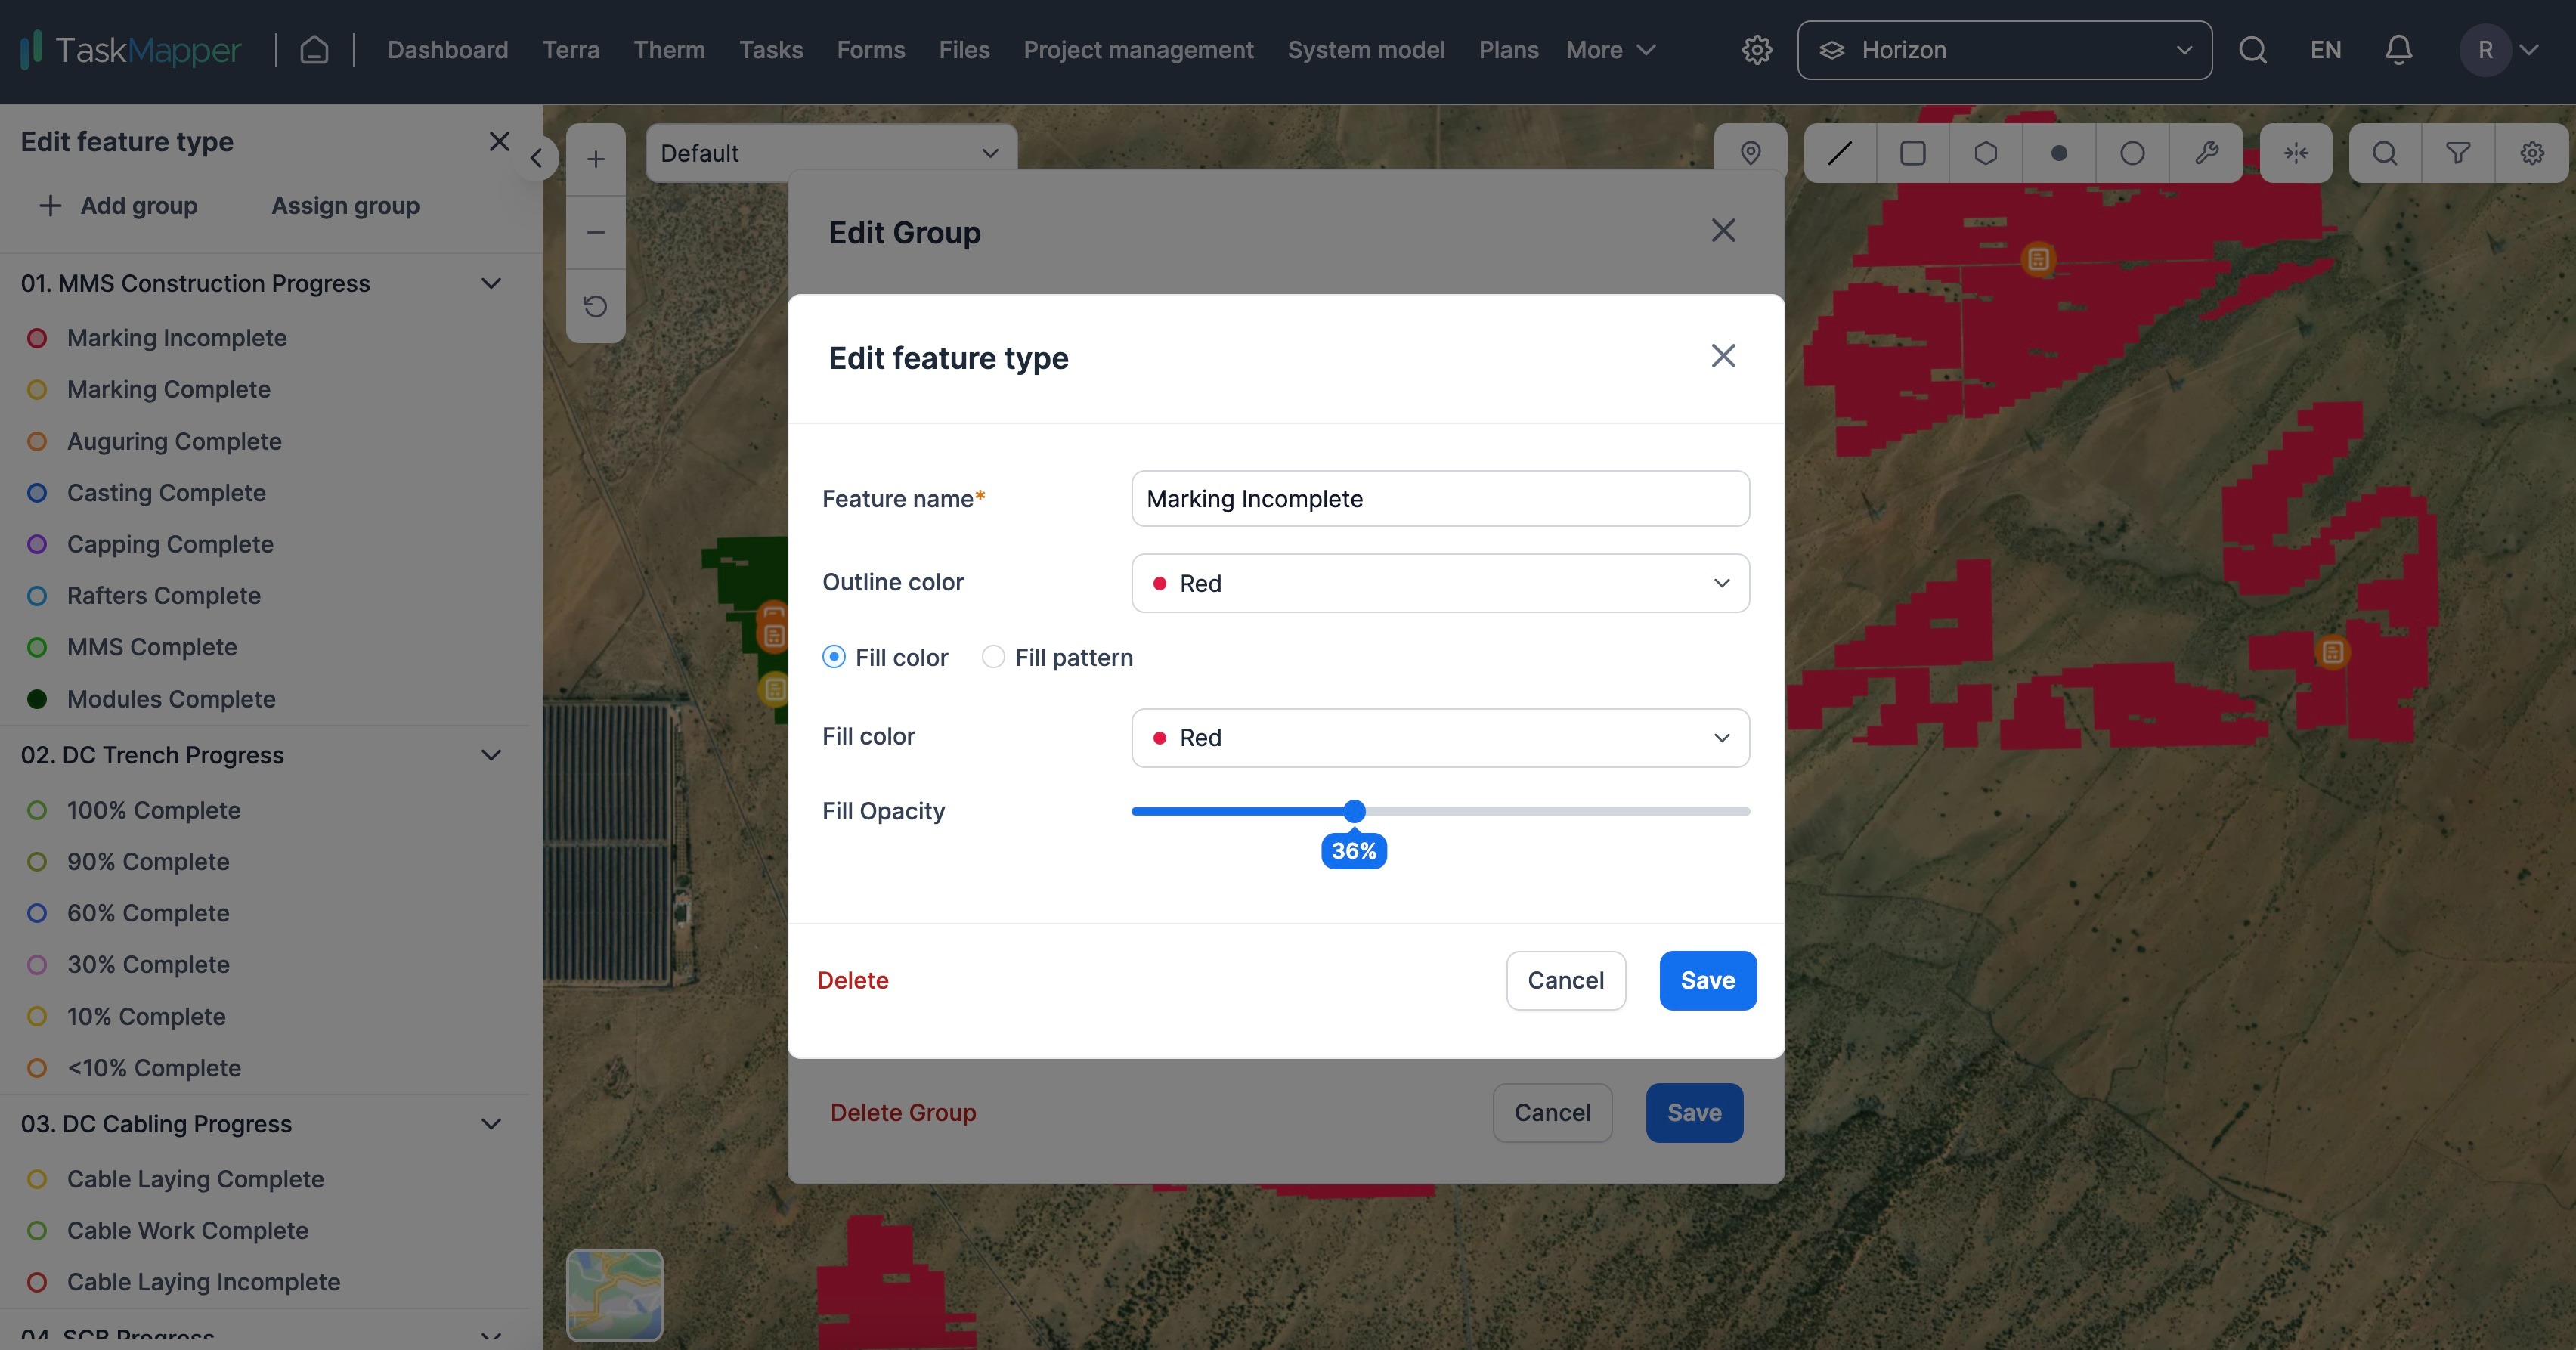
FIGURE 20(d): FEATURE TYPE EDIT