Scan App (Module Serial Number Scanning & Mapping)
Last updated March 7, 2025
TABLE OF CONTENTS
SenseHawk Scan Mobile App
Android Device
Please click here or scan the QR code below to install the App on an Android device.
Introduction to SenseHawk Scan App
Solar project sites are getting bigger, with site sizes exceeding 1000 acres. It is challenging to track and manage components during construction and accurately map them to the final plant as-built. A typical 250 MW plant will have over 600,000 solar panels installed across a 1000+ acre area. To ease maintenance and warranty claims, the site team must create a digital record of where each solar panel is installed before handing it over to the operations & maintenance team.
Module Barcode Scanning with SenseHawk Scan App
The SenseHawk Scan App combines a map-based interface with a barcode scanner to extract the module serial number and map each panel to the exact location in the powerplant's digital model. The powerplant's layout and module placement (# of rows and columns per table) are first configured on the SenseHawk Core platform using AutoCAD design files. Site personnel can then visualize the table layout on a georeferenced map using the SenseHawk Scan App. The App also indicates the person's real-time location on the site map, making it easy to identify nearby tables.
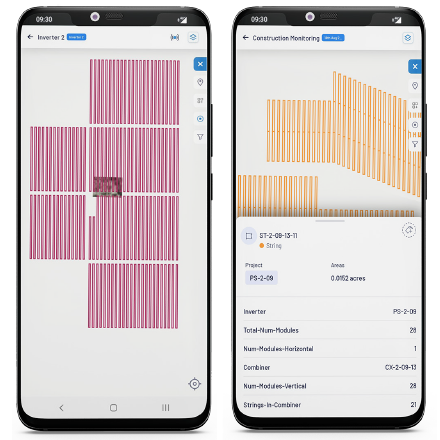
FIGURE 1: MAP-BASED INTERFACE
Ideally, serial numbers must be scanned during installation since it barely requires additional effort. All module IDs will be stored in a database mapped to the tables and strings.
Using the integrated barcode scanner and the App offers high scanning productivity - a single person can scan module serial numbers at up to 5 MWs per day or over 15000 panels per day. Given the size of solar sites, multiple personnel might be scanning components across the site simultaneously. There is no risk of duplicate entries since the solution has a built-in conflict management feature that ensures that the re-scan of an already scanned module does not cause duplication.
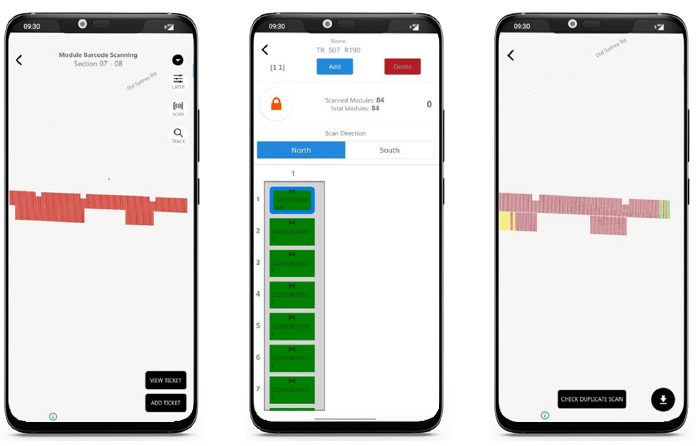
FIGURE 2: MODULE BARCODE SCANNING INTERFACE
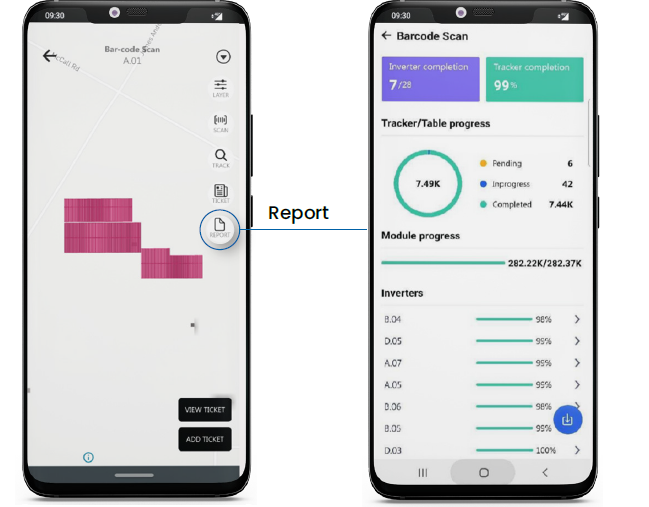
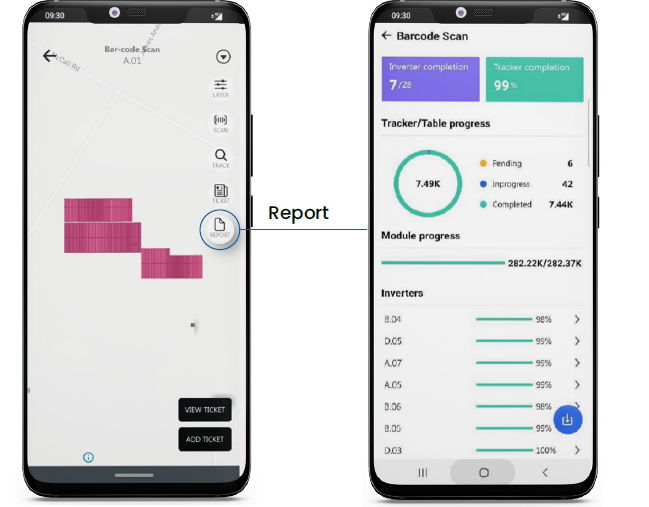
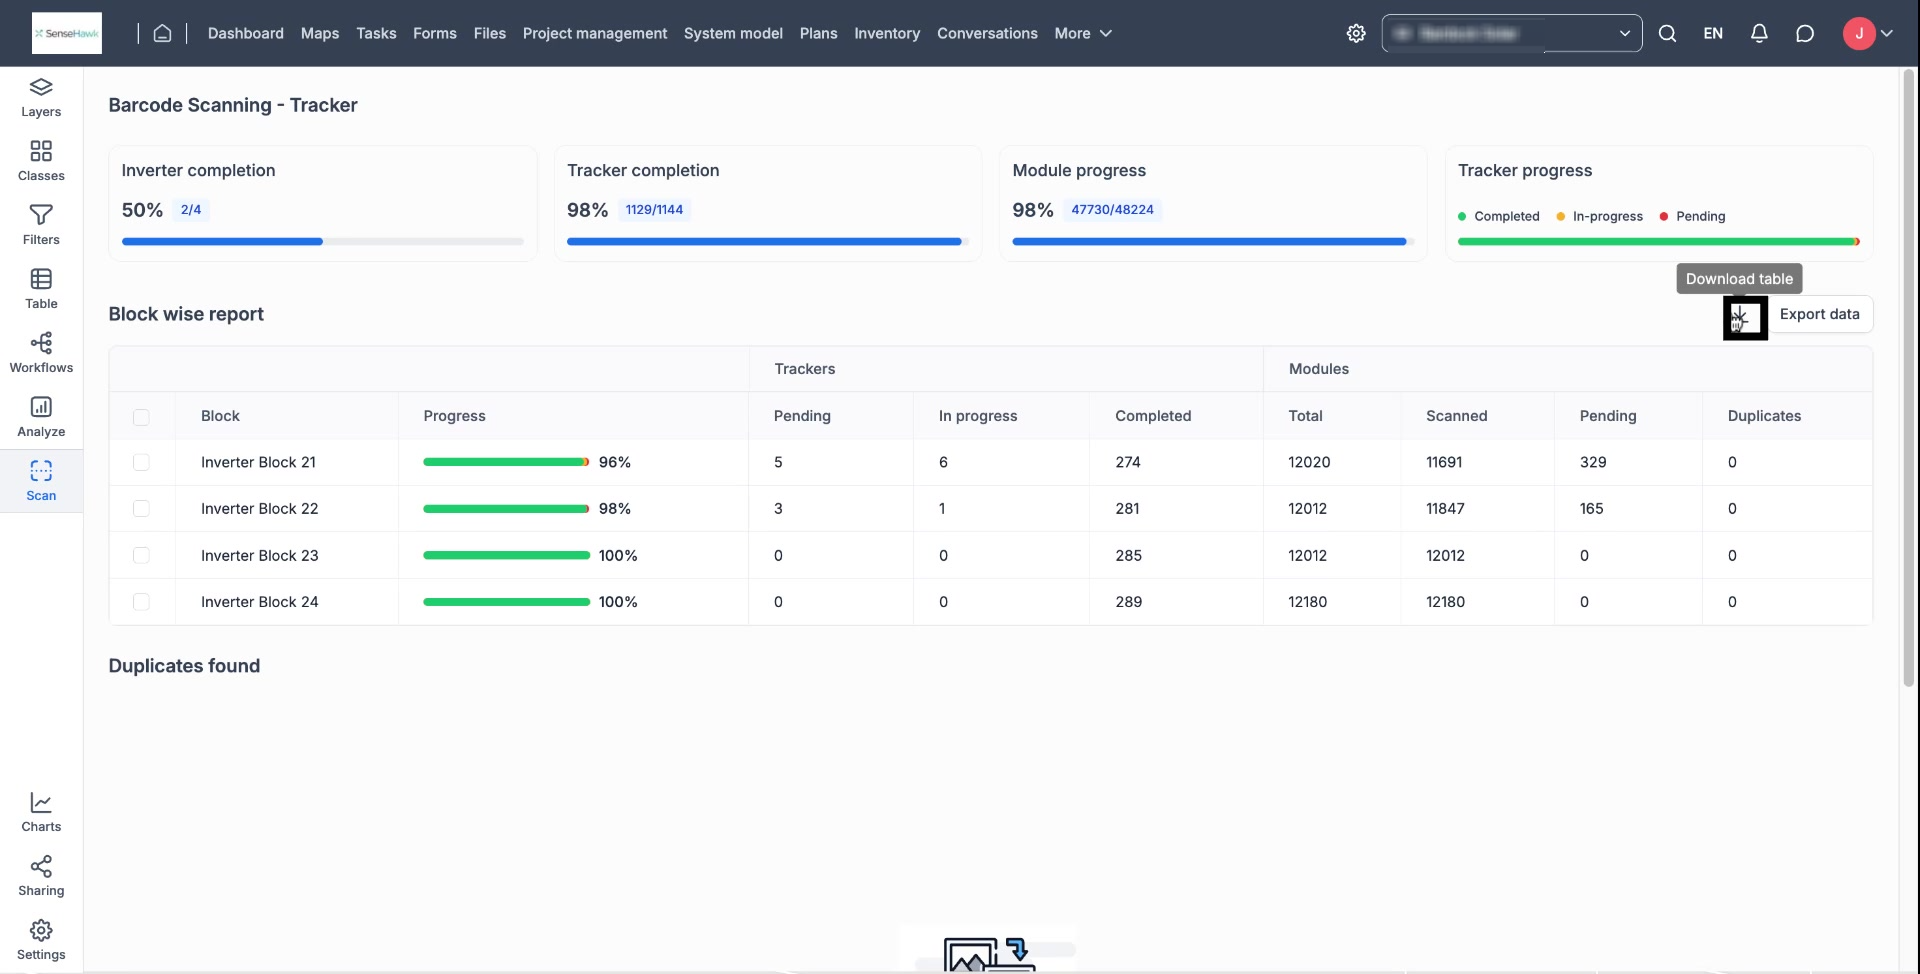
The App has a visual dashboard that allows site teams and managers to track scan status by tracker/table, inverter block, and at the whole plant level, as shown below.
FIGURE 3: REPORT
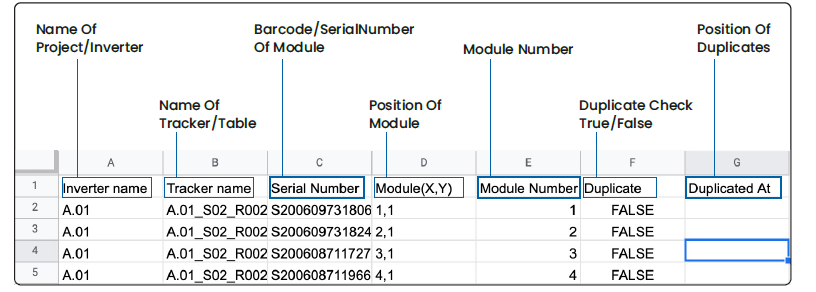
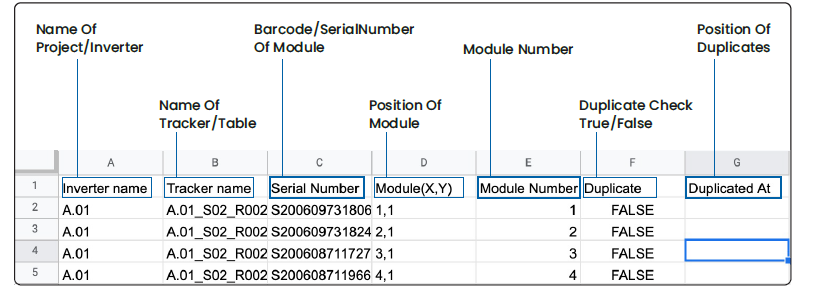
Once data is captured, it can be downloaded in CSV and PDF formats at the click of a button.
FIGURE 4: SAMPLE REPORT IN CSV FORMAT
The Scan App also supports easily capturing serial numbers for replacement modules. It maintains a complete archive of all solar modules and their locations in the plant over the entire lifecycle. The serial number database seamlessly integrates with SenseHawk's Thermography, Task Management, Digital Forms, SenseHawk Field App, and SenseHawk CMMS applications, enabling a complete Digital Twin-based solar asset management approach. This capability helps improve the quality of asset management.
FIGURE 5: SERIAL NUMBERING IN SENSEHAWK SCAN APP
If required, the App can also be configured to record serial numbers of other plant components, e.g., Combiner boxes and Transformer Stations. The stored serial number data mapped to the Digital Twin can also be pushed to existing CMMS (Computerized Maintenance Management System) software APIs.
Challenges
• Create an accurate record of solar panel serial numbers by location
• Map the location of each solar panel in the digital twin of the plant
• Check module installation as per design
Benefits
• Save time, staffing, and costs of capturing solar panel serial numbers and mapping to install location
• Enable digital twin-based asset data organization for increased efficiency
• Ensure the site on the ground is a replica of a digital model – making maintenance easier
SenseHawk Scan App for Bar Code Scanning
SenseHawk Scan dashboard in web app
Bar code scanning using the SenseHawk Scan app:
For bar code scanning of components on a project site, we can follow two methods:
- Conduct an "As-built" drone scan and update bar codes on component locations directly on the drone map
- Use component locations from the CAD layout of the construction site to conduct barcode scanning
The first option will correct any variations in component locations affected during construction.
Hardware:
SenseHawk Mobile App is compatible with any Android or iOS mobile device. Go to the Google Play Store or Apple Store and download the SenseHawk Scan App.
Scanning PV modules using the Sensehawk Scan App:
Scanning PV modules using the App is straightforward with a barcode scanner. You can use an integrated barcode scanner-based Android device like Honeywell CT60XP, Zebra TC72, or an Android phone with a separate Bluetooth-based barcode scanner.
Recommended barcode scanner based Android device: 1. Honeywell CT60XP (With WLAN/WWAN not just WLAN) - Best option 2. Zebra TC72 Touch Computer 9with WWAN - i.e. cellular modem)
3. Zebra TC58 (8GM RAM/64 GB UFS Flash) - Recommended model 3. Panasonic Toughbook N1 Alternate Options: 1. Honeywell CT60 with cellular moden buil in (WLAN+WWAN) 2. Zebra EC50/EC55 ENTERPRISE COMPUTER (Not WWAN but with cellular modem built in)
Follow the below steps to start scanning the module and other component serial numbers on site.
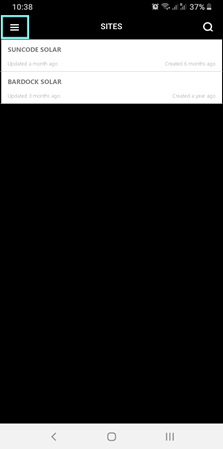
- Login to the SenseHawk Scan App using your login credentials. Once you log in, select the menu button on the top left to select the settings option. Provide the required barcode length. (In case of multiple lengths, please set a range using the Multiscan length settings at the bottom of the list)
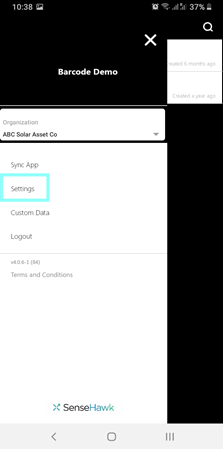
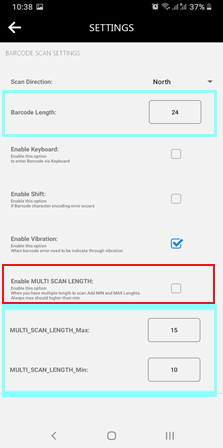
"Enable MULTI SCAN LENGTH" if the barcode has multiple scan lengths. It can also remain enabled for a single-length barcode.
FIGURE 6: APP SETTINGS TO ACCOMMODATE APPROPRIATE BARCODE LENGTH AND MULTISCAN LENGTH SETTINGS
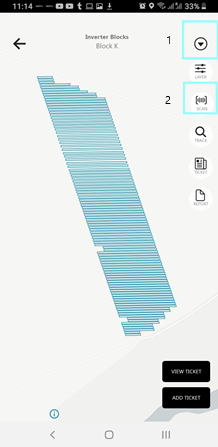
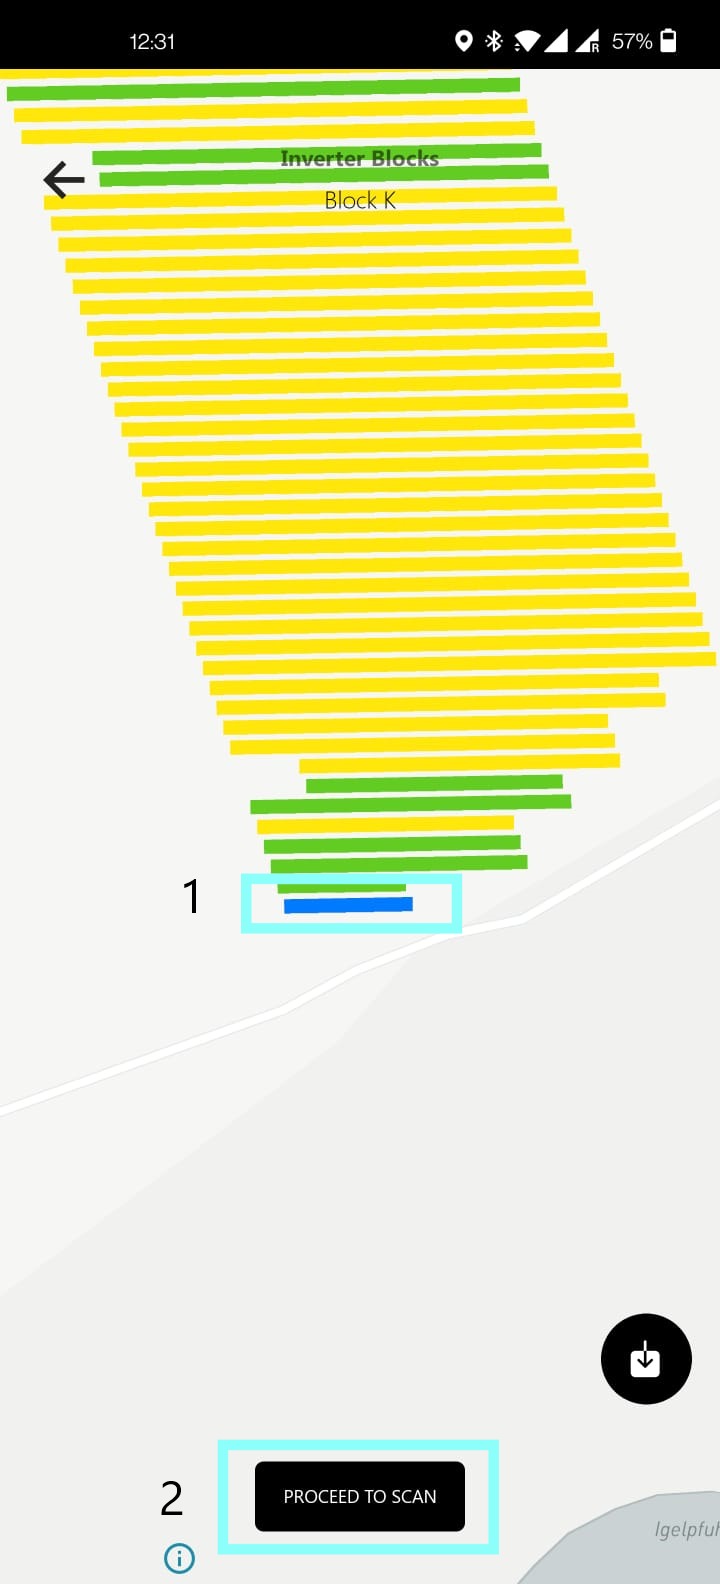
- In the site map, Tables will be set up by Blocks. To scan the modules, click on the down arrow, then click on the SCAN button on the right side of the screen, as shown in (FIGURE 7). This opens a new screen showing the scan status for all tables in the selected block, color-coded based on the scan status. Red color indicates serial numbers are yet to be scanned. The color turns Green when all serial numbers are scanned for a table. Yellow means that the serial numbers are partially scanned in a table. Click on the target table (which turns Blue when selected) and click on 'Proceed to Scan' as shown.
FIGURE 7: SITE MAP AND TABLE COLOR-CODED BASED ON SCAN STATUS
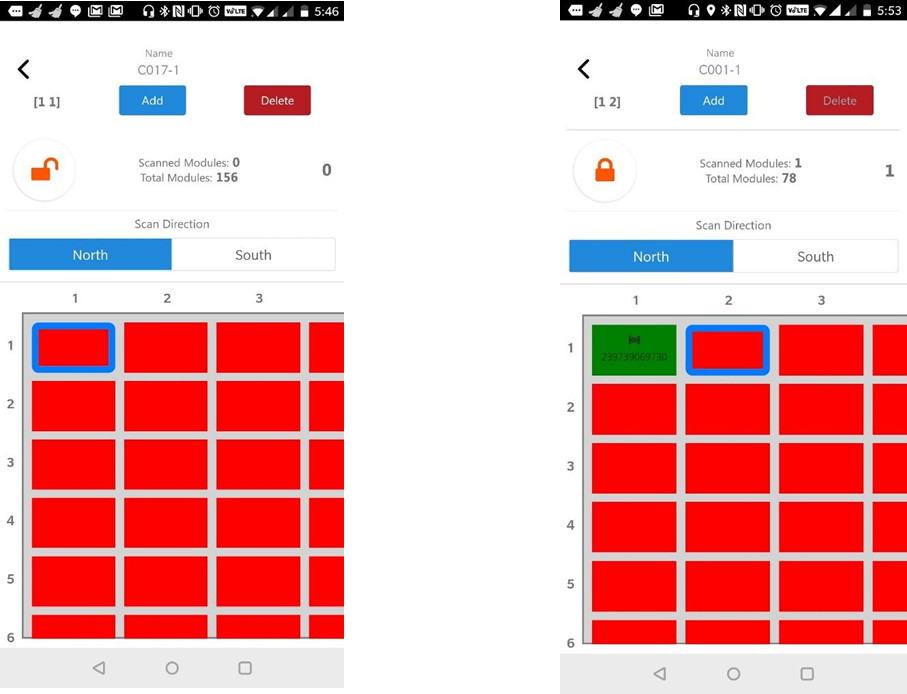
- The module-level table configuration screen (FIGURE 8(a)). To scan a barcode out of sequence, click the lock button to unlock and scan any module to rescan or delete. You can choose the scan sequence, whether from the north side of the table or the south side of the table. If the Bluetooth-based bar code scanner is paired with the Mobile Device, you can aim the scanner at the bar code, and the serial number will be captured and stored against that module location. The blue highlight will then move to the next column in the same row for the following serial number to be scanned sequentially. Nothing else needs to be done – you can keep scanning the serial numbers. Once done, click on the lock button again to lock the records for that table. FIGURE 8(b) illustrates this.
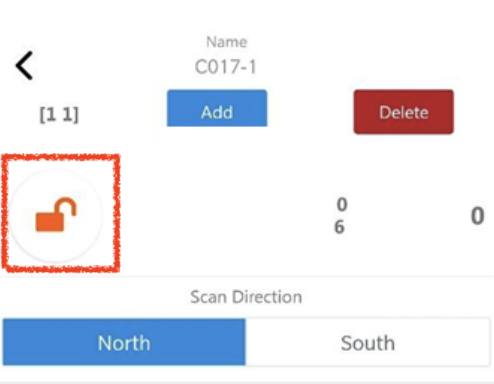
FIGURE 8(a): Lock/Unlock
FIGURE 8(b): MODULE-LEVEL TABLE CONFIGURATION SCREEN
Scanning other components:
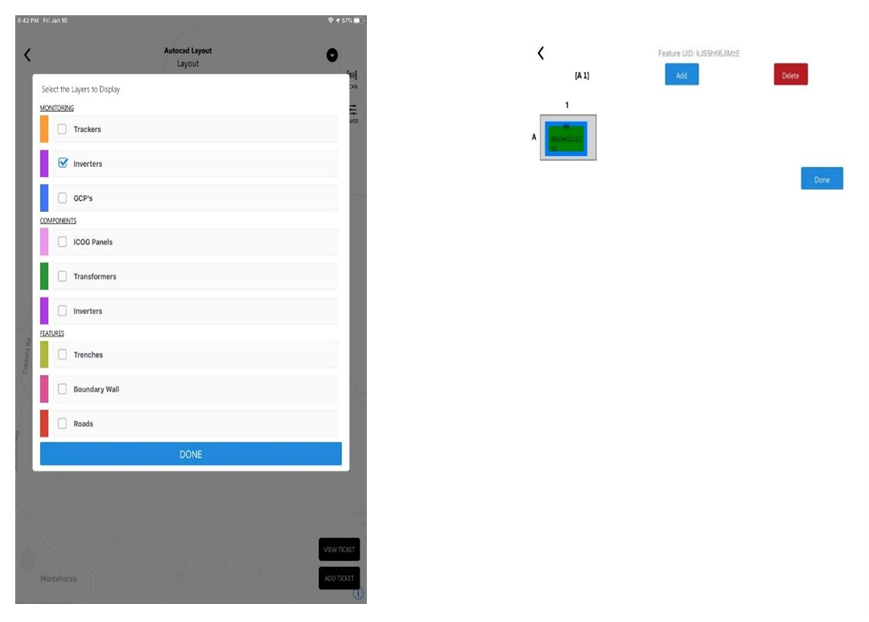
Select the type of layer from the dropdown to scan other components like inverters and combiner boxes.
FIGURE 9: LAYER SELECTION FOR OTHER COMPONENTS SCANNING
Scanning status:
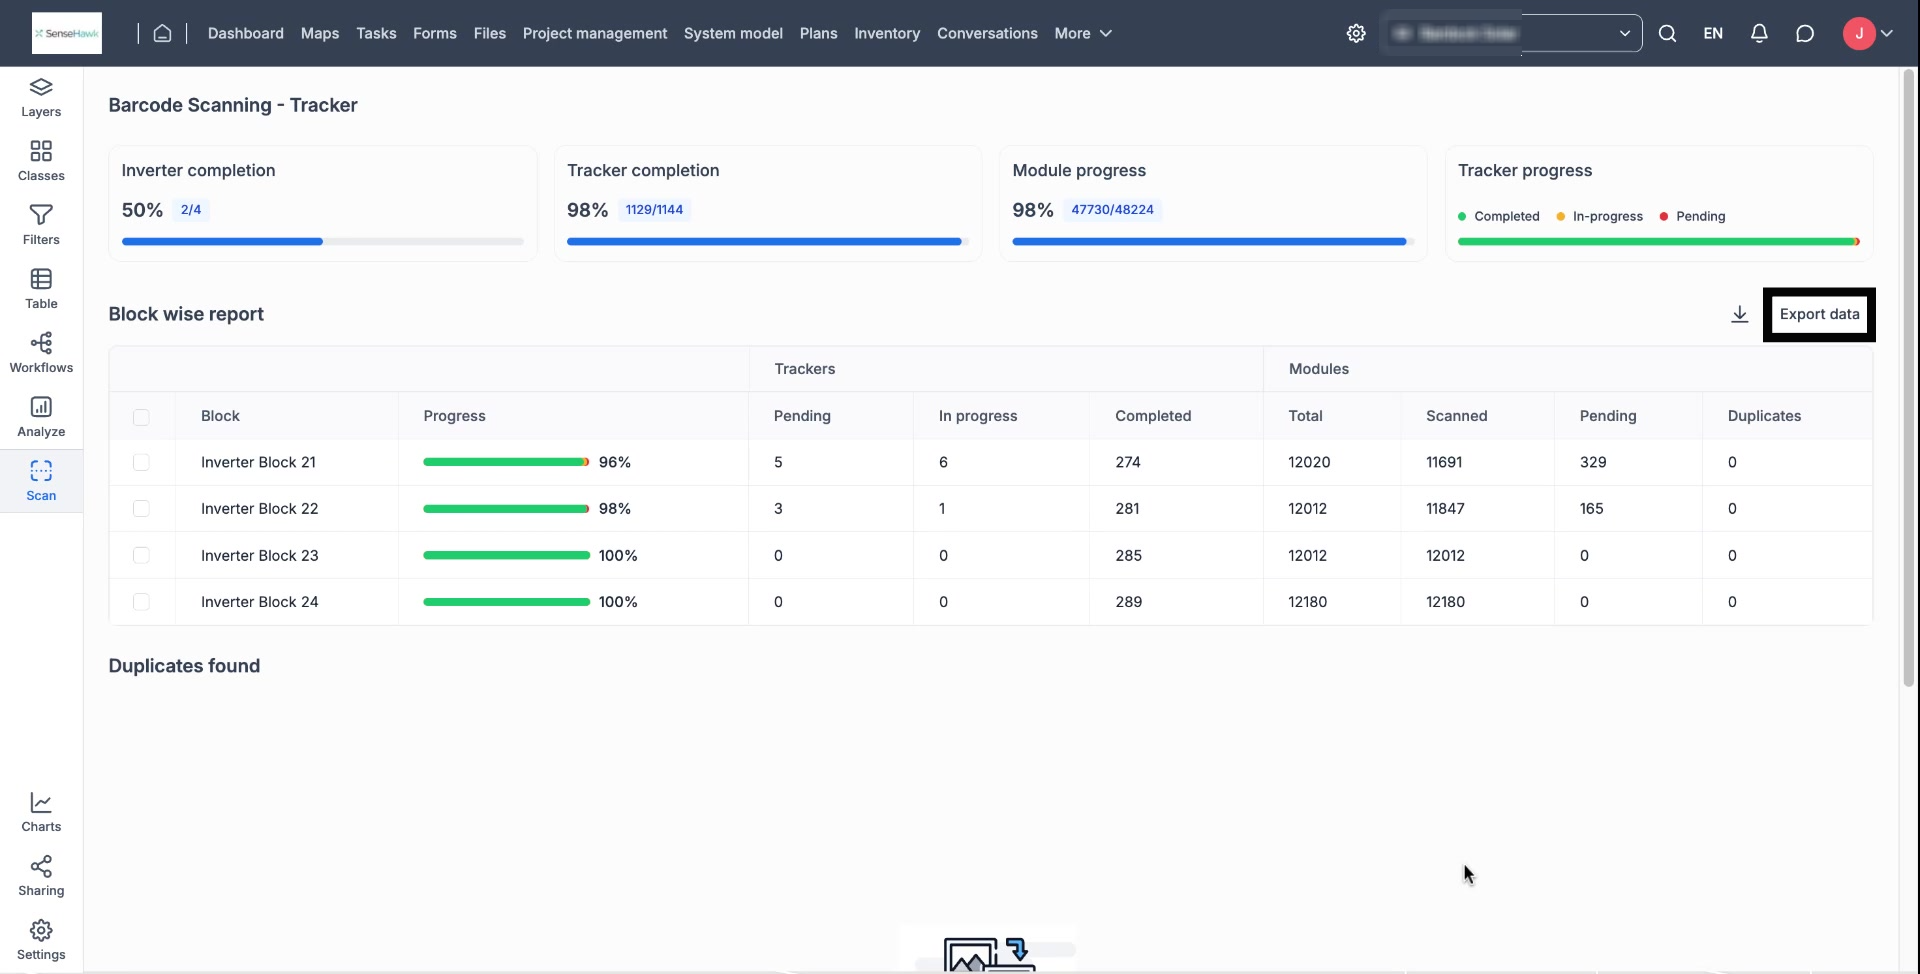
One can quickly see the progress of scanning for any inverter by going to the 'Report' from the site map page. The progress is shown in counts and percentages with appropriate colors for quick understanding.
FIGURE 10: REPORT
Outputs:
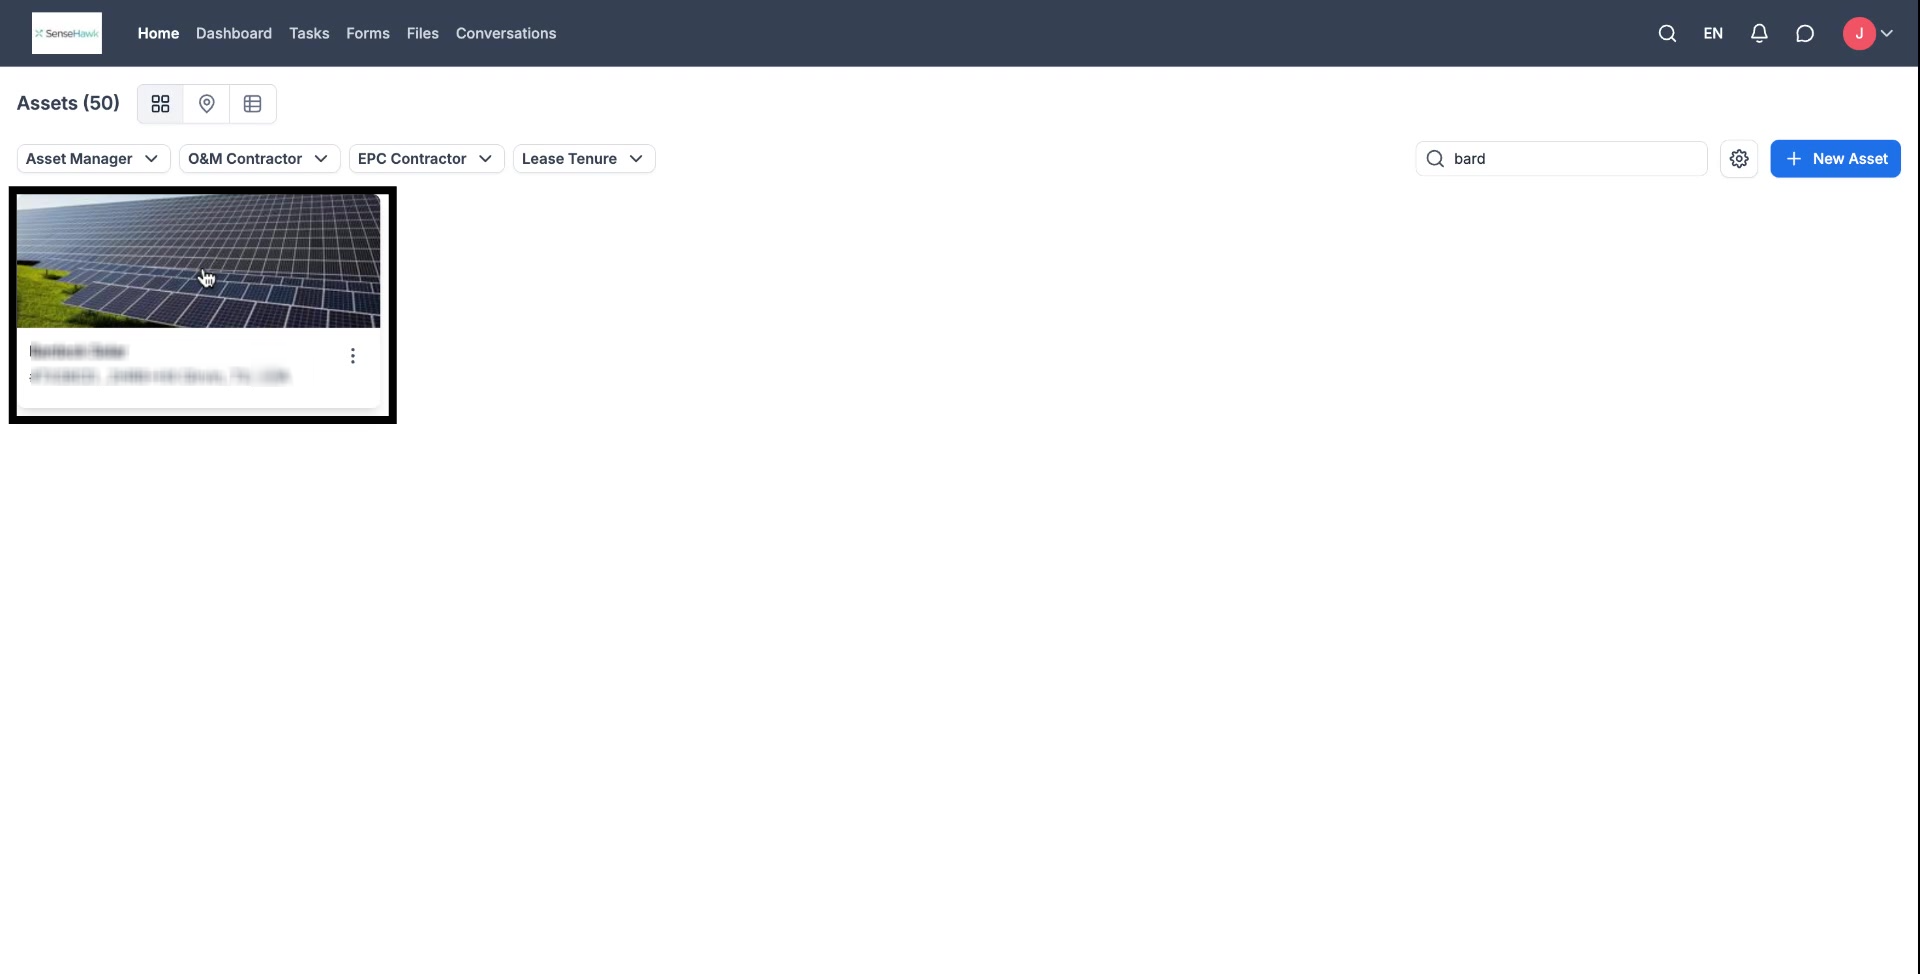
- Click on the asset to view its details.
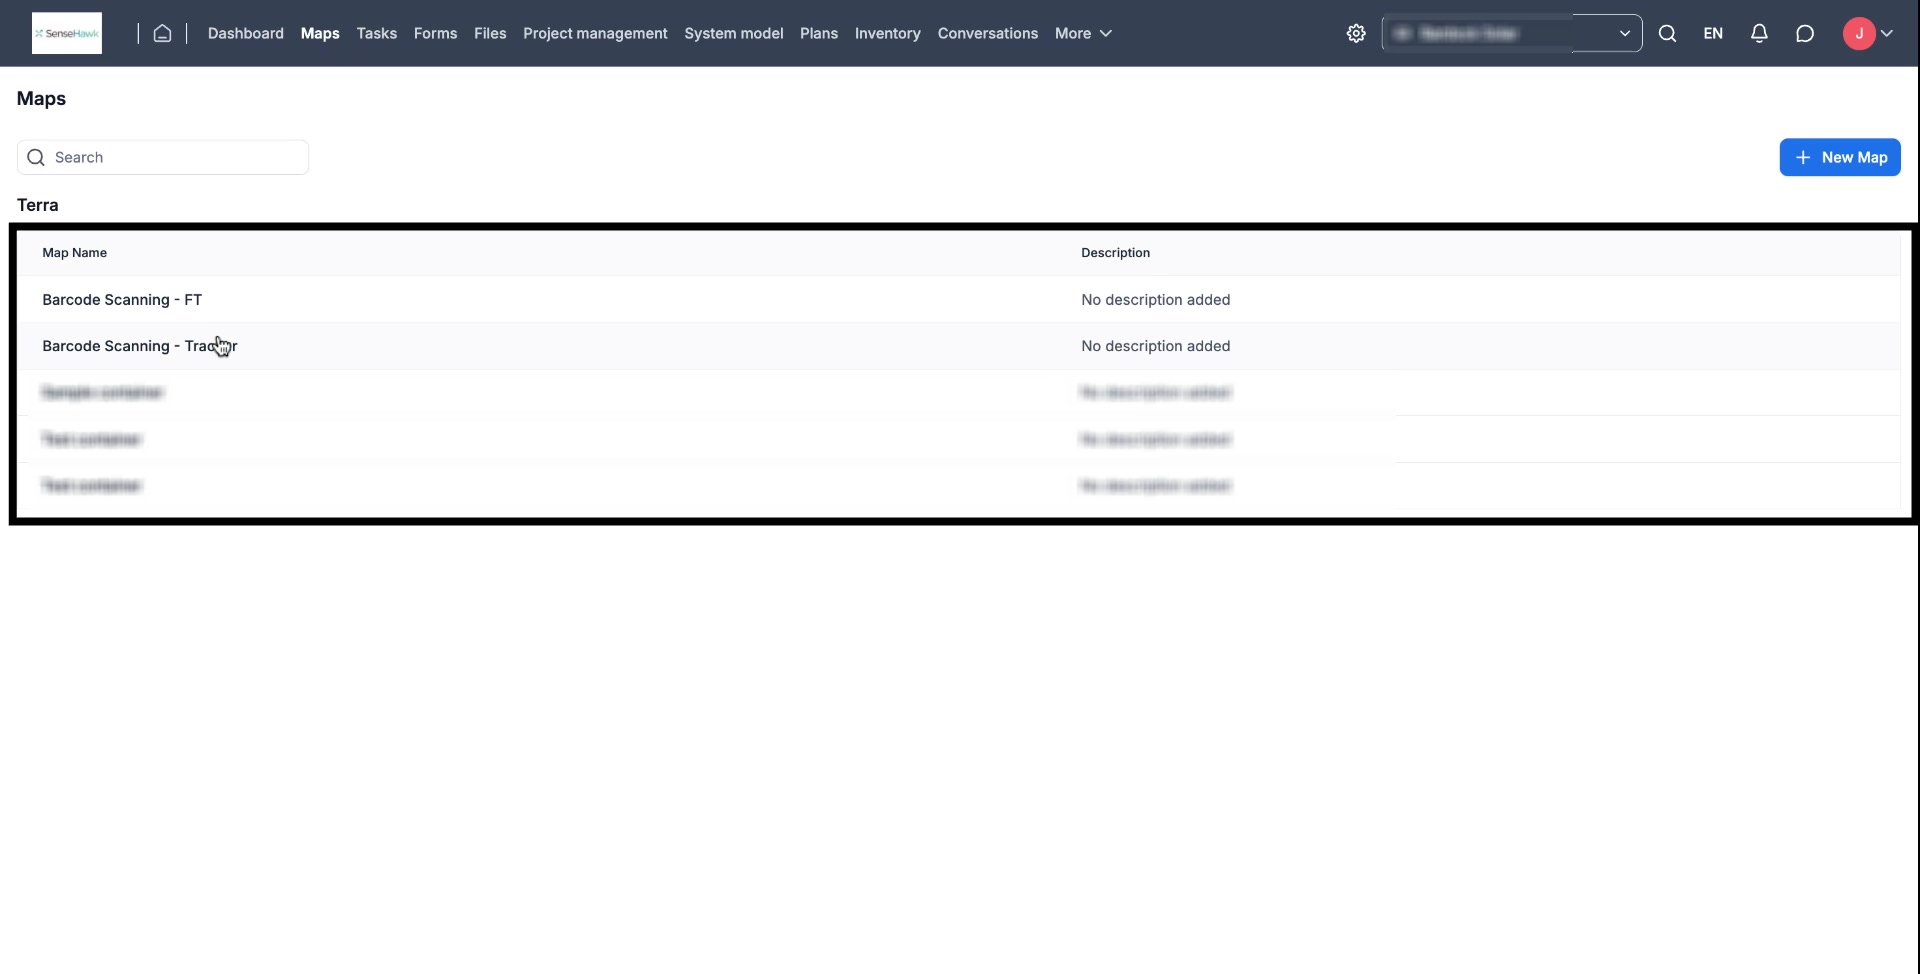
- Switch to the "Maps" tab from the navigation bar to view the maps
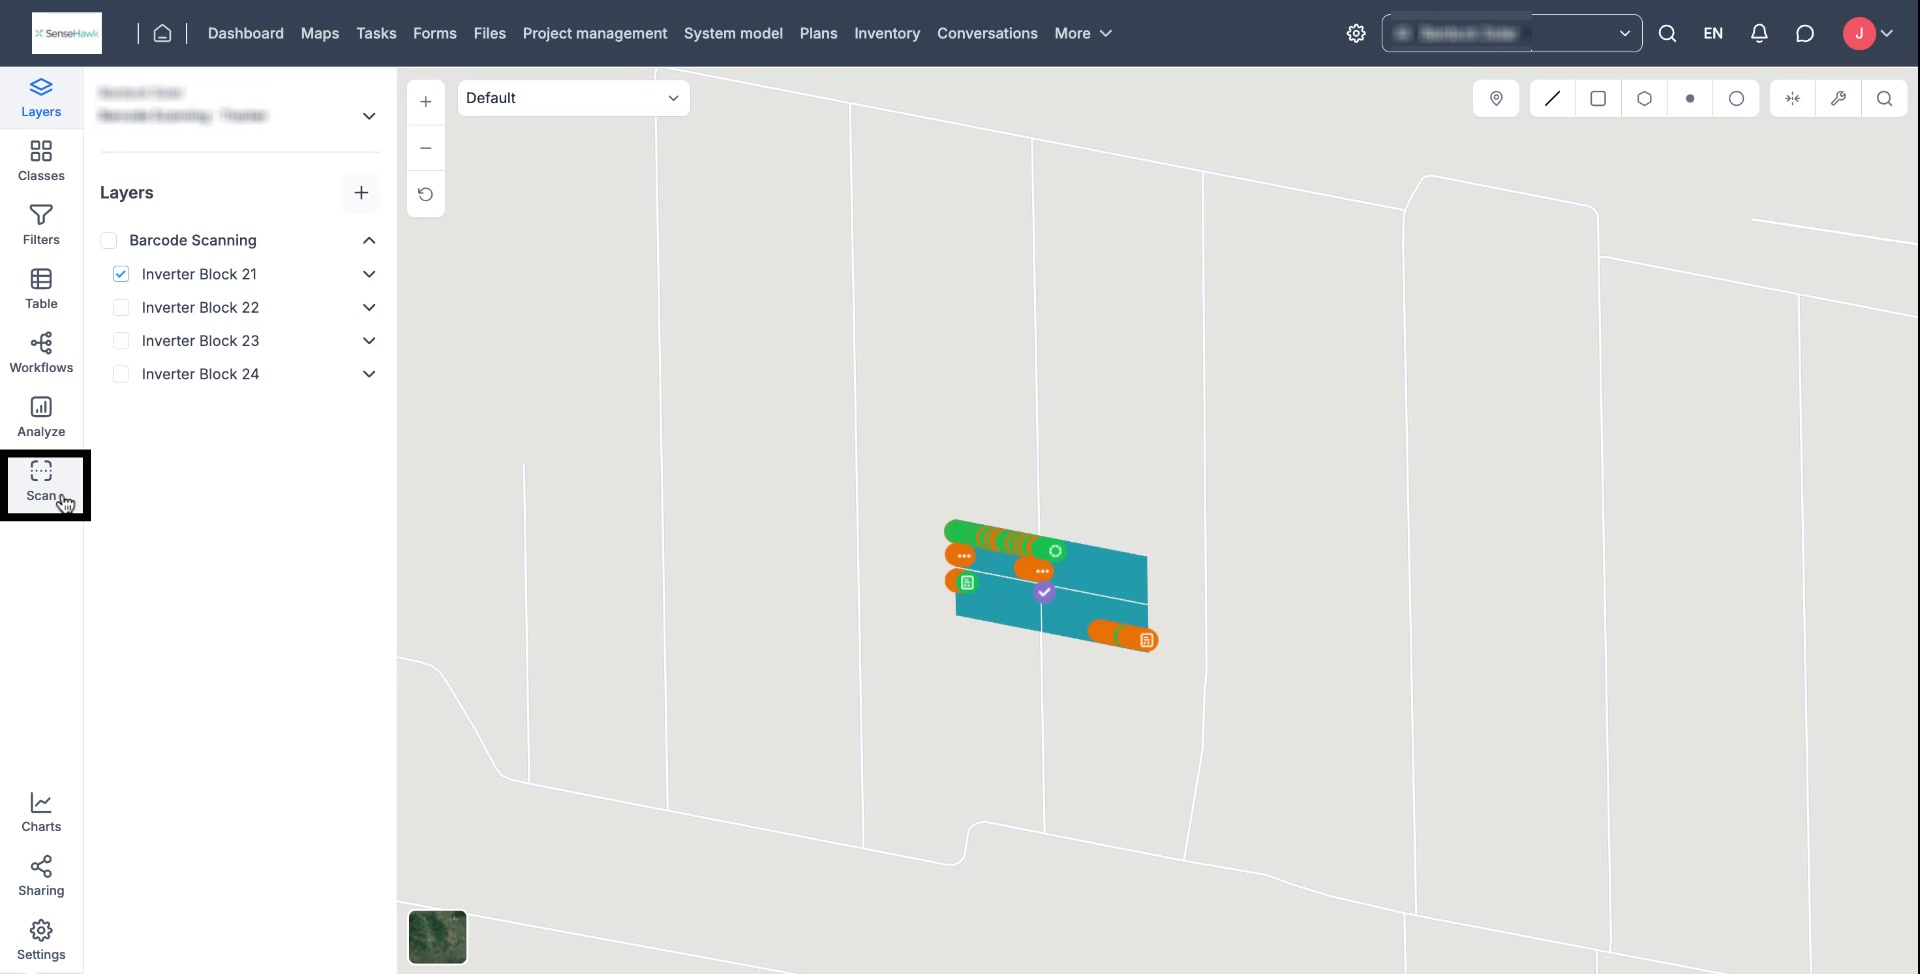
- Click on 'Scan' to view the dashbaord
- Click on the 'Export data' button to download the scanned details.
- Click on the 'Download table' button to download the dashboard data as shown in the Scan page.
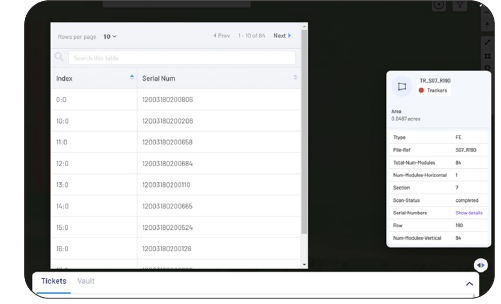
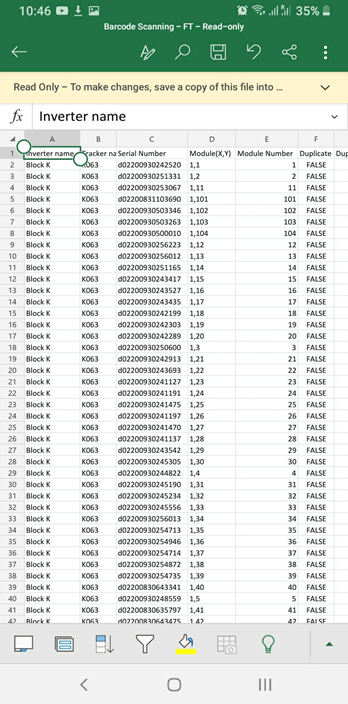
The Barcode Lists for all components will be serialized and available for download in CSV format from the download button on the 'Reports' page. The file can be easily viewed on any smartphone device.
FIGURE 11: SAMPLE REPORT IN CSV FORMAT
FIGURE 12: SAMPLE REPORT MOBILE VIEW


