Drone Analytics
Last updated December 18, 2024
TABLE OF CONTENTS
- Maps FAQ How to perform volume calculations? How to perform elevation calculations? How to add tasks or forms to the map? How to enable or disable zooming into the new map when switching between maps (toggle fly)? How to enable or disable labels? How to toggle visibility of tasks/ forms on the map? How to filter tasks/ forms that are visible on the map? How to filter vectors that are visible on the map by colour? How to filter vectors that are visible on the map by attribute? How to toggle map view between Street or Satellite? How to compare maps? How to edit a feature type?
Introduction To Drone analytics
Terra is a GIS, design automation, and data management platform enabling developers to manage multiple development projects and sites by providing preliminary site evaluation and topography options. Industry professionals can use Terra to transform real work scenarios into digital assets by capturing, analyzing, and visualizing their project environment on a map-based interface.
Key Concepts & Methodology
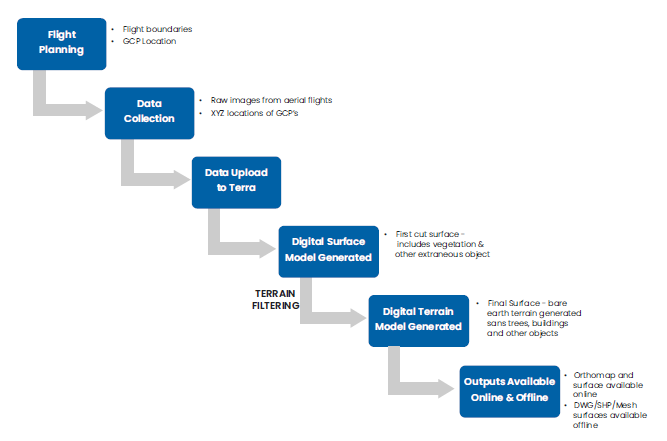
Below are the steps followed while using Maps to reduce the complexity of terrain analysis.
Overview of the process
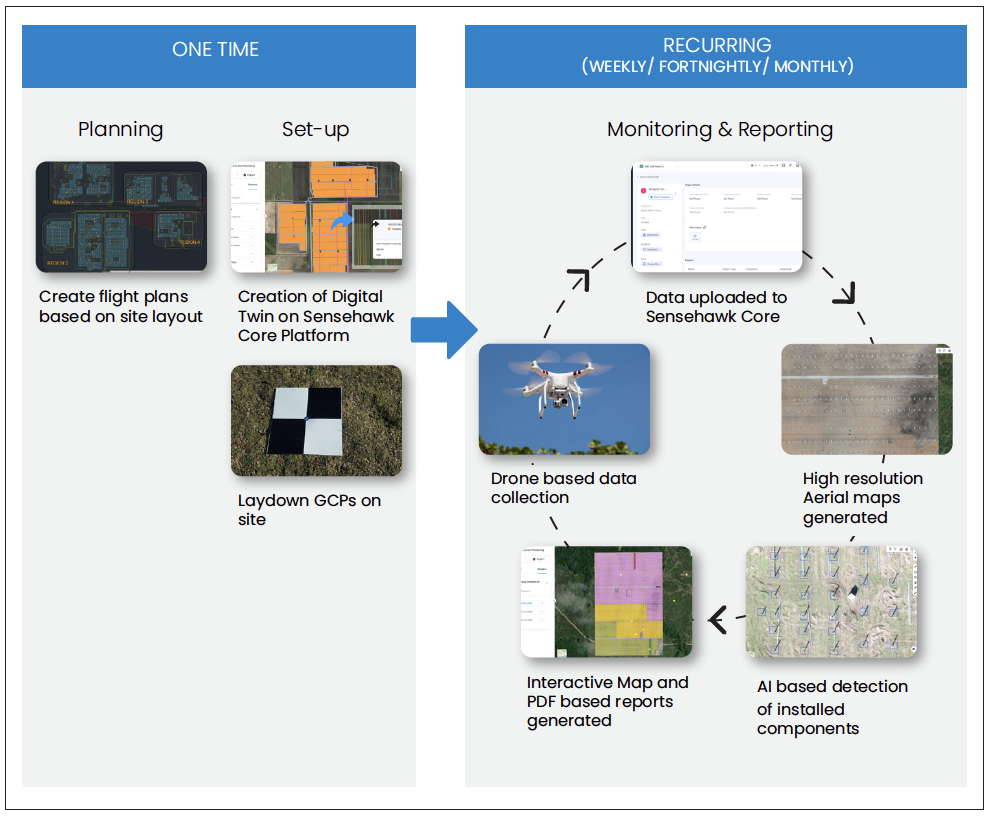
With TaskMapper, the complexity of the construction monitoring process is reduced. Below are the steps that will be followed:
Planning
Creation of Flight Plans:
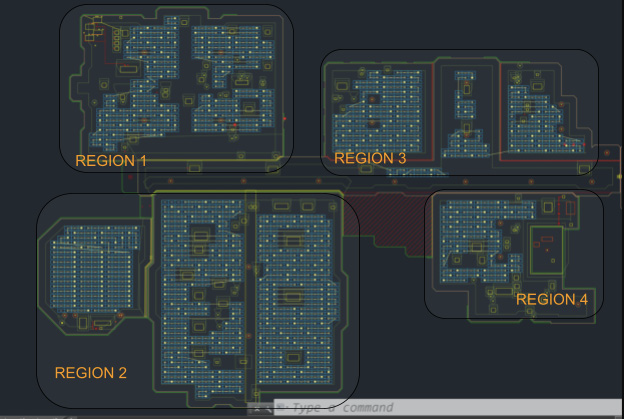
As a first step, the CAD Layout of the site is examined and used to create flight plans. The flight plans will be based on the staging schedule and construction regions being adopted by the EPC. Each construction region may comprise multiple inverter blocks - the construction schedule may be used to finalize these region boundaries.
Below is a sample layout divided into multiple regions - these region boundaries are used to draw up the flight plans.
Drone-Based Data Collection
Once GCPs are laid out on the site, drone flights may commence. Flights are scheduled for each region based on client requirements. For instance, when site activity is minimal at the beginning of construction, drone flights may be scheduled once a month; as activity picks up at later stages, drone flights may be scheduled every week or more often.
A drone pilot (from SenseHawk or from the Client) will perform semi-autonomous drone flights over the region of interest. These flights will be conducted with the following parameters:
| Drone used | DJI Phantom 4 Pro or equivalent |
| Aerial Imagery Resolution | 3.2 cm per pixel |
| Plant size covered in a single day | 400 MW |
Data uploaded to the platform:
Once data collection is complete, the pilot will upload the aerial imagery to the application.
High Res Aerial Maps generated through Terra Processing:
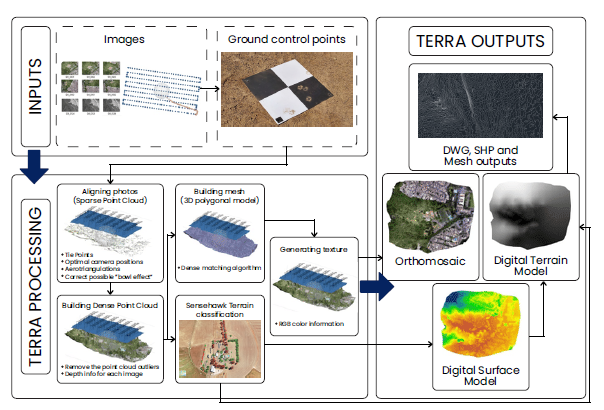
Once the aerial images are uploaded, high-accuracy maps are generated through a process known as photogrammetry. A high-level overview of this process is shown below. While the process yields a super-high resolution 3D model, in addition to the aerial map (orthomosaic), we will only use the orthomosaic for monitoring purposes. In the next section, We highlighted some use cases of the 3D terrain models, mainly when earthwork activities occur at the beginning of construction.
FIGURE 1: OVERVIEW OF THE PHOTOGRAMMETRY PROCESS
With the help of RTK (real-time kinematic) equipped drones and adequate ground control, 3D surfaces generated by this method will have accuracies of up to +/- 1 cm (0.4 inches). In most cases, the accuracy levels exceed those obtained from traditional methods like LiDAR.
Additionally, TaskMapper's proprietary terrain filtering process removes extraneous objects such as vegetation, buildings, farm machinery, and so on from the surface model, giving an accurate picture of the bare-earth terrain.
FIGURE 2: OUR PROPRIETARY TERRAIN FILTERING ALGORITHM REMOVES EXTRANEOUS OBJECTS
SUCH AS TREES FROM THE SURFACE MODEL, GIVING YOU A TRUE PICTURE OF THE TERRAIN.
AI-based detection of installed components:
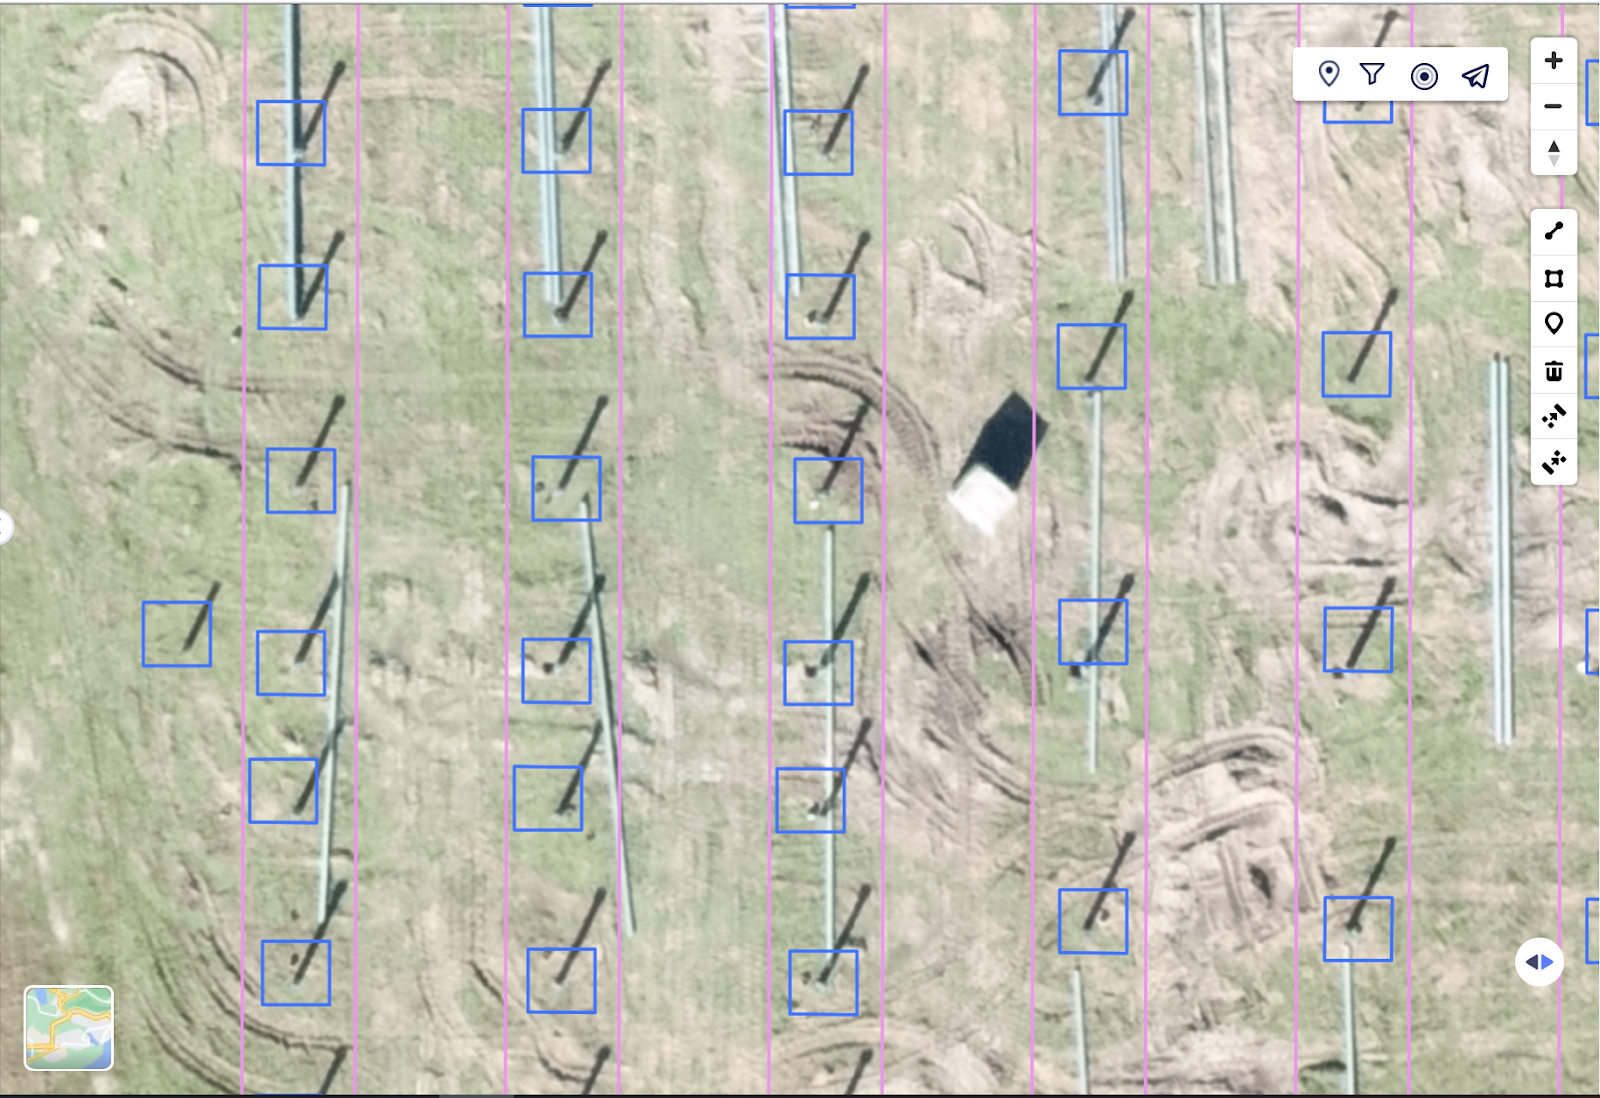
Once the high-resolution orthomosaic is generated, TaskMapper's proprietary ML-based detection algorithm identifies and classifies the various components installed on the site. For instance, in the below example, individual tracker post installations have been detected on the map:
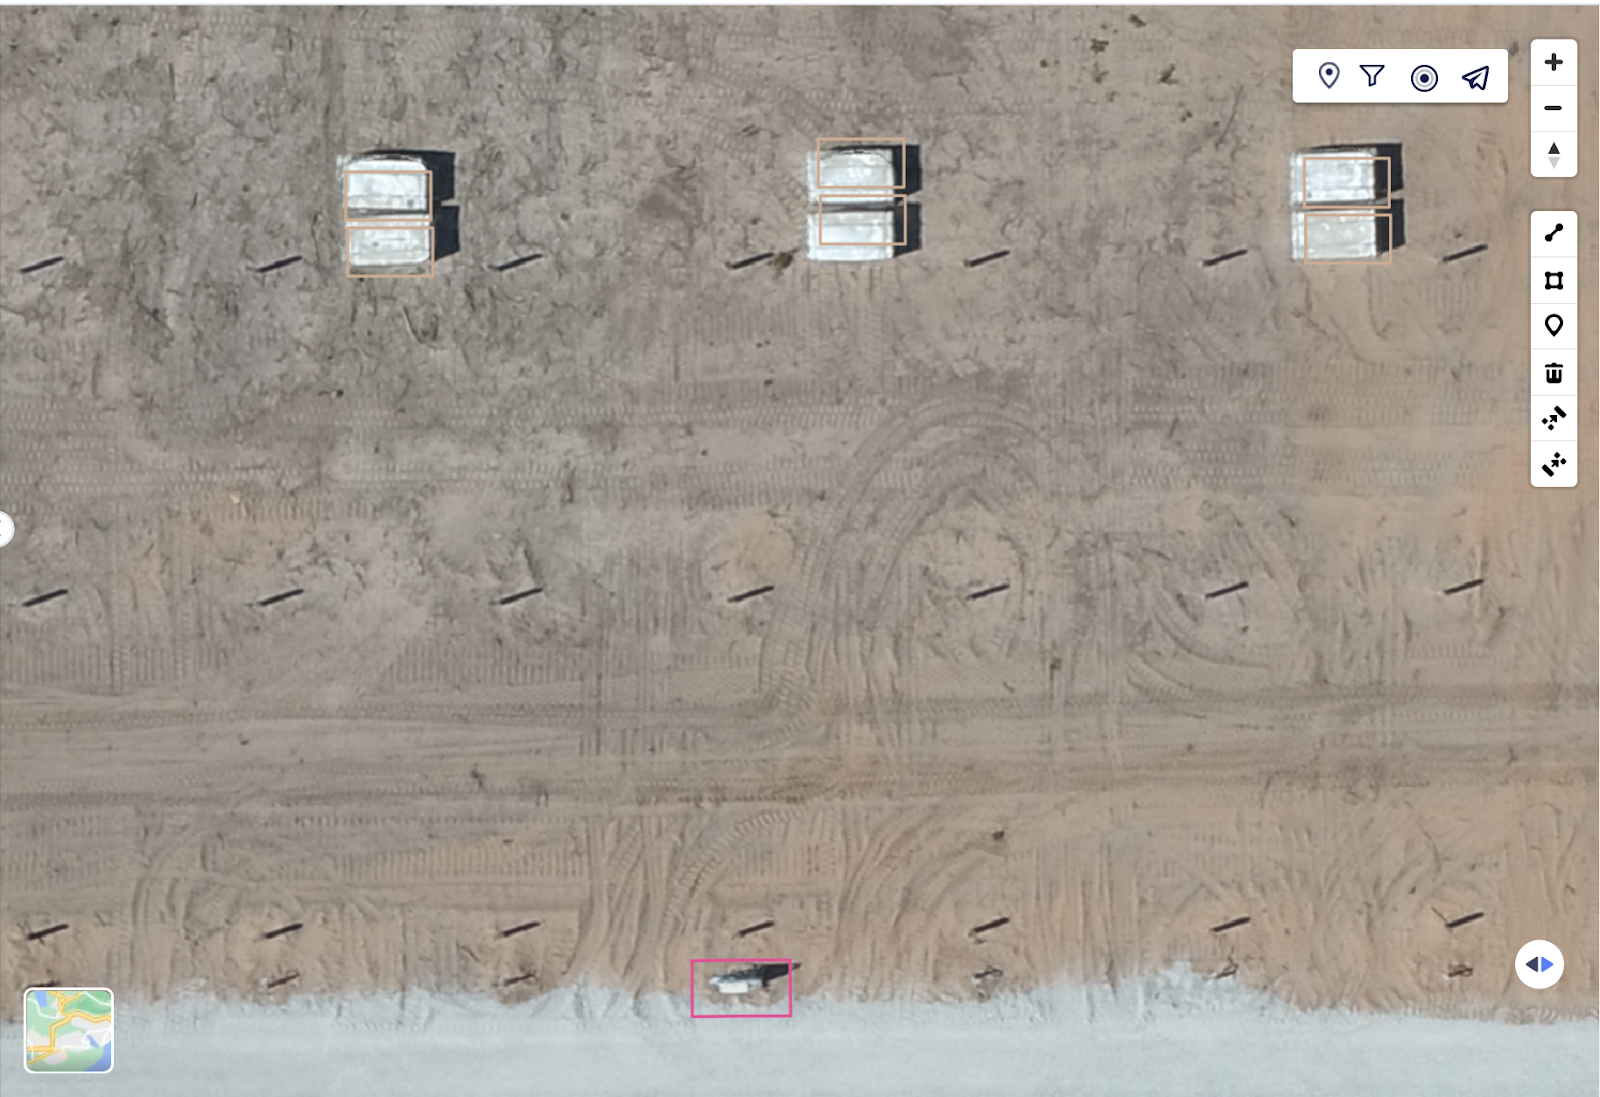
In the example below, combiner boxes and module pallets have been identified on the map.
Interactive Map-based and PDF reports generated:
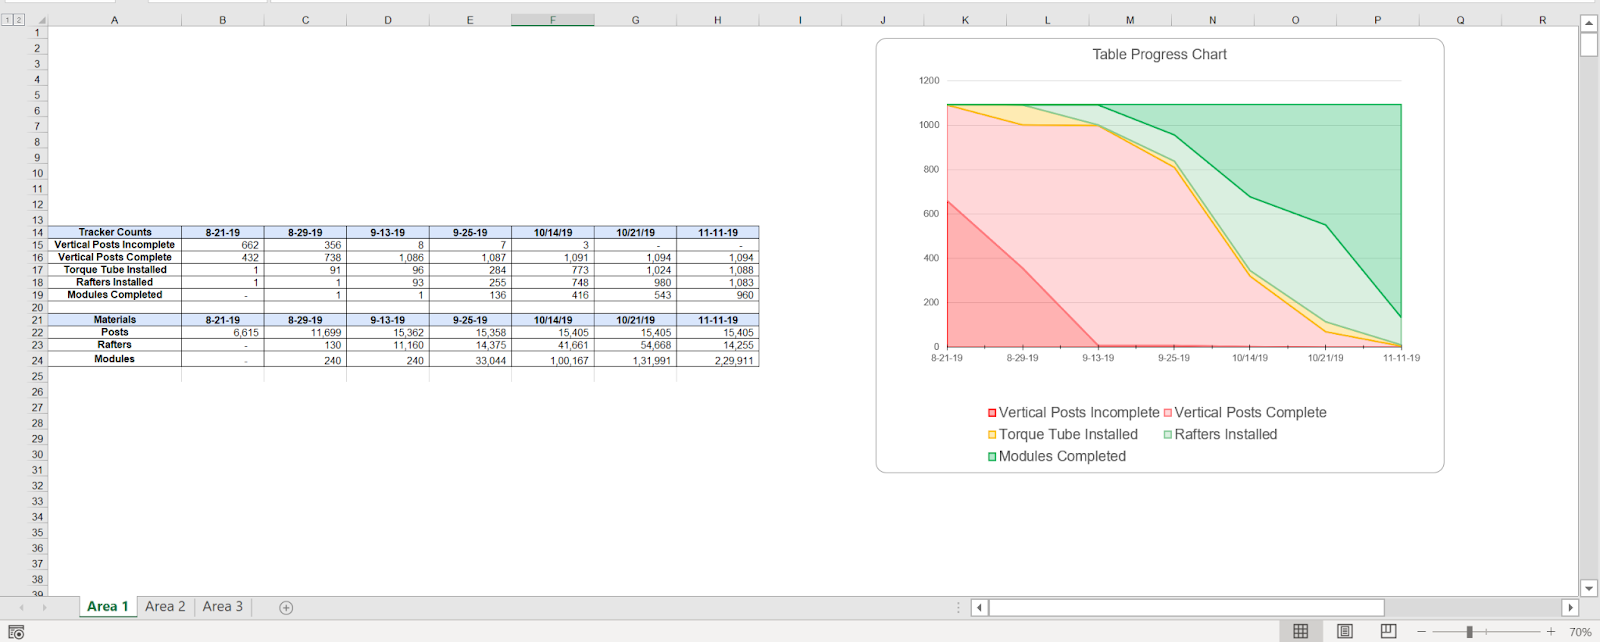
Once the components have been identified and counted, the data is fed into the plant's Digital Twin to provide an overview of the construction progress.
Information about the construction progress is available down to the component level - for instance, the Client will be able to query the construction progress of tracker number B02 R04 S14 (i.e. the 14th tracker in the 4th row of the 2nd block) of the above plant. Inverter or plant-level summary views can be easily exported to PDF or Excel.
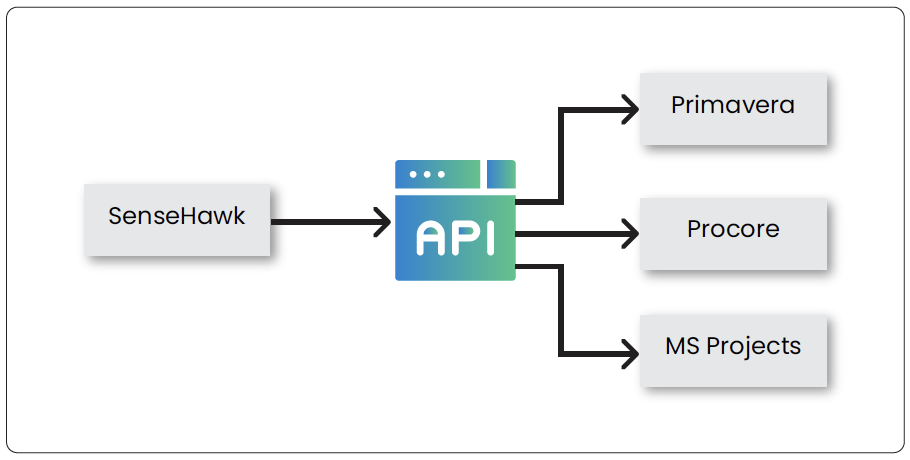
TaskMapper's open architecture allows for integrations and easy data export and import with third-party project management software such as Primavera, Procore, MS Projects, and so on. These integrations will be created for seamless data exchange.
Other Applications:
While Construction Monitoring used only the orthomosaic generated by the photogrammetry process, the other outputs (Digital Terrain Model, contour maps, and so on) can be used for a wide variety of different applications during construction:
Monitoring of Earthwork Progress:
In a typical solar project, earthwork is the first major activity before construction. This requires a lot of machinery time and cost, and it is very important to get it right the first time. Any deviations in cut-fill estimates will result in incorrect levels and design rework. Therefore, it is important to monitor earthwork progress to a high degree of accuracy.
TaskMapper maps platform helps you do just that. With up to +/-1cm (0.3 inches) accuracy, volumetric estimates made on TaskMapper platform allow you to estimate a site's exact cut/fill requirements with a high degree of certainty.
Hydrology Analysis:
The Digital Terrain Model can also be used to understand the site's hydrological characteristics. A survey conducted before earthwork starts may be used by design to position drainage points and correctly account for extreme flood events.
Topography
Components on maps
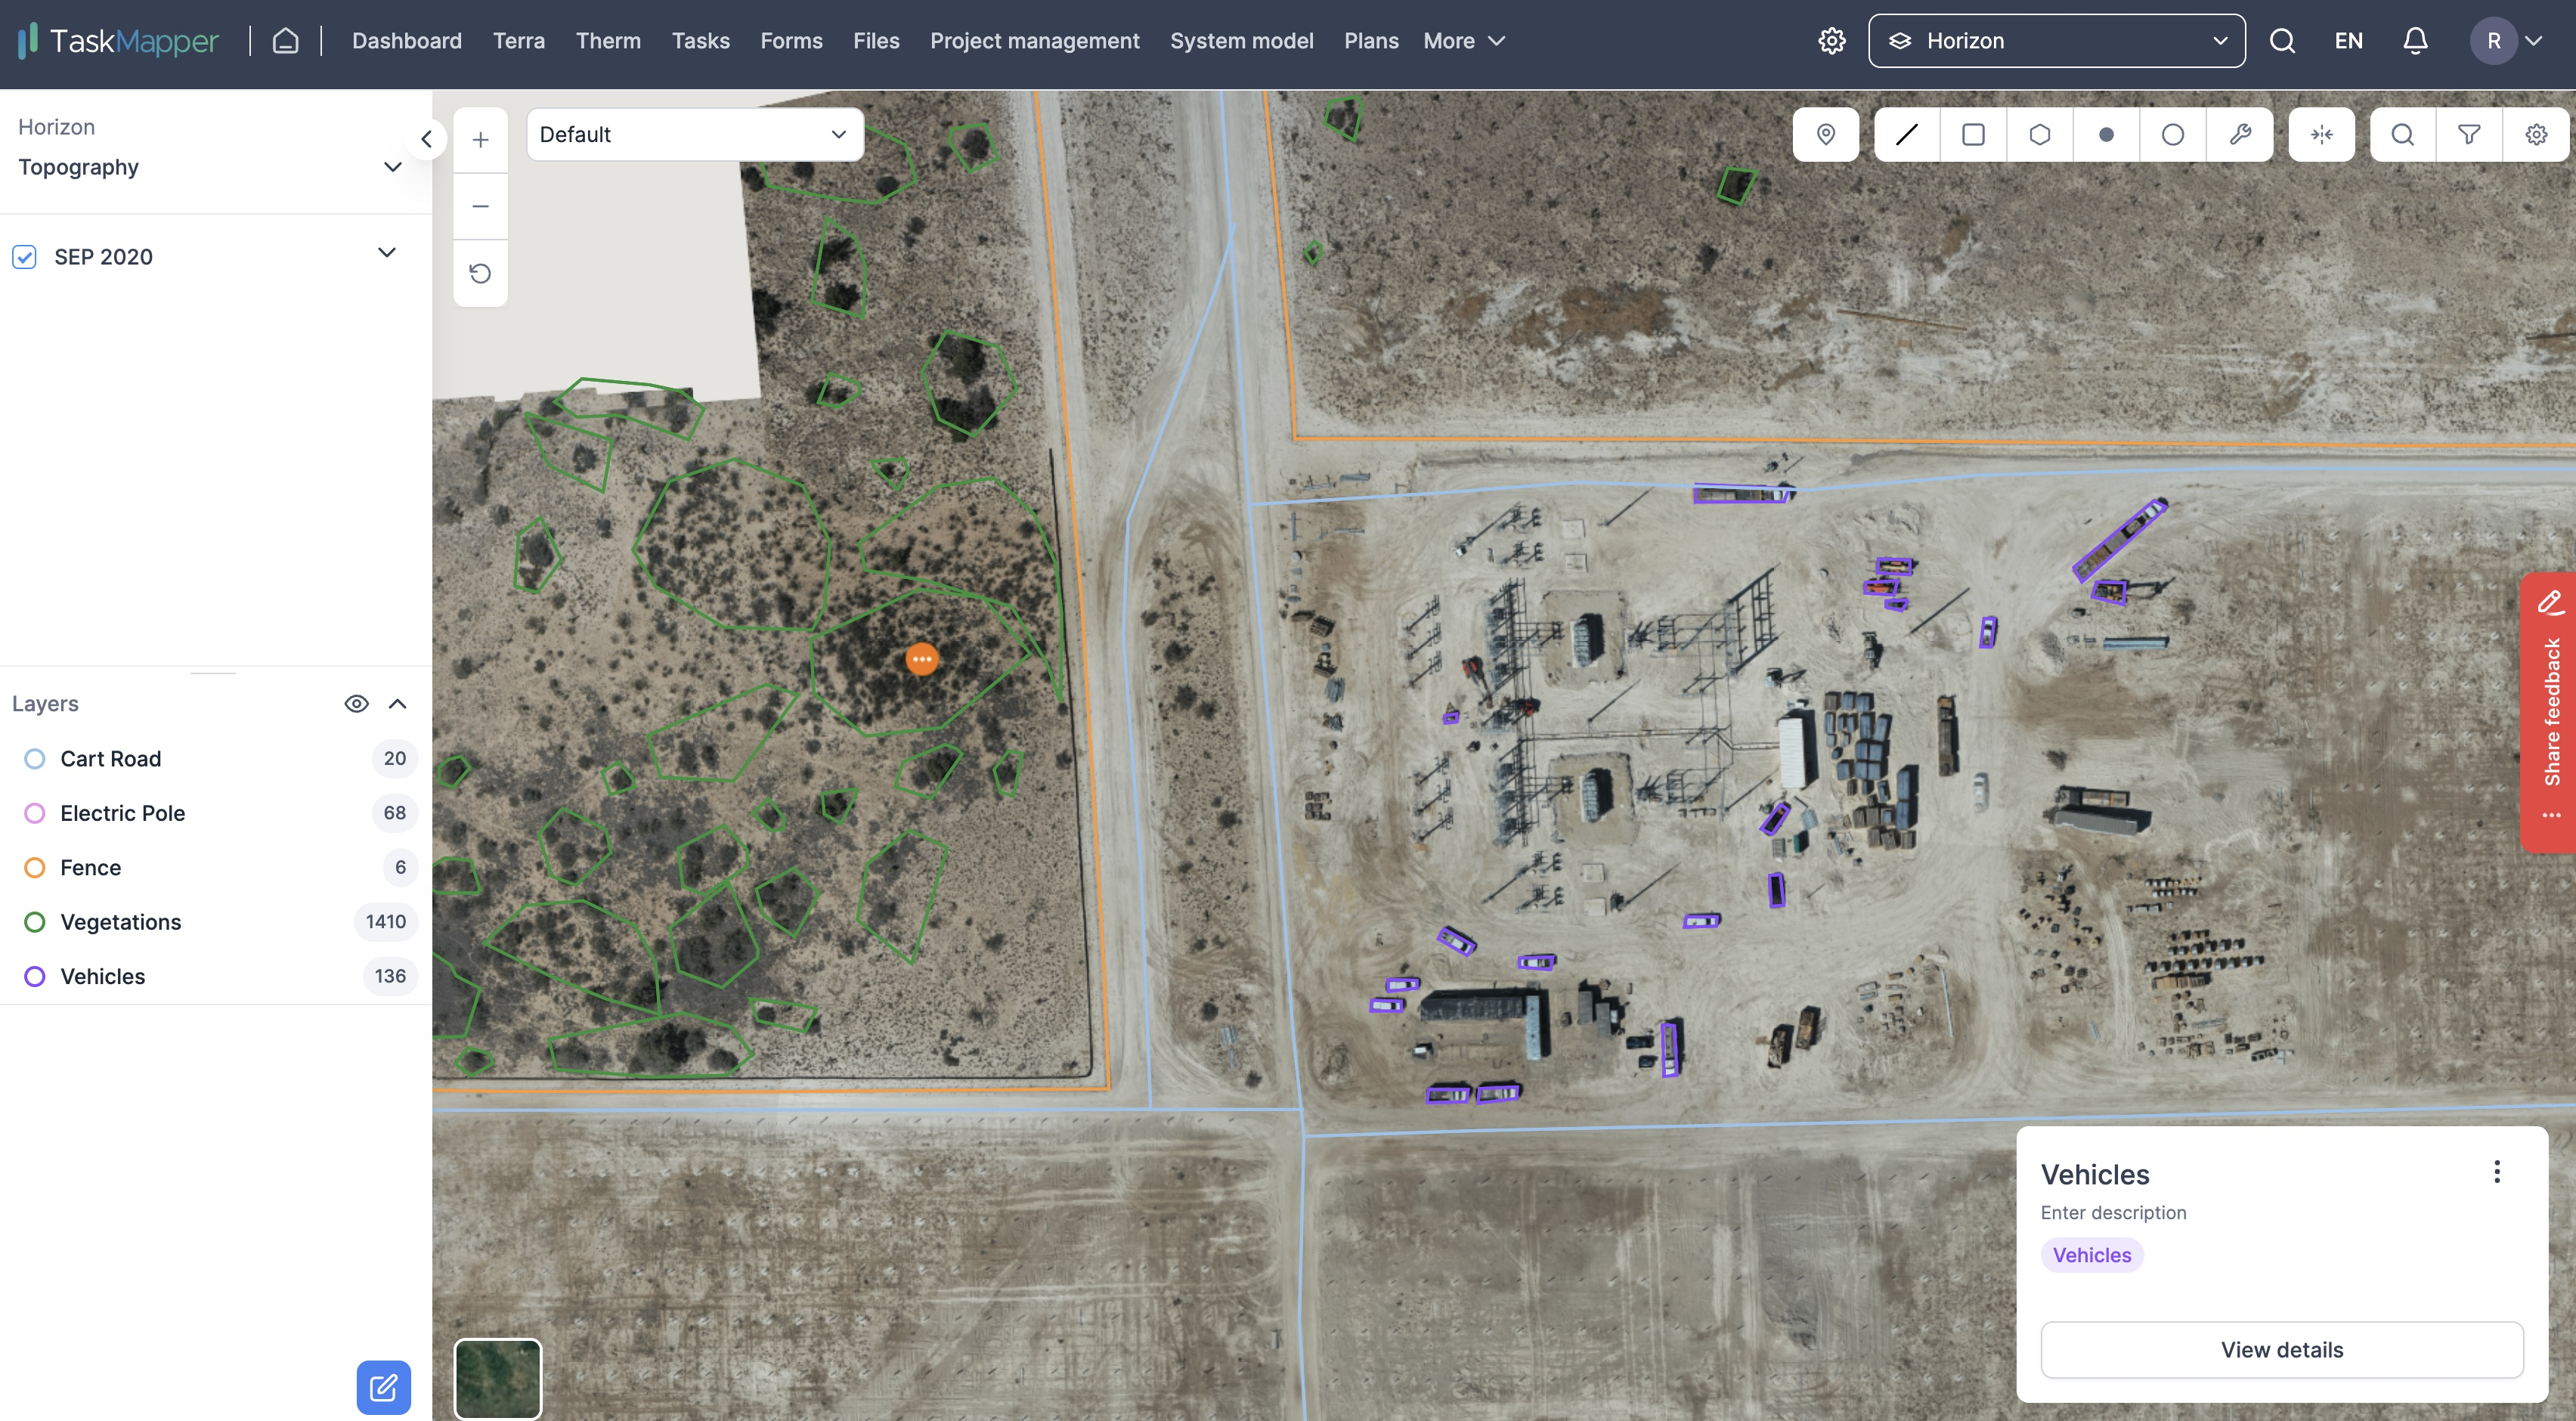
Each component relevant to operations is digitized and loaded onto the TaskMapper platform. Some of the layers that may be loaded onto the platform include:
- Tracker row layout
- Roads (internal and external)
- Perimeter Fences
- Cable Routes
- Laydown yards
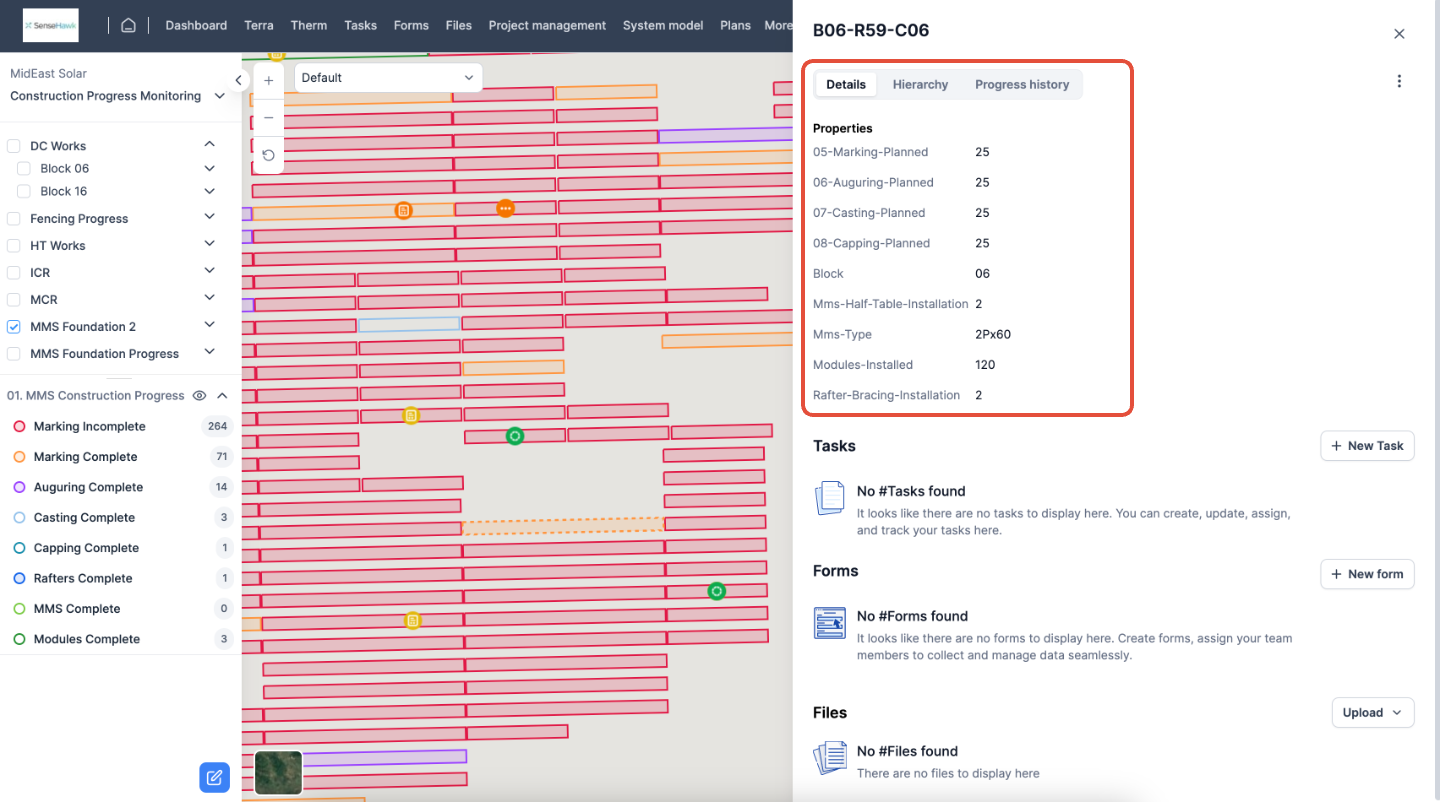
Each element on the digital twin may be assigned properties. For example, tracker rows may be provided with the following parameters:
- Tracker dimensions
- Vertical size
- Horizontal size
- Tracker named based on construction nomenclature (for instance: Block – Section – Row)
- Capacity in kW (enumerated from the tracker dimensions and module details)
- Module type used
- Physical and mechanical characteristics:
- Number of piles
- Wind load requirements
- Tolerances: max slope, pile depth requirements
Any level of detail may be captured on the digital twin in this way.
Measuring Elevation Profile
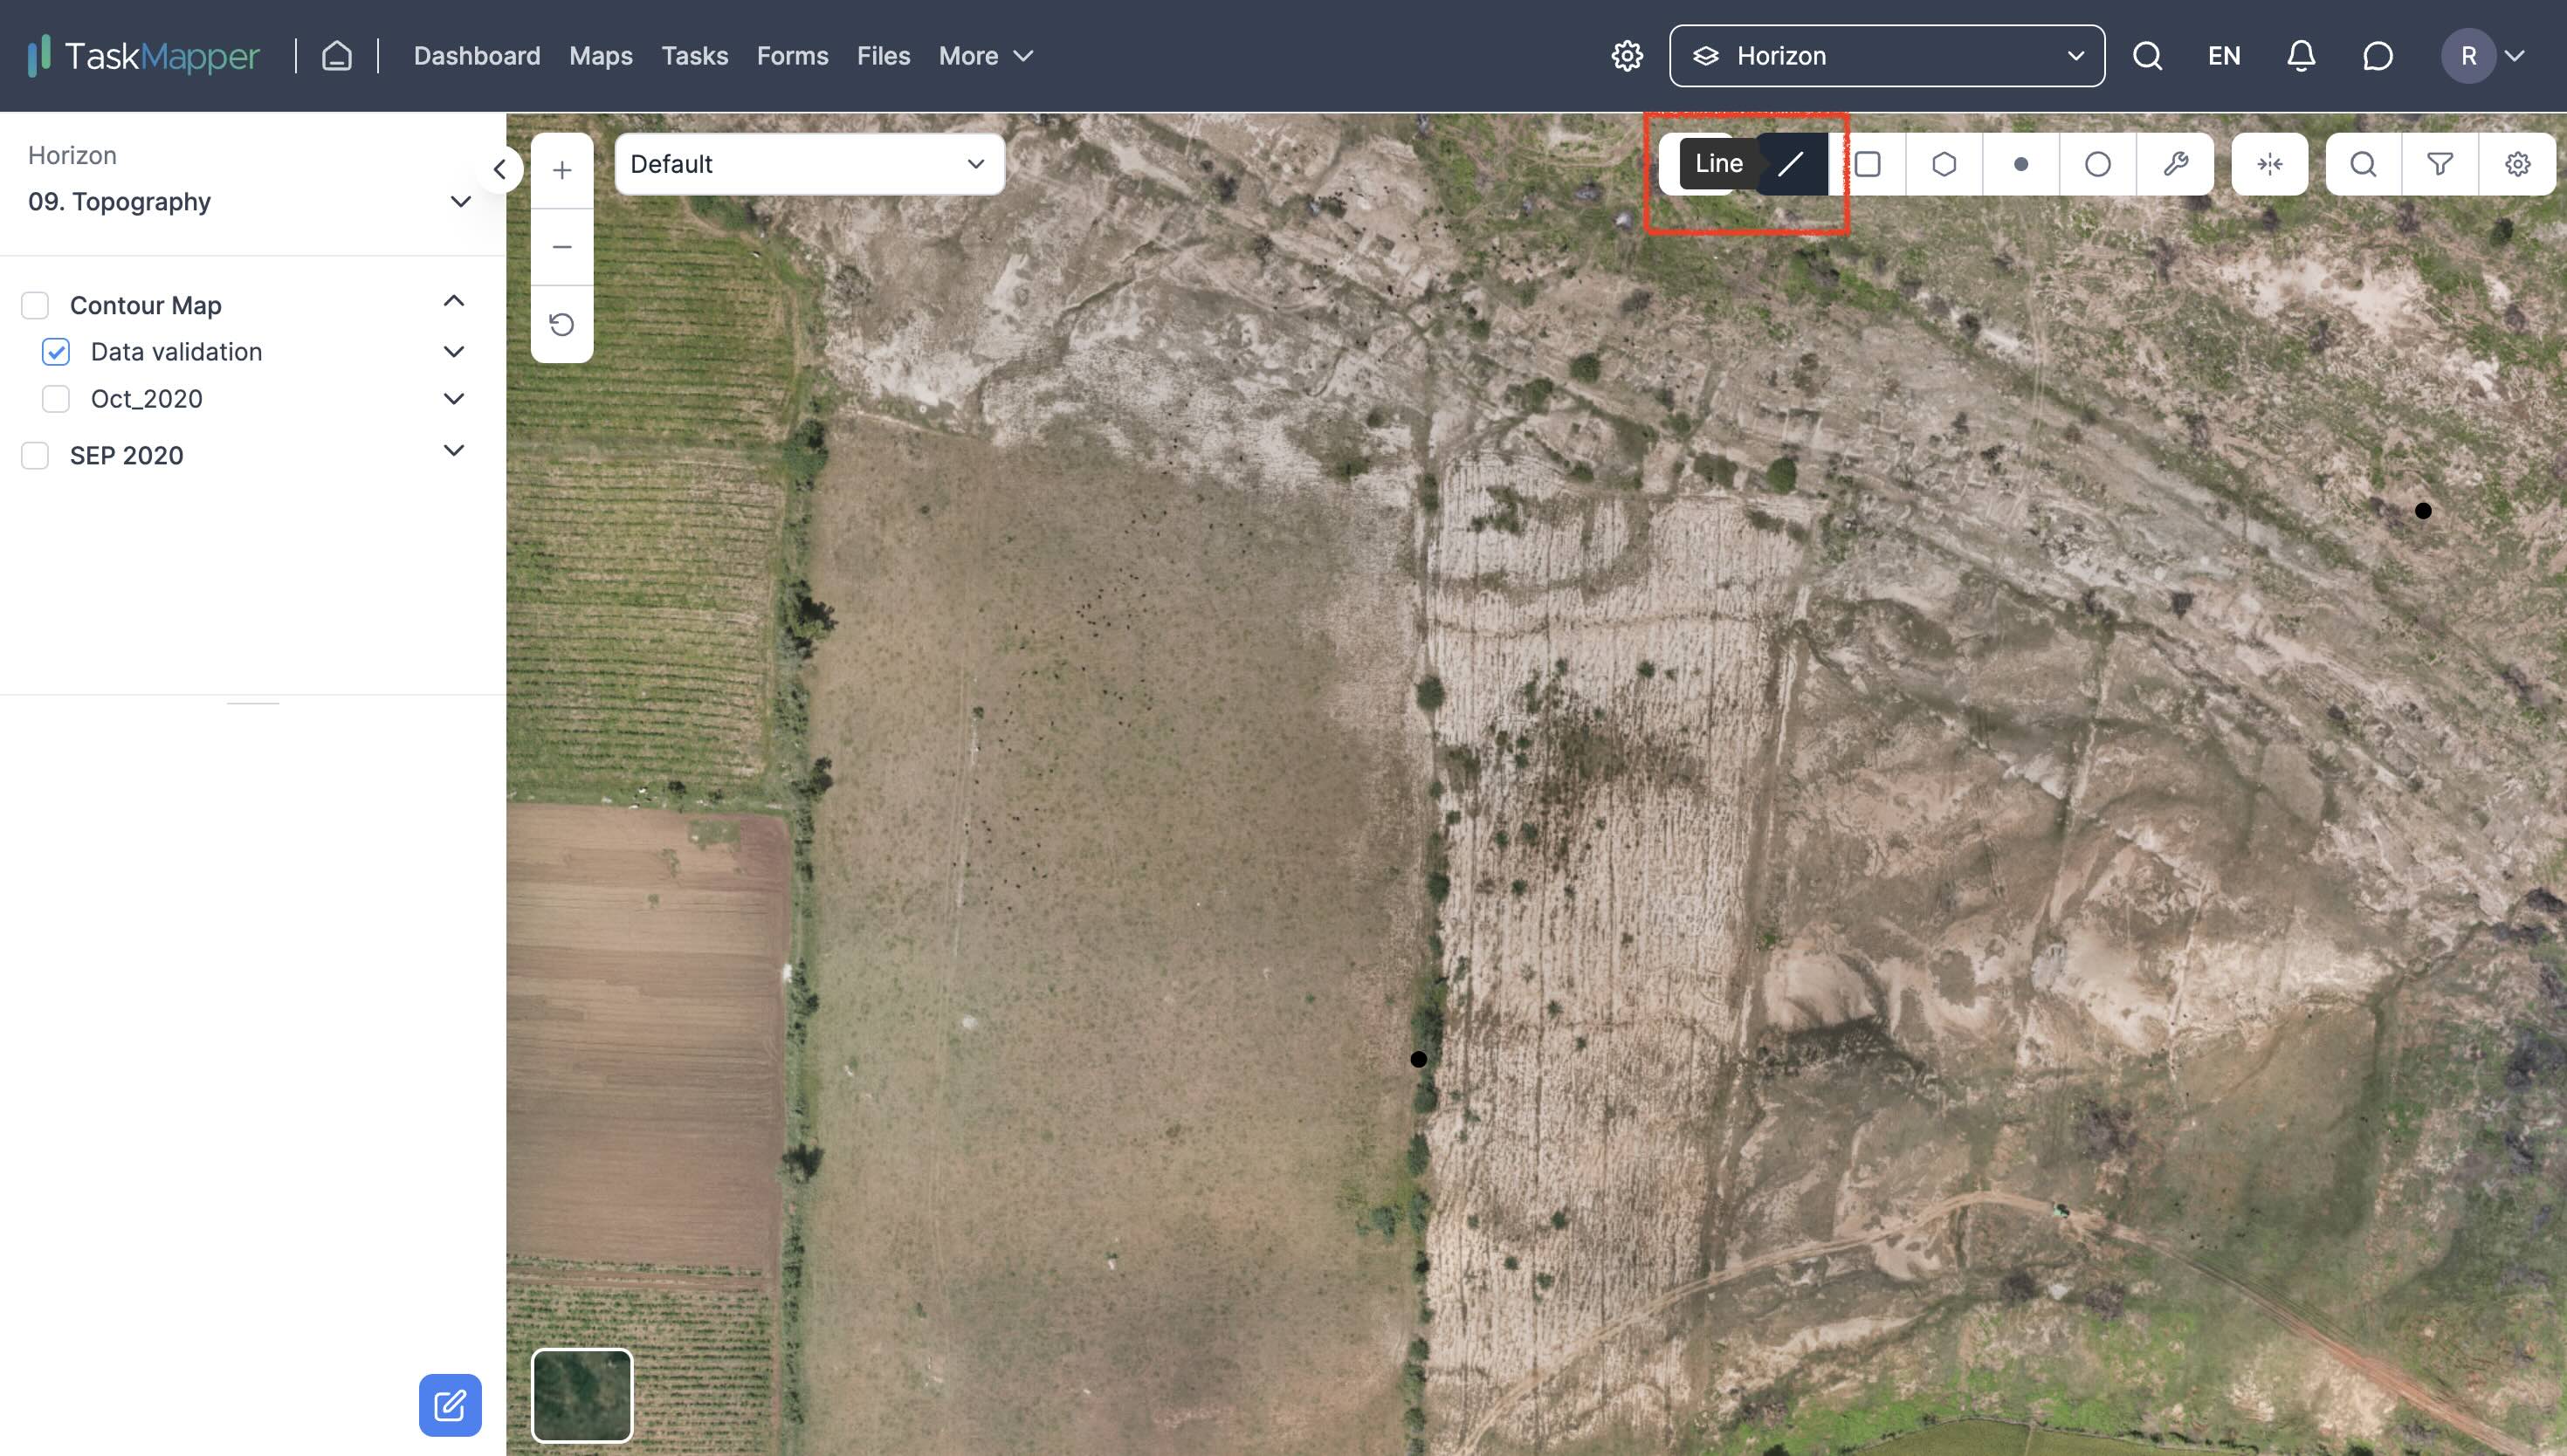
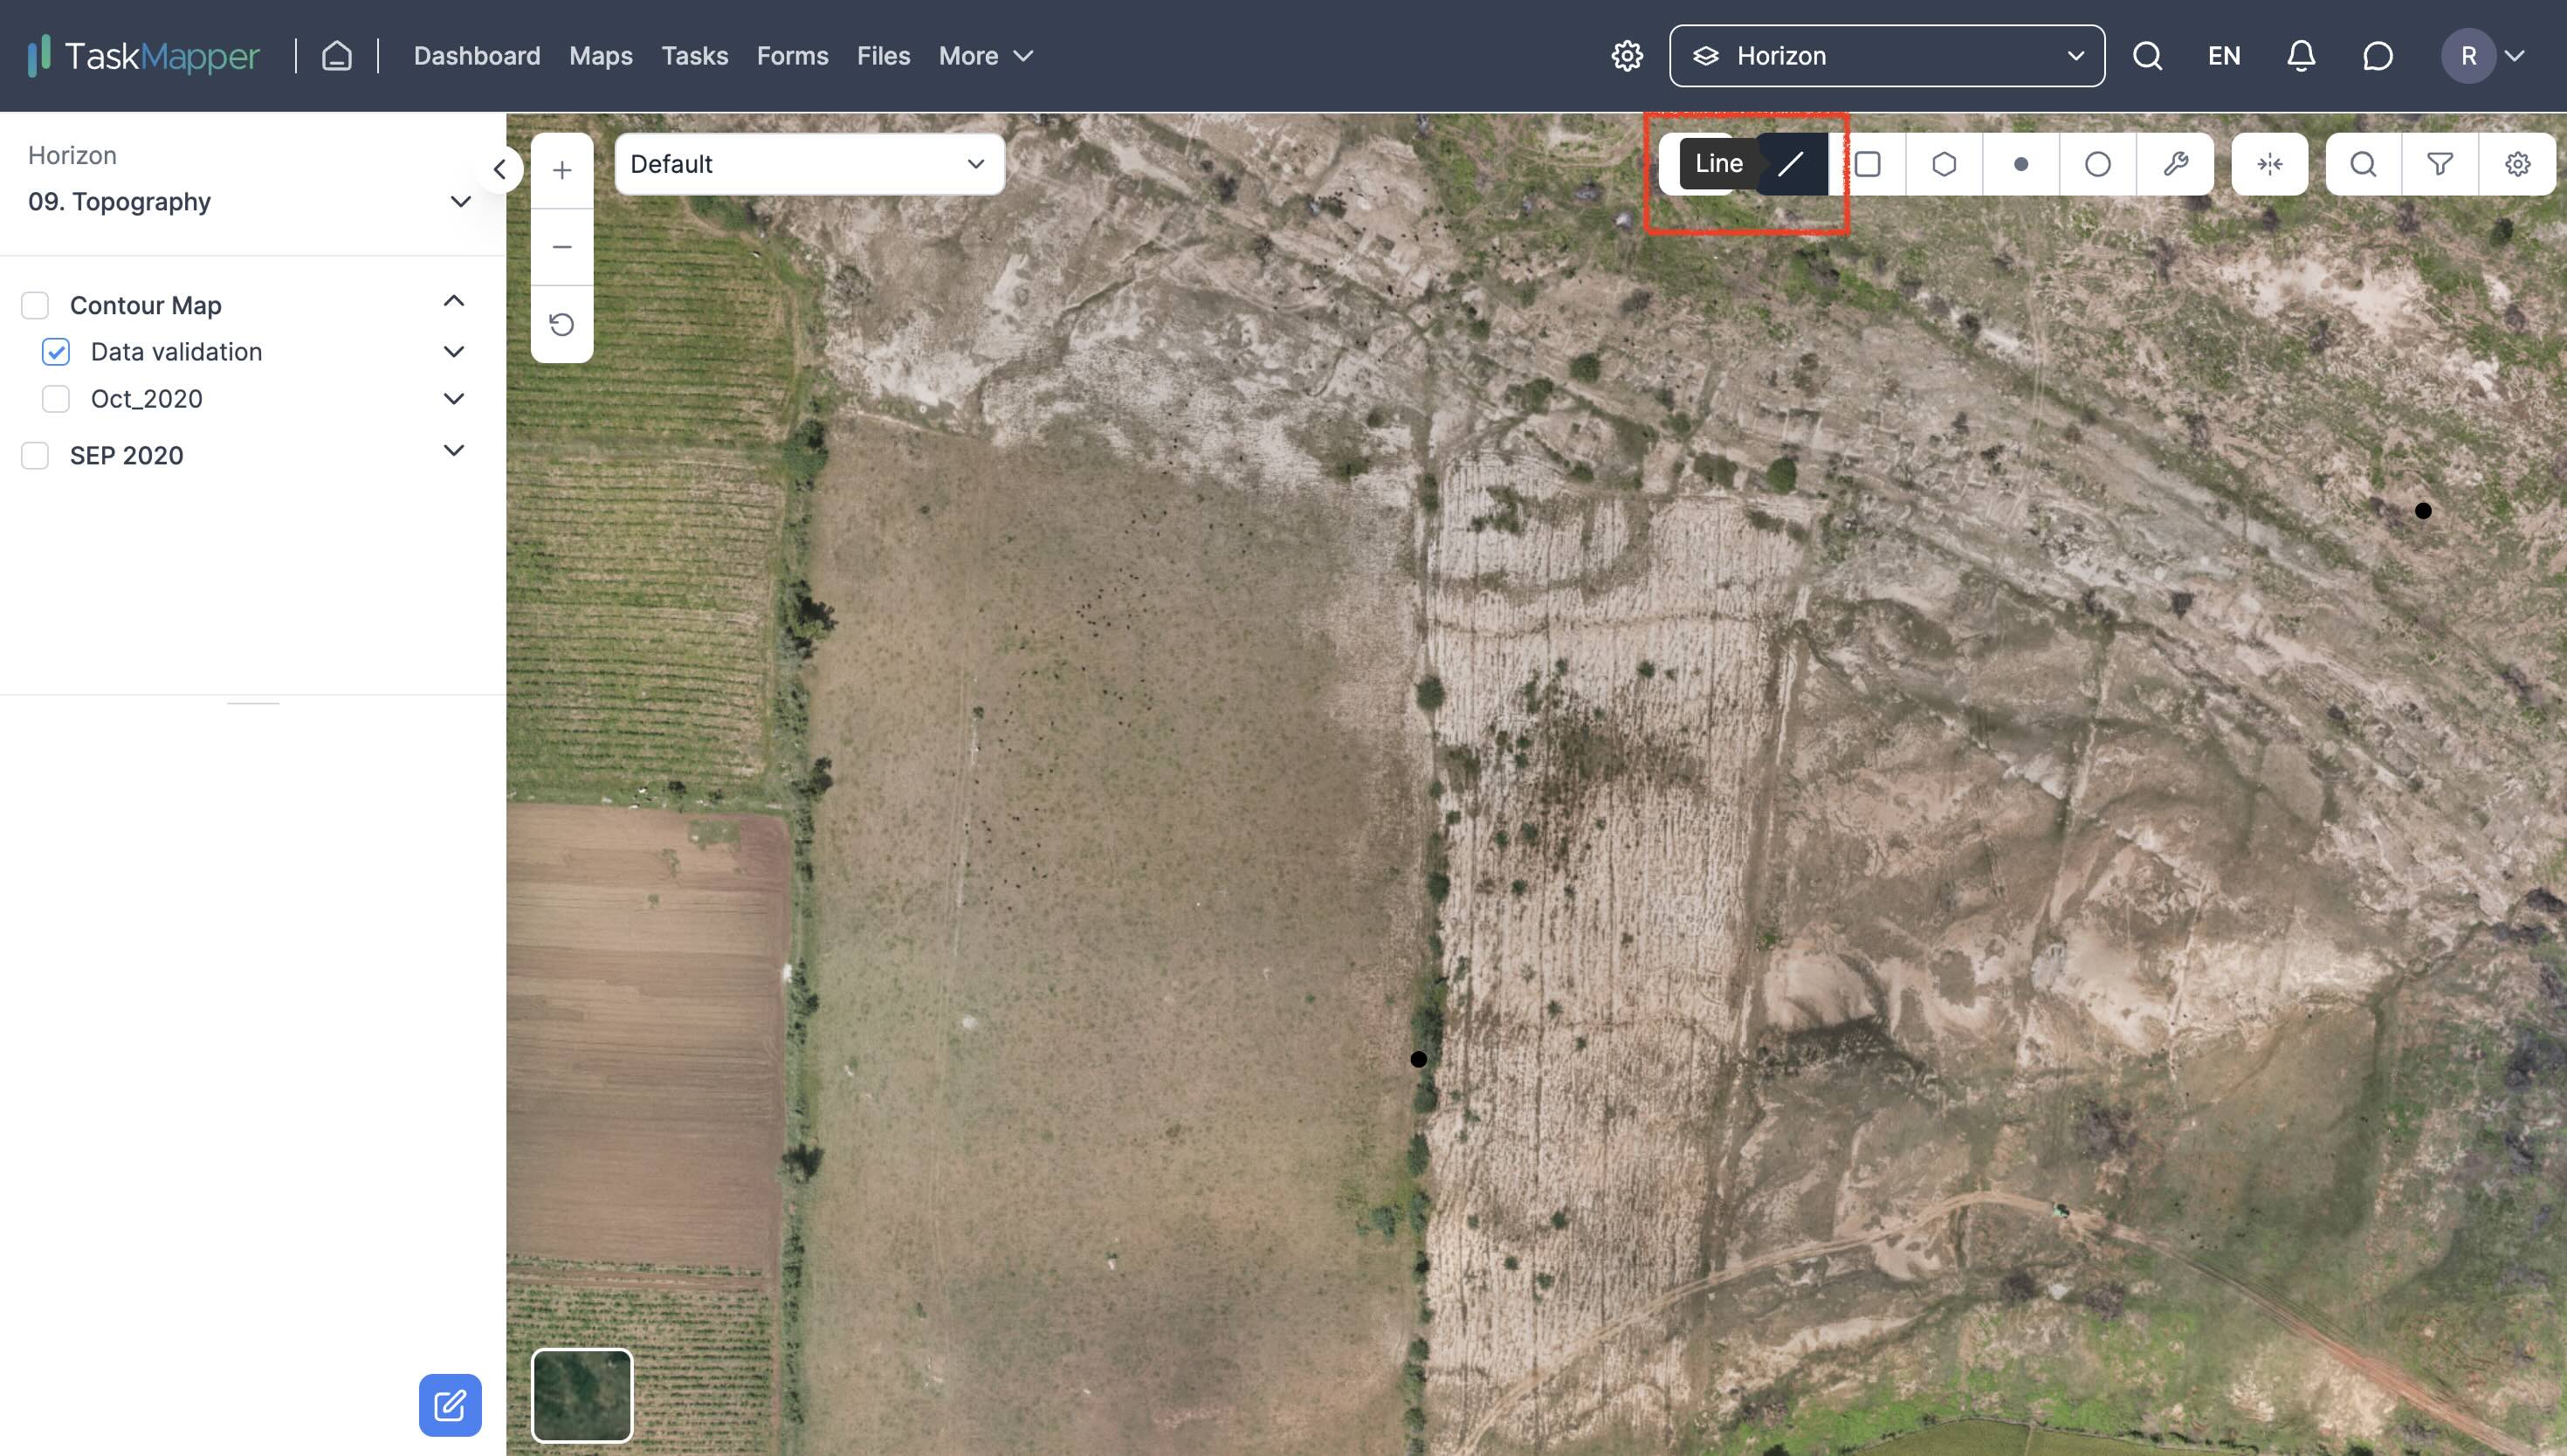
An elevation profile describes a two-dimensional, cross-sectional landscape view. It provides a side view of a terrain elevation along a line drawn between locations on the map.
FIGURE 3: LINE STRING TOOL
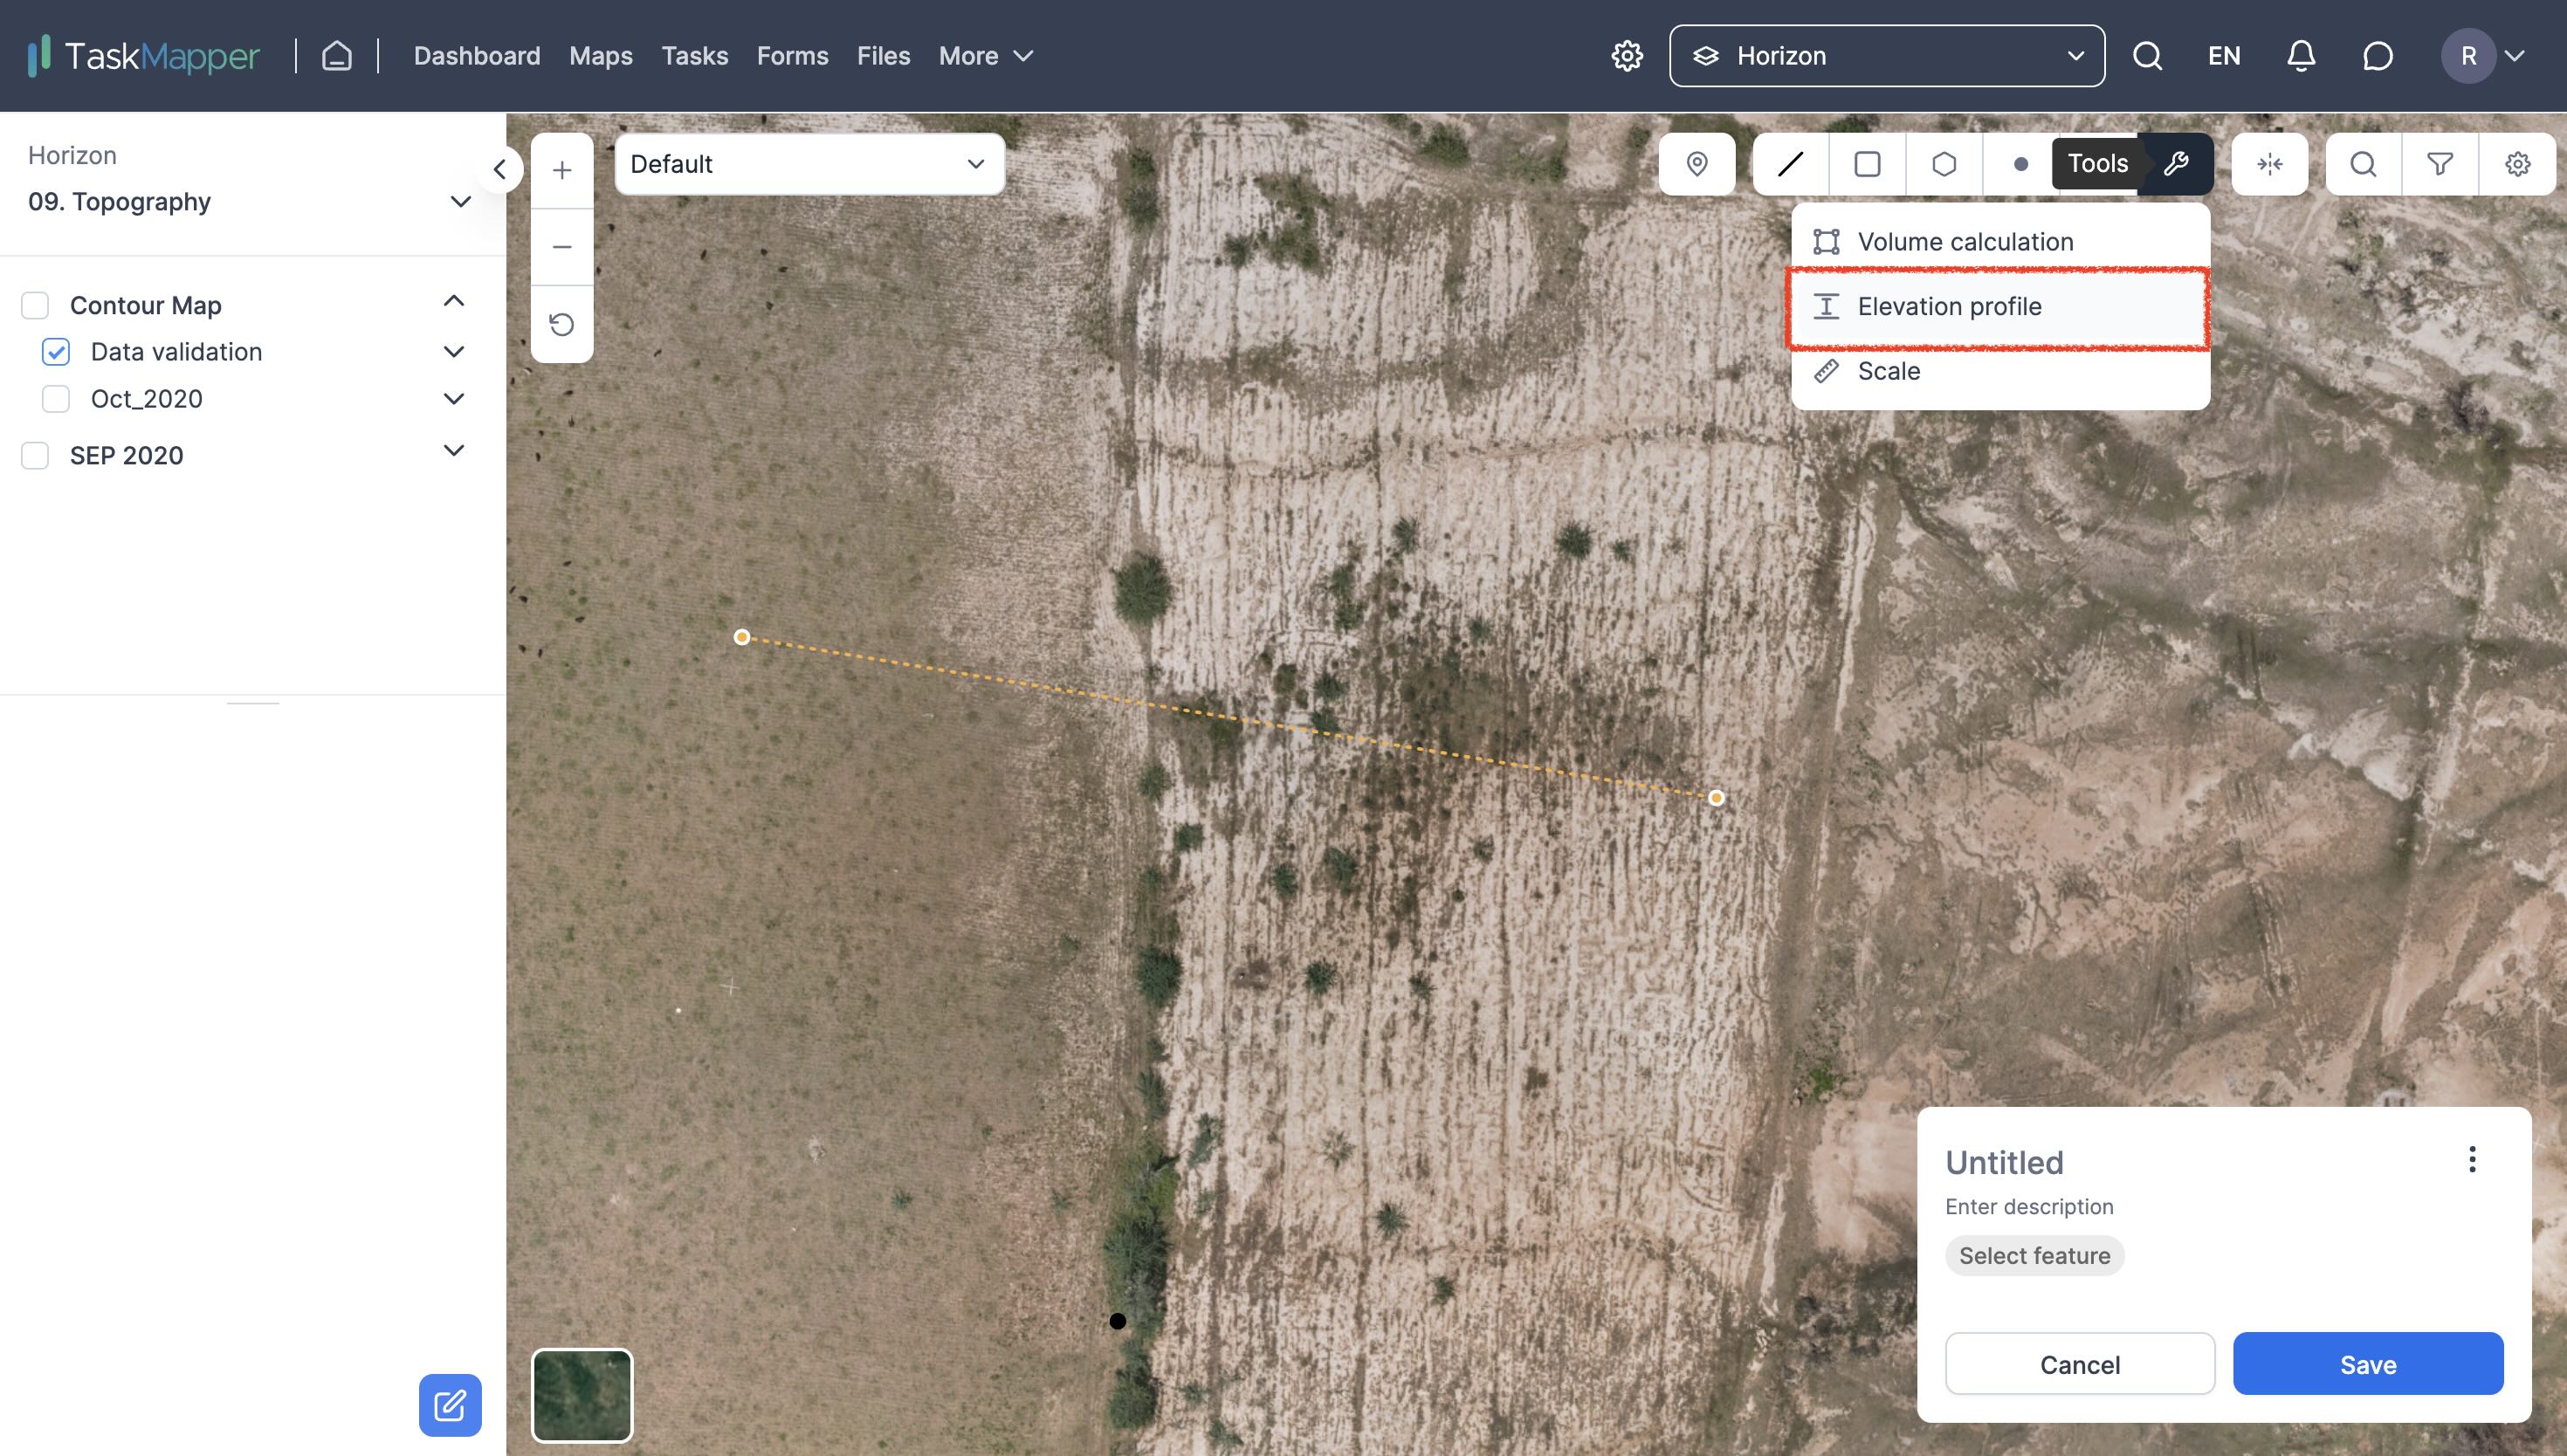
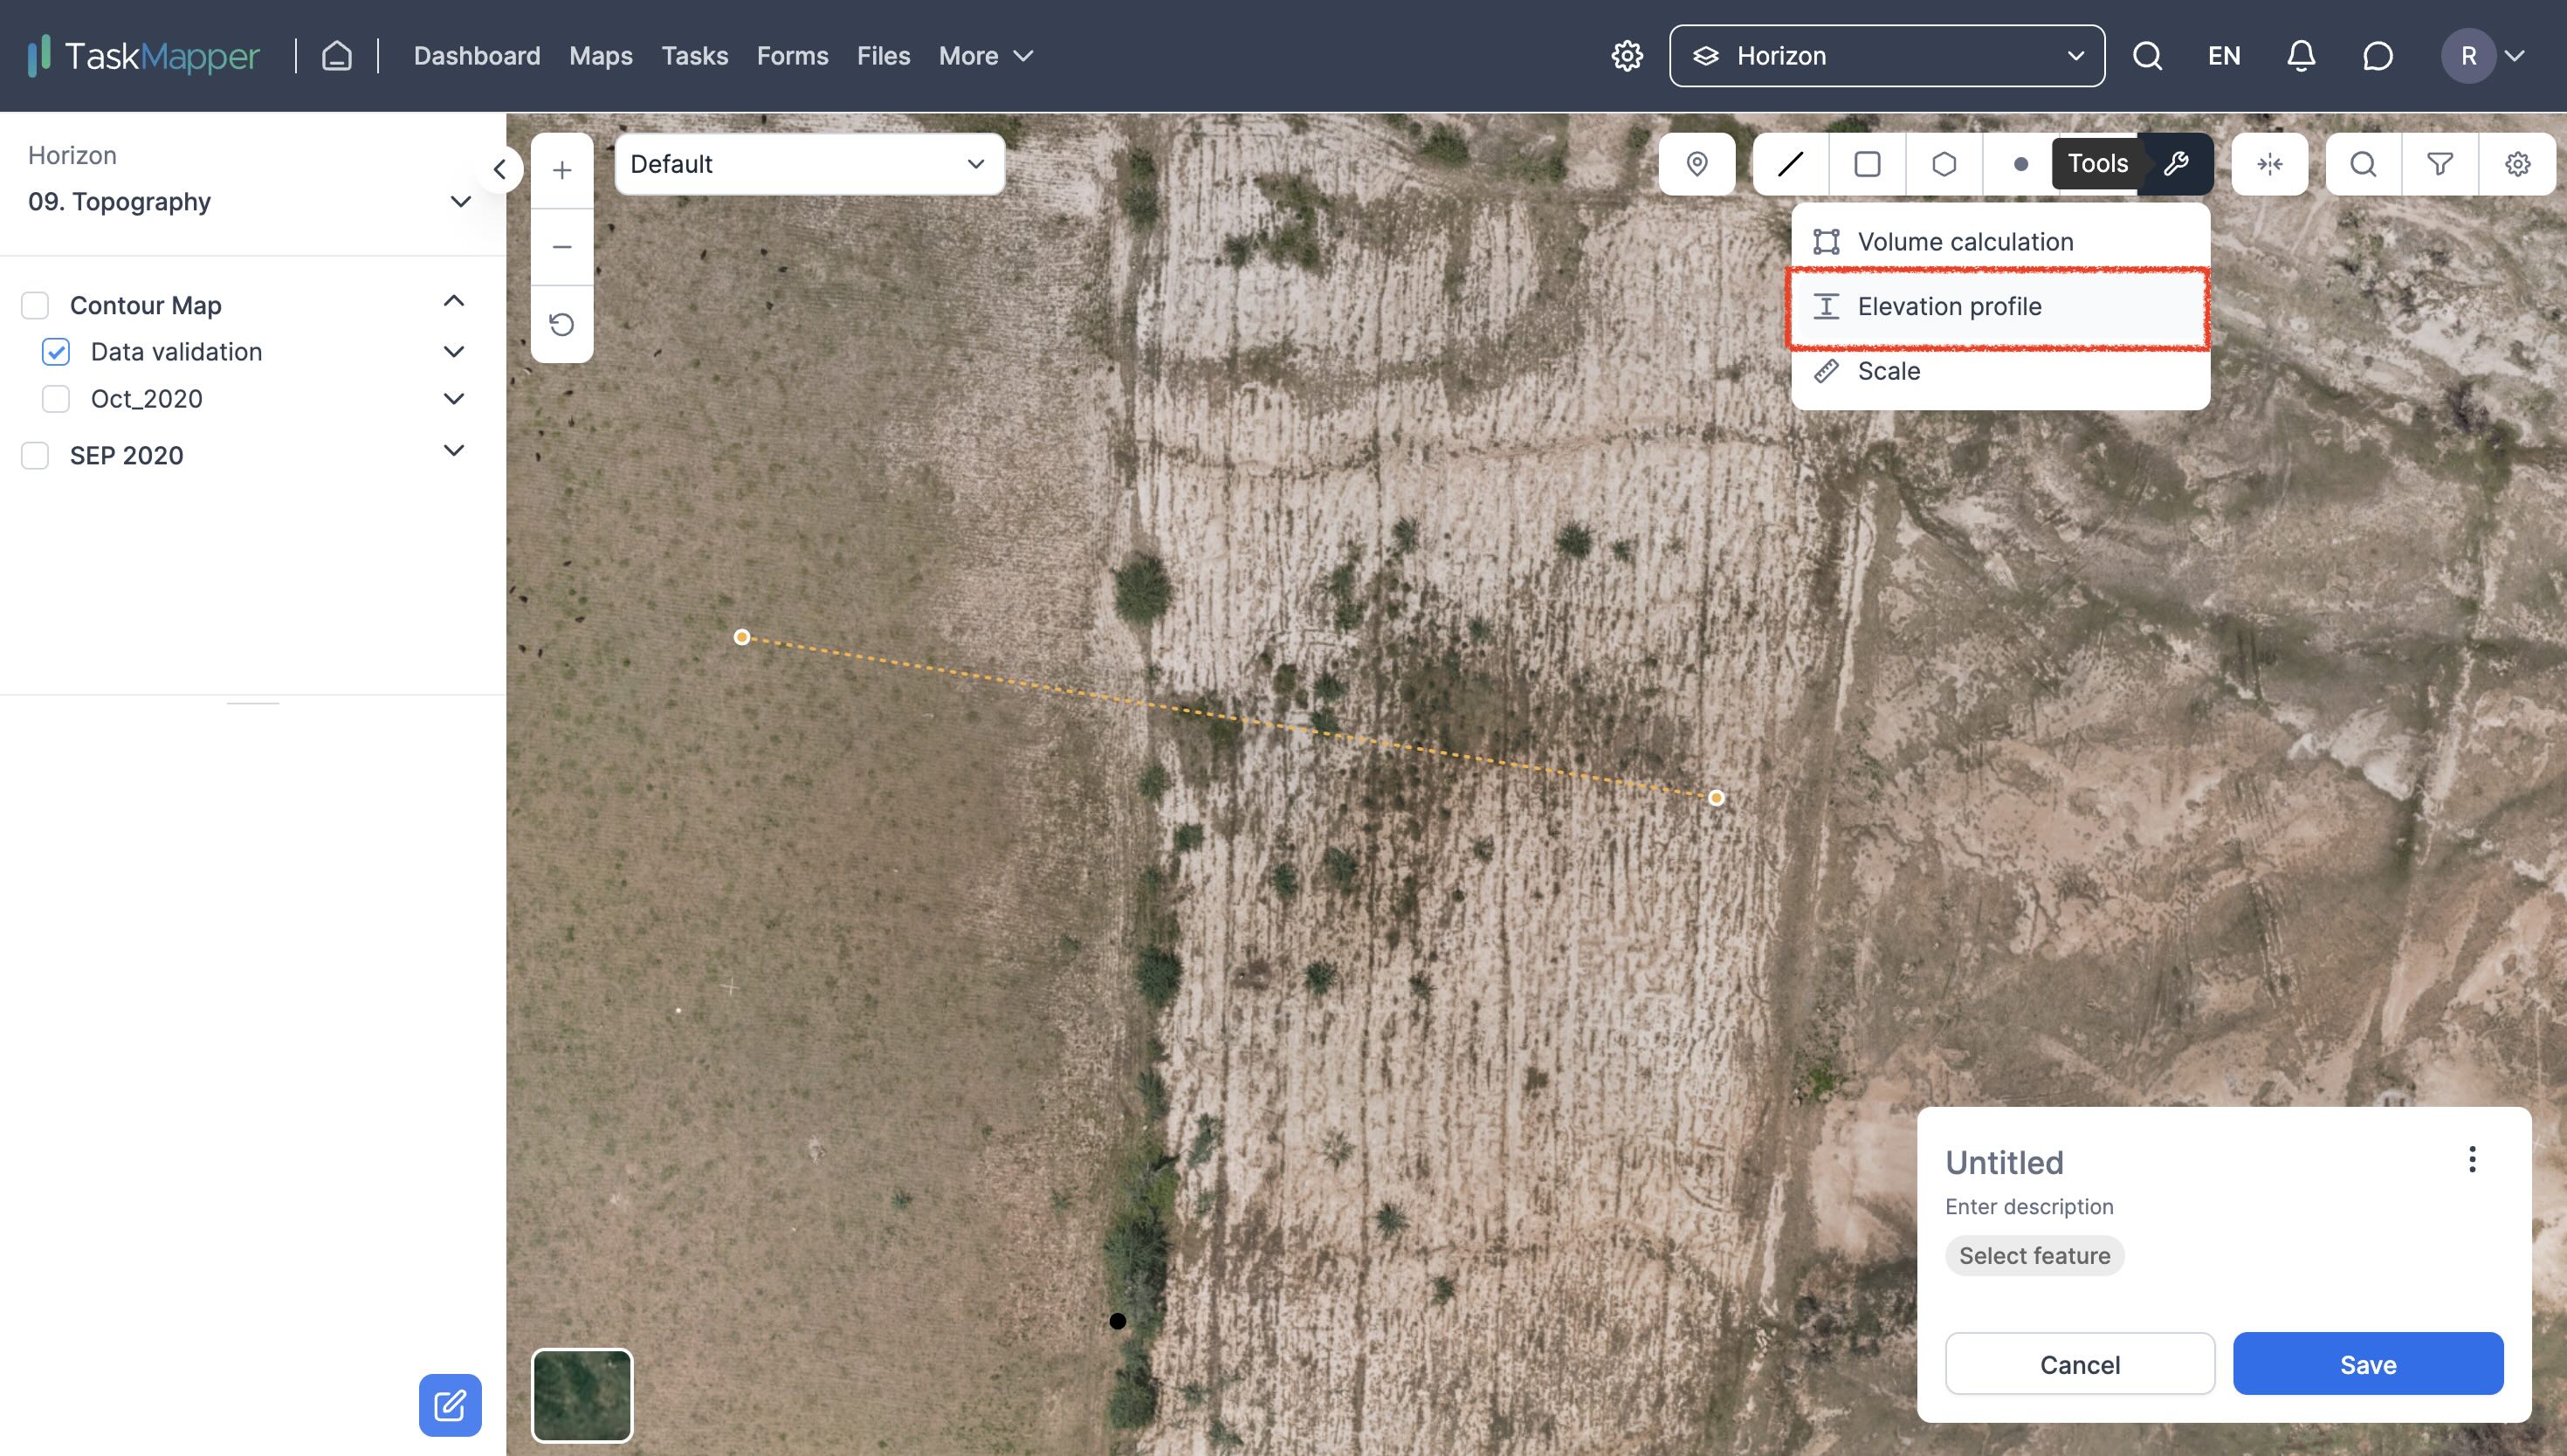
2. Click on the line drawn and select 'Elevation Profile' from the toolbox.
FIGURE 4: ELEVATION PROFILE
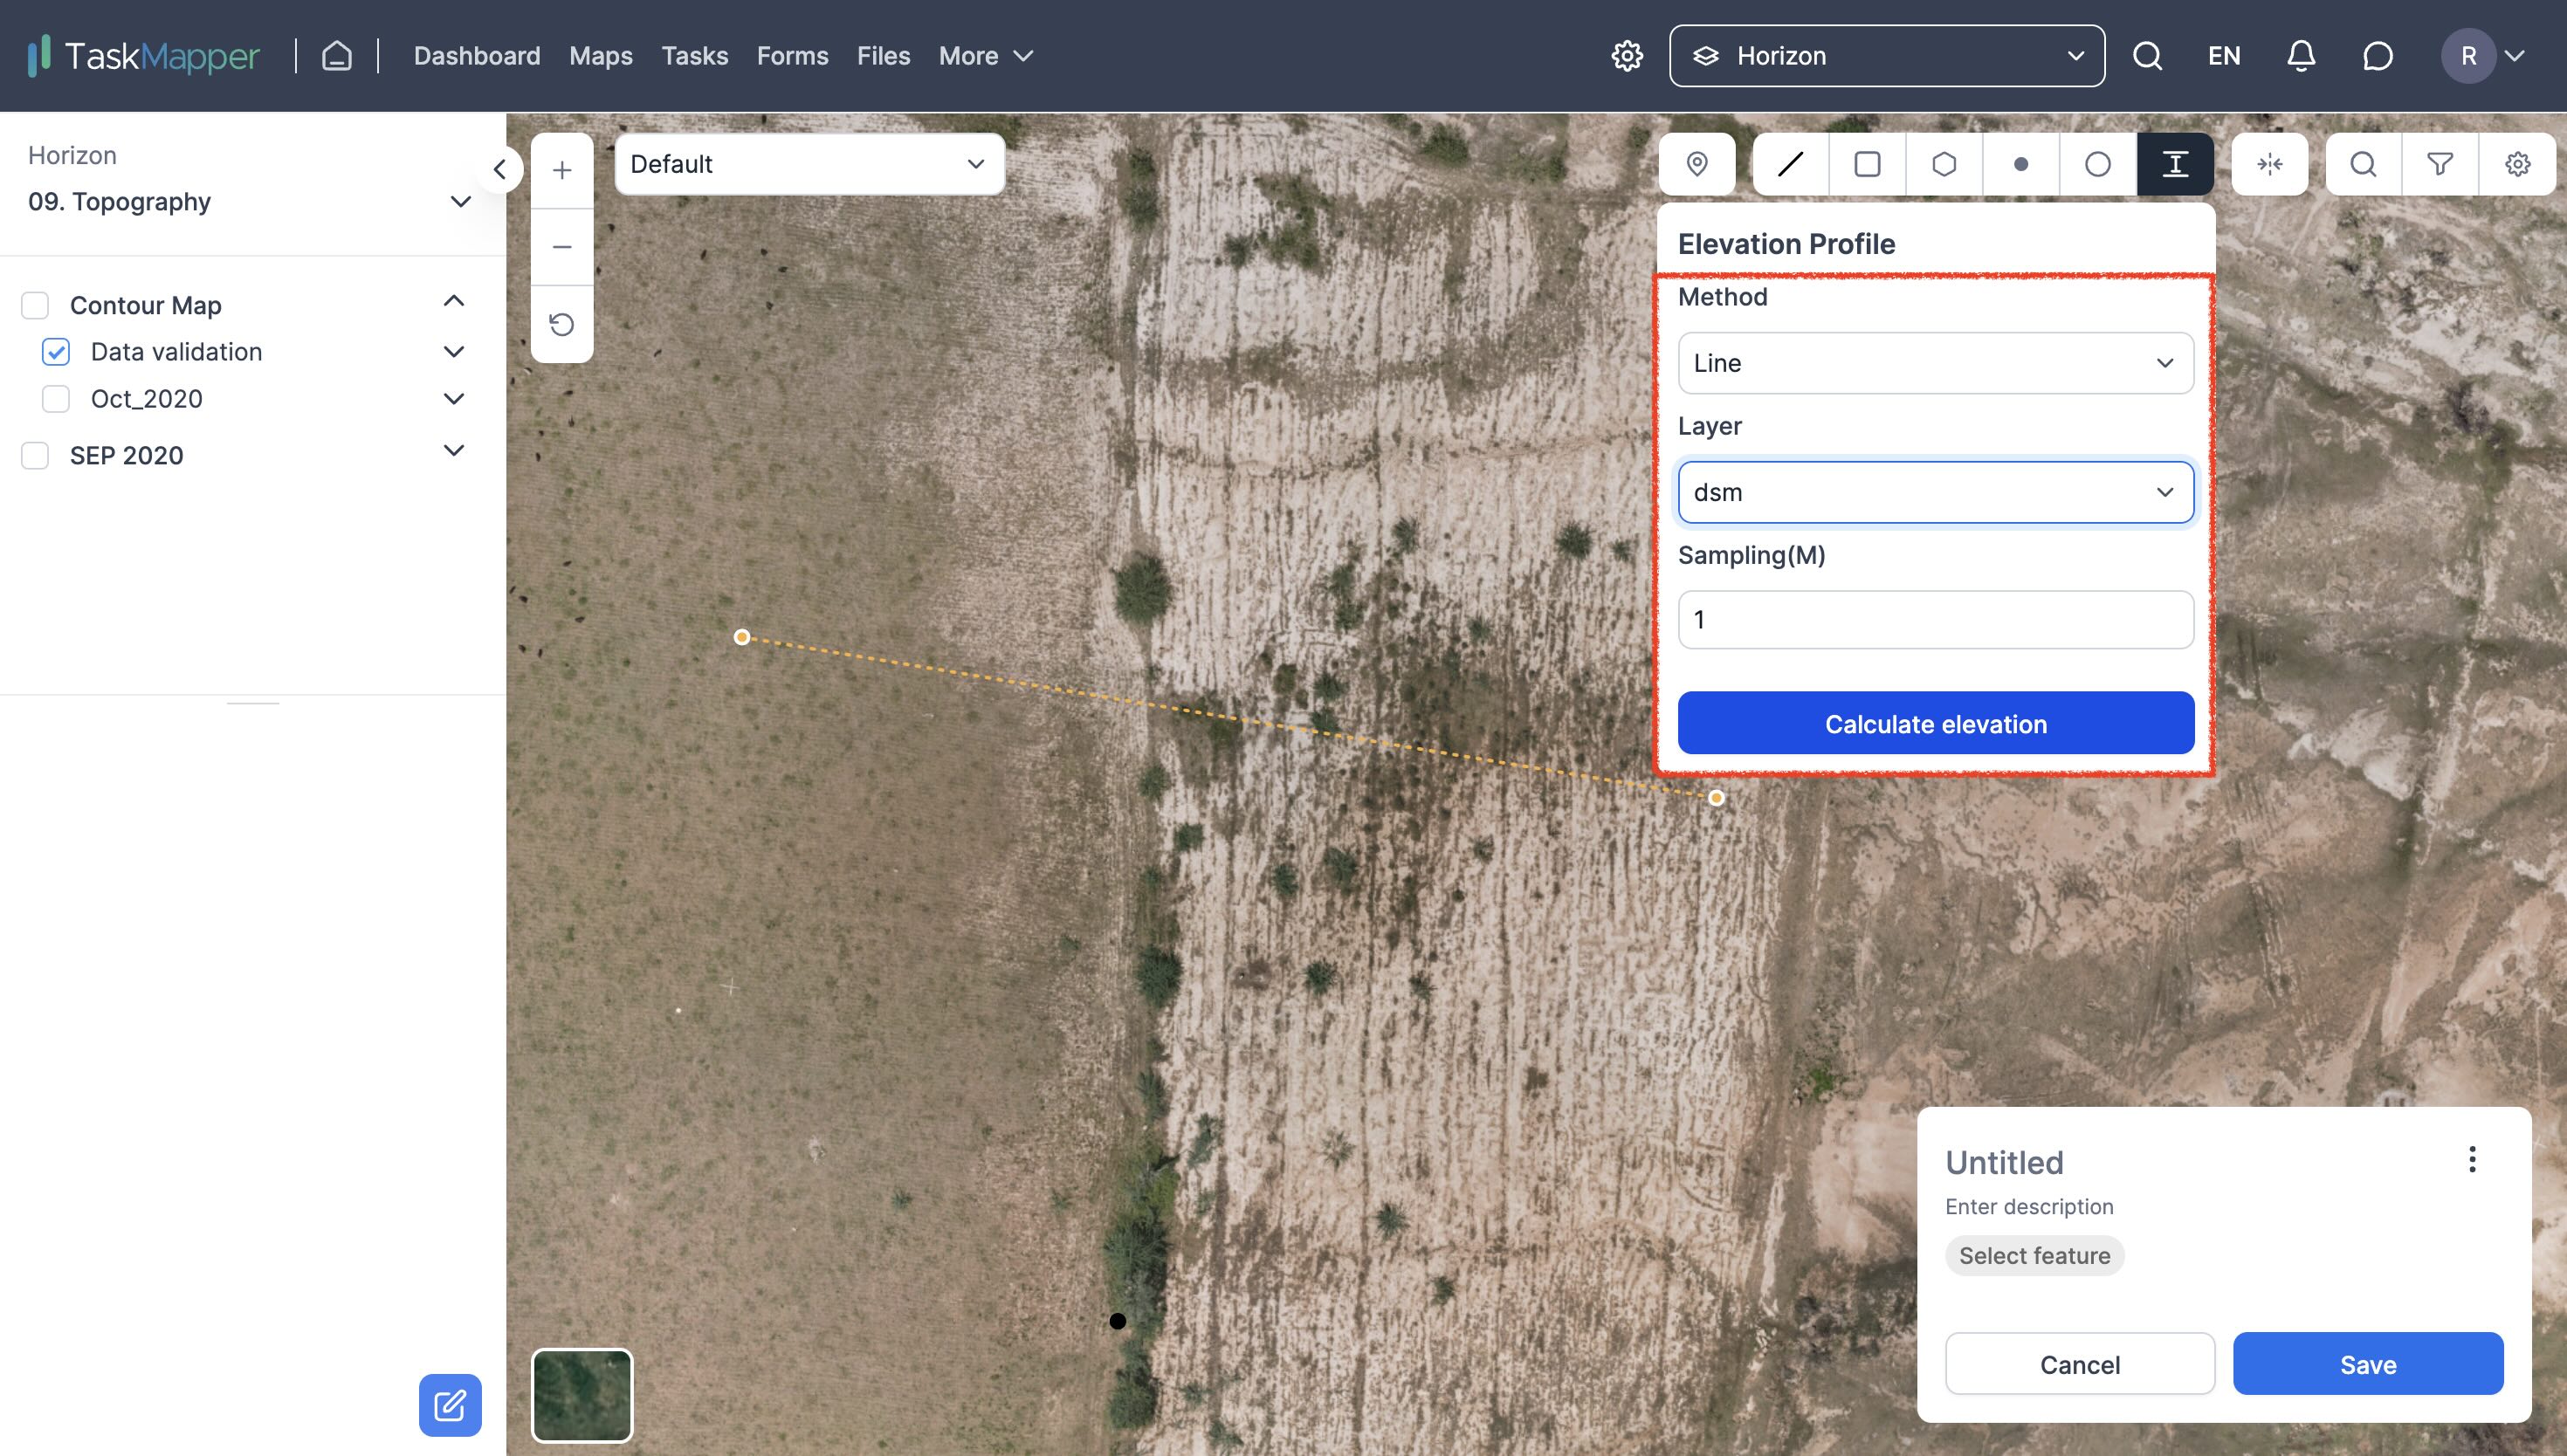
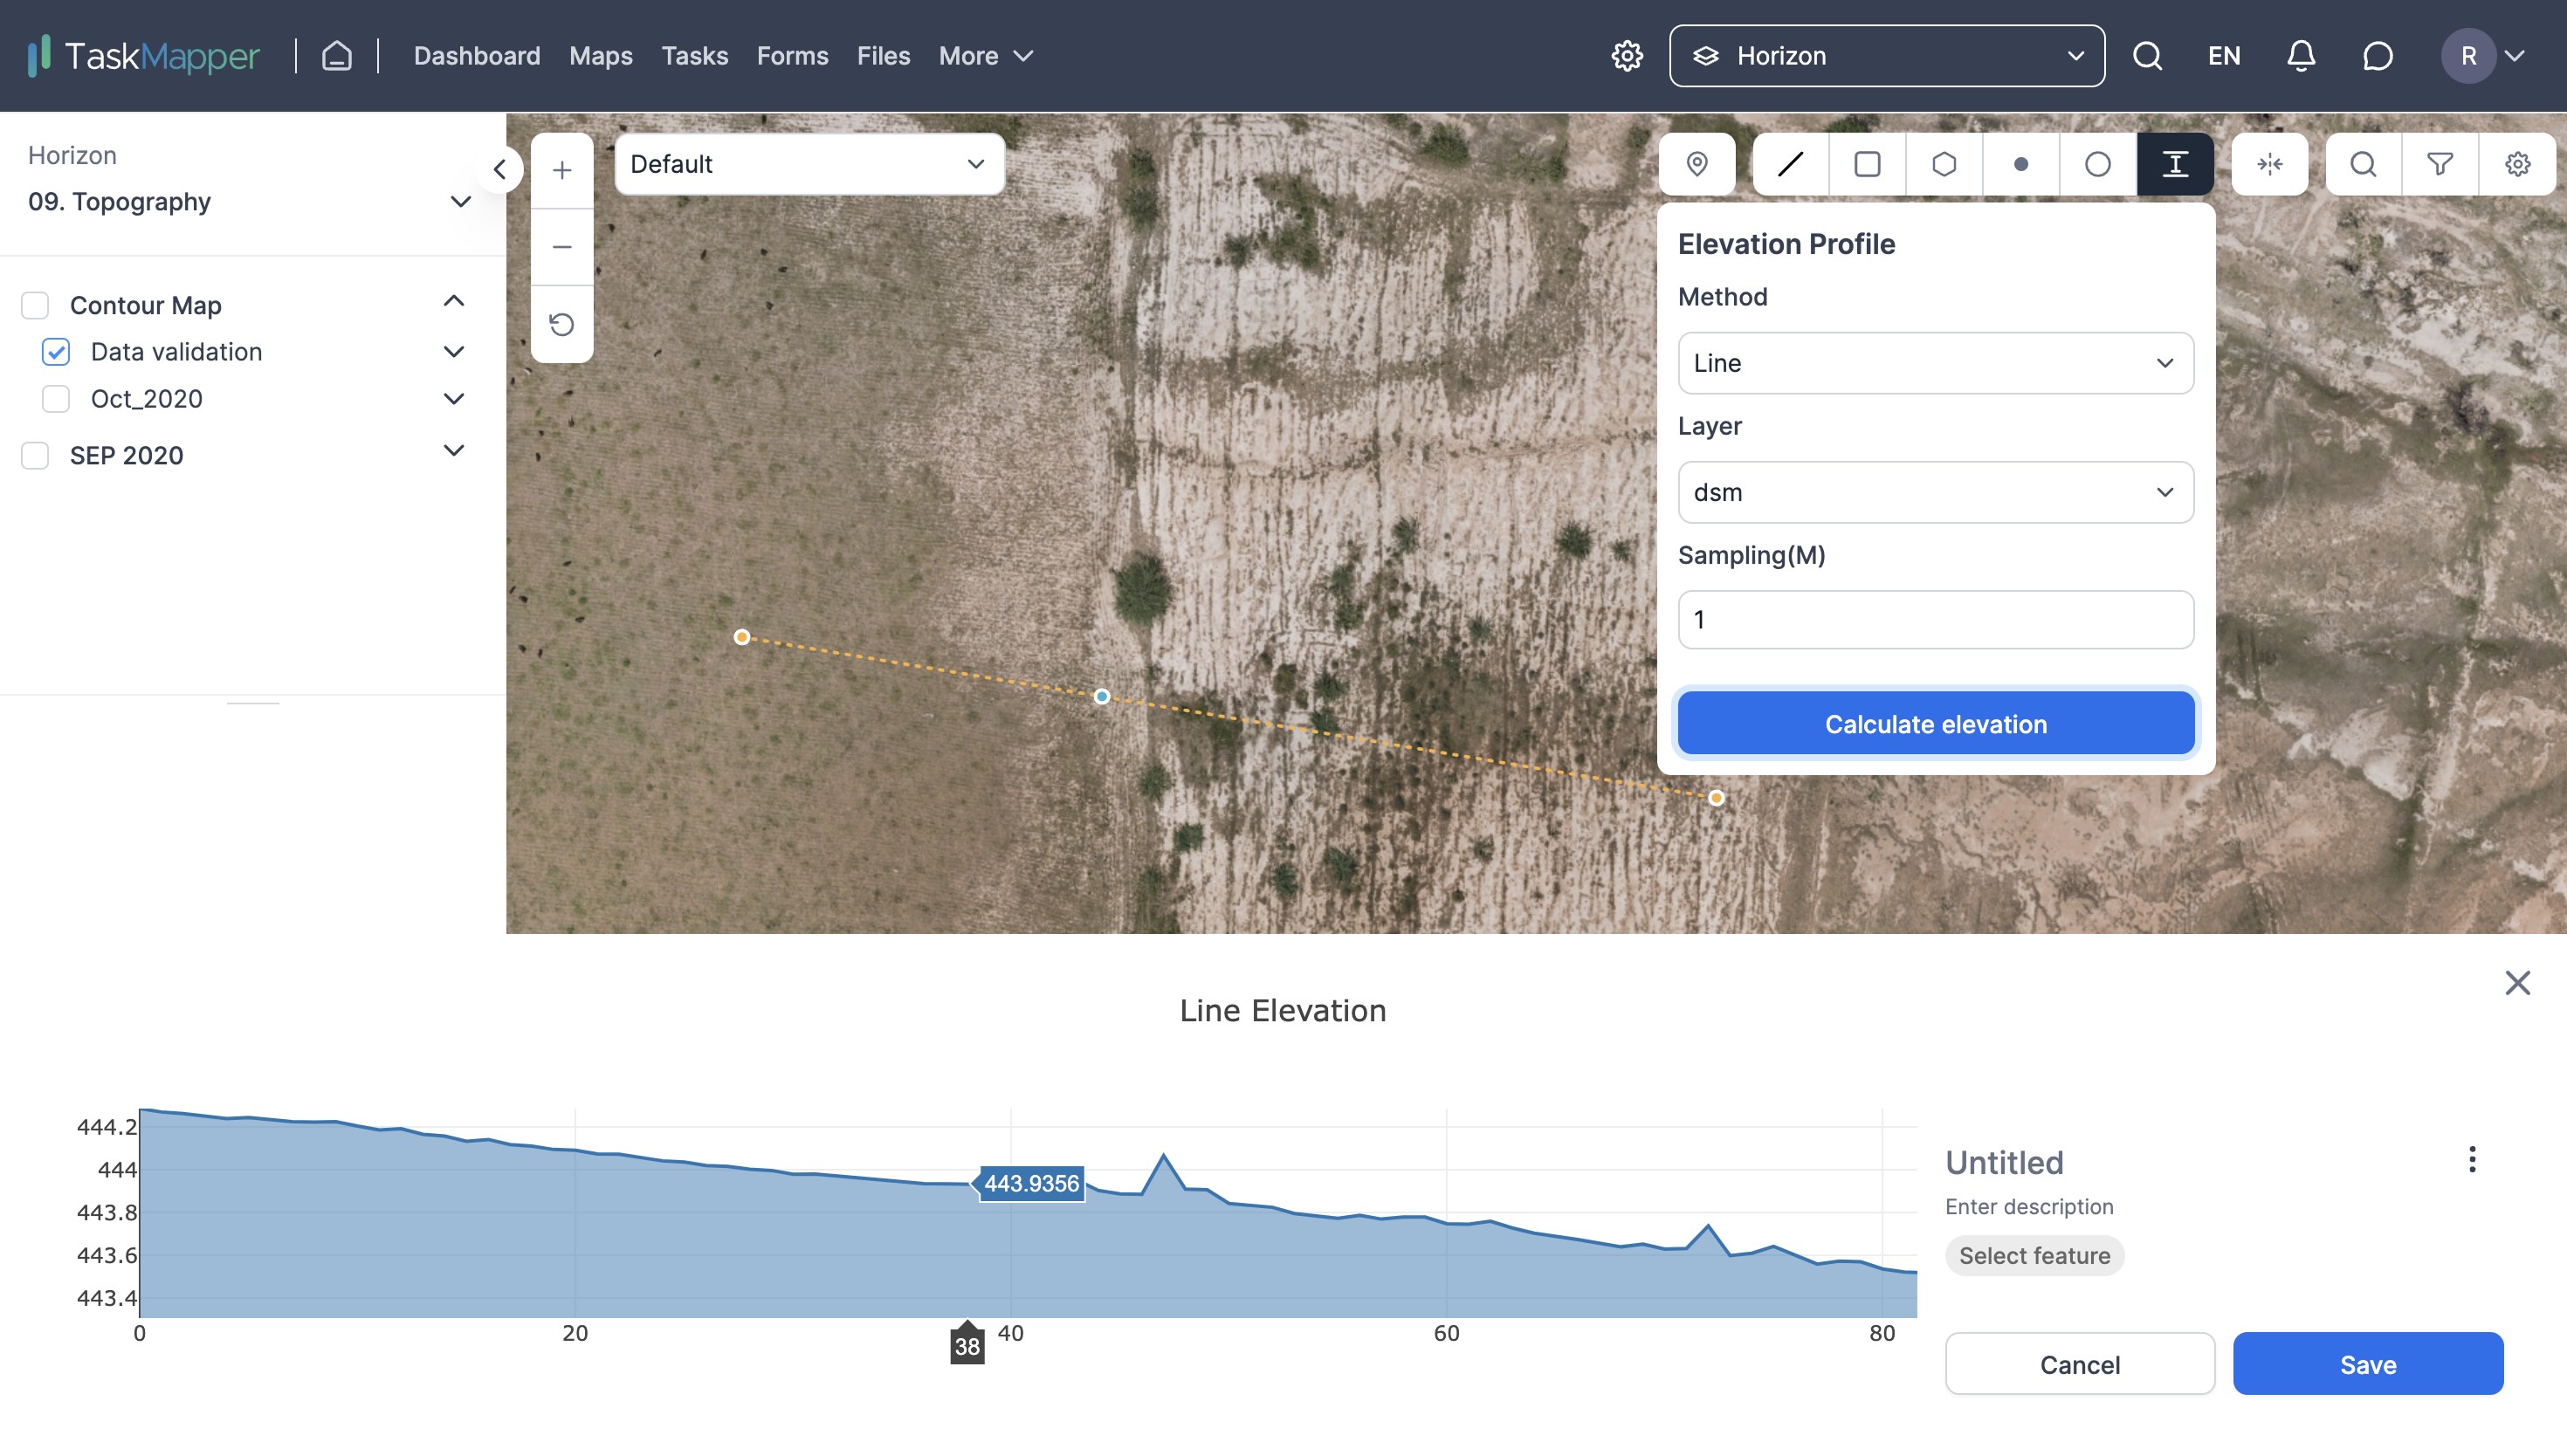
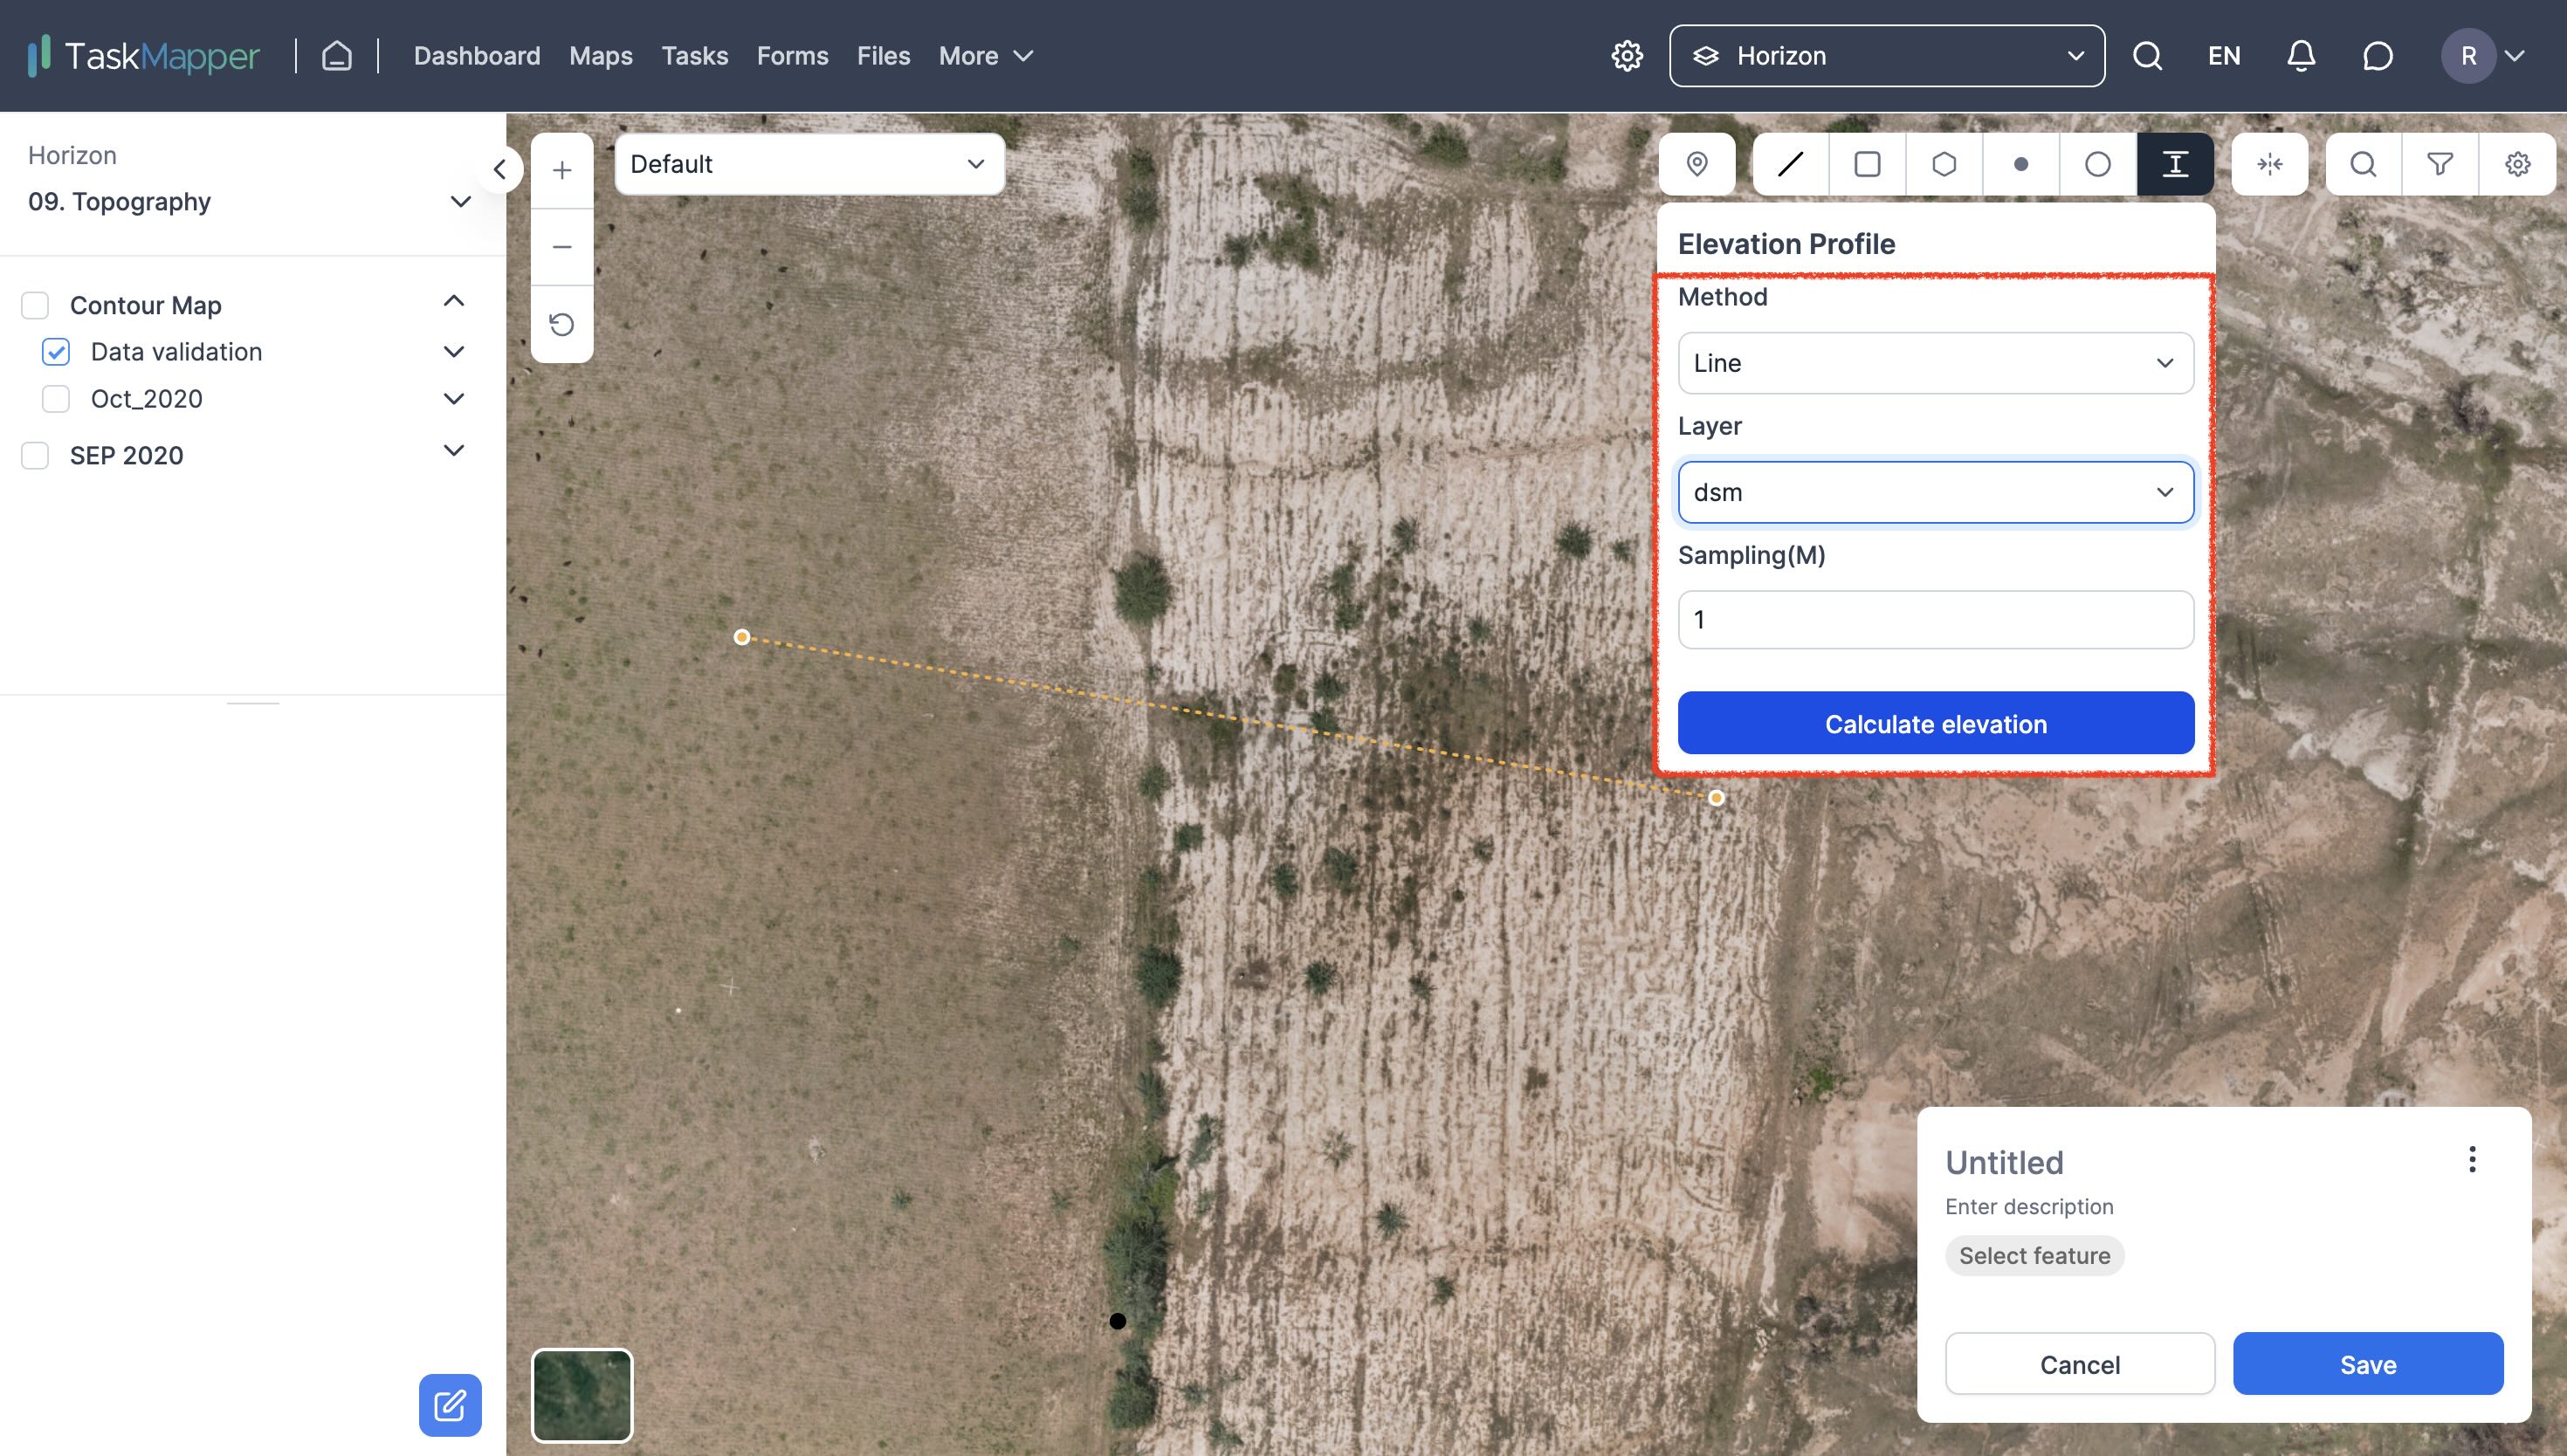
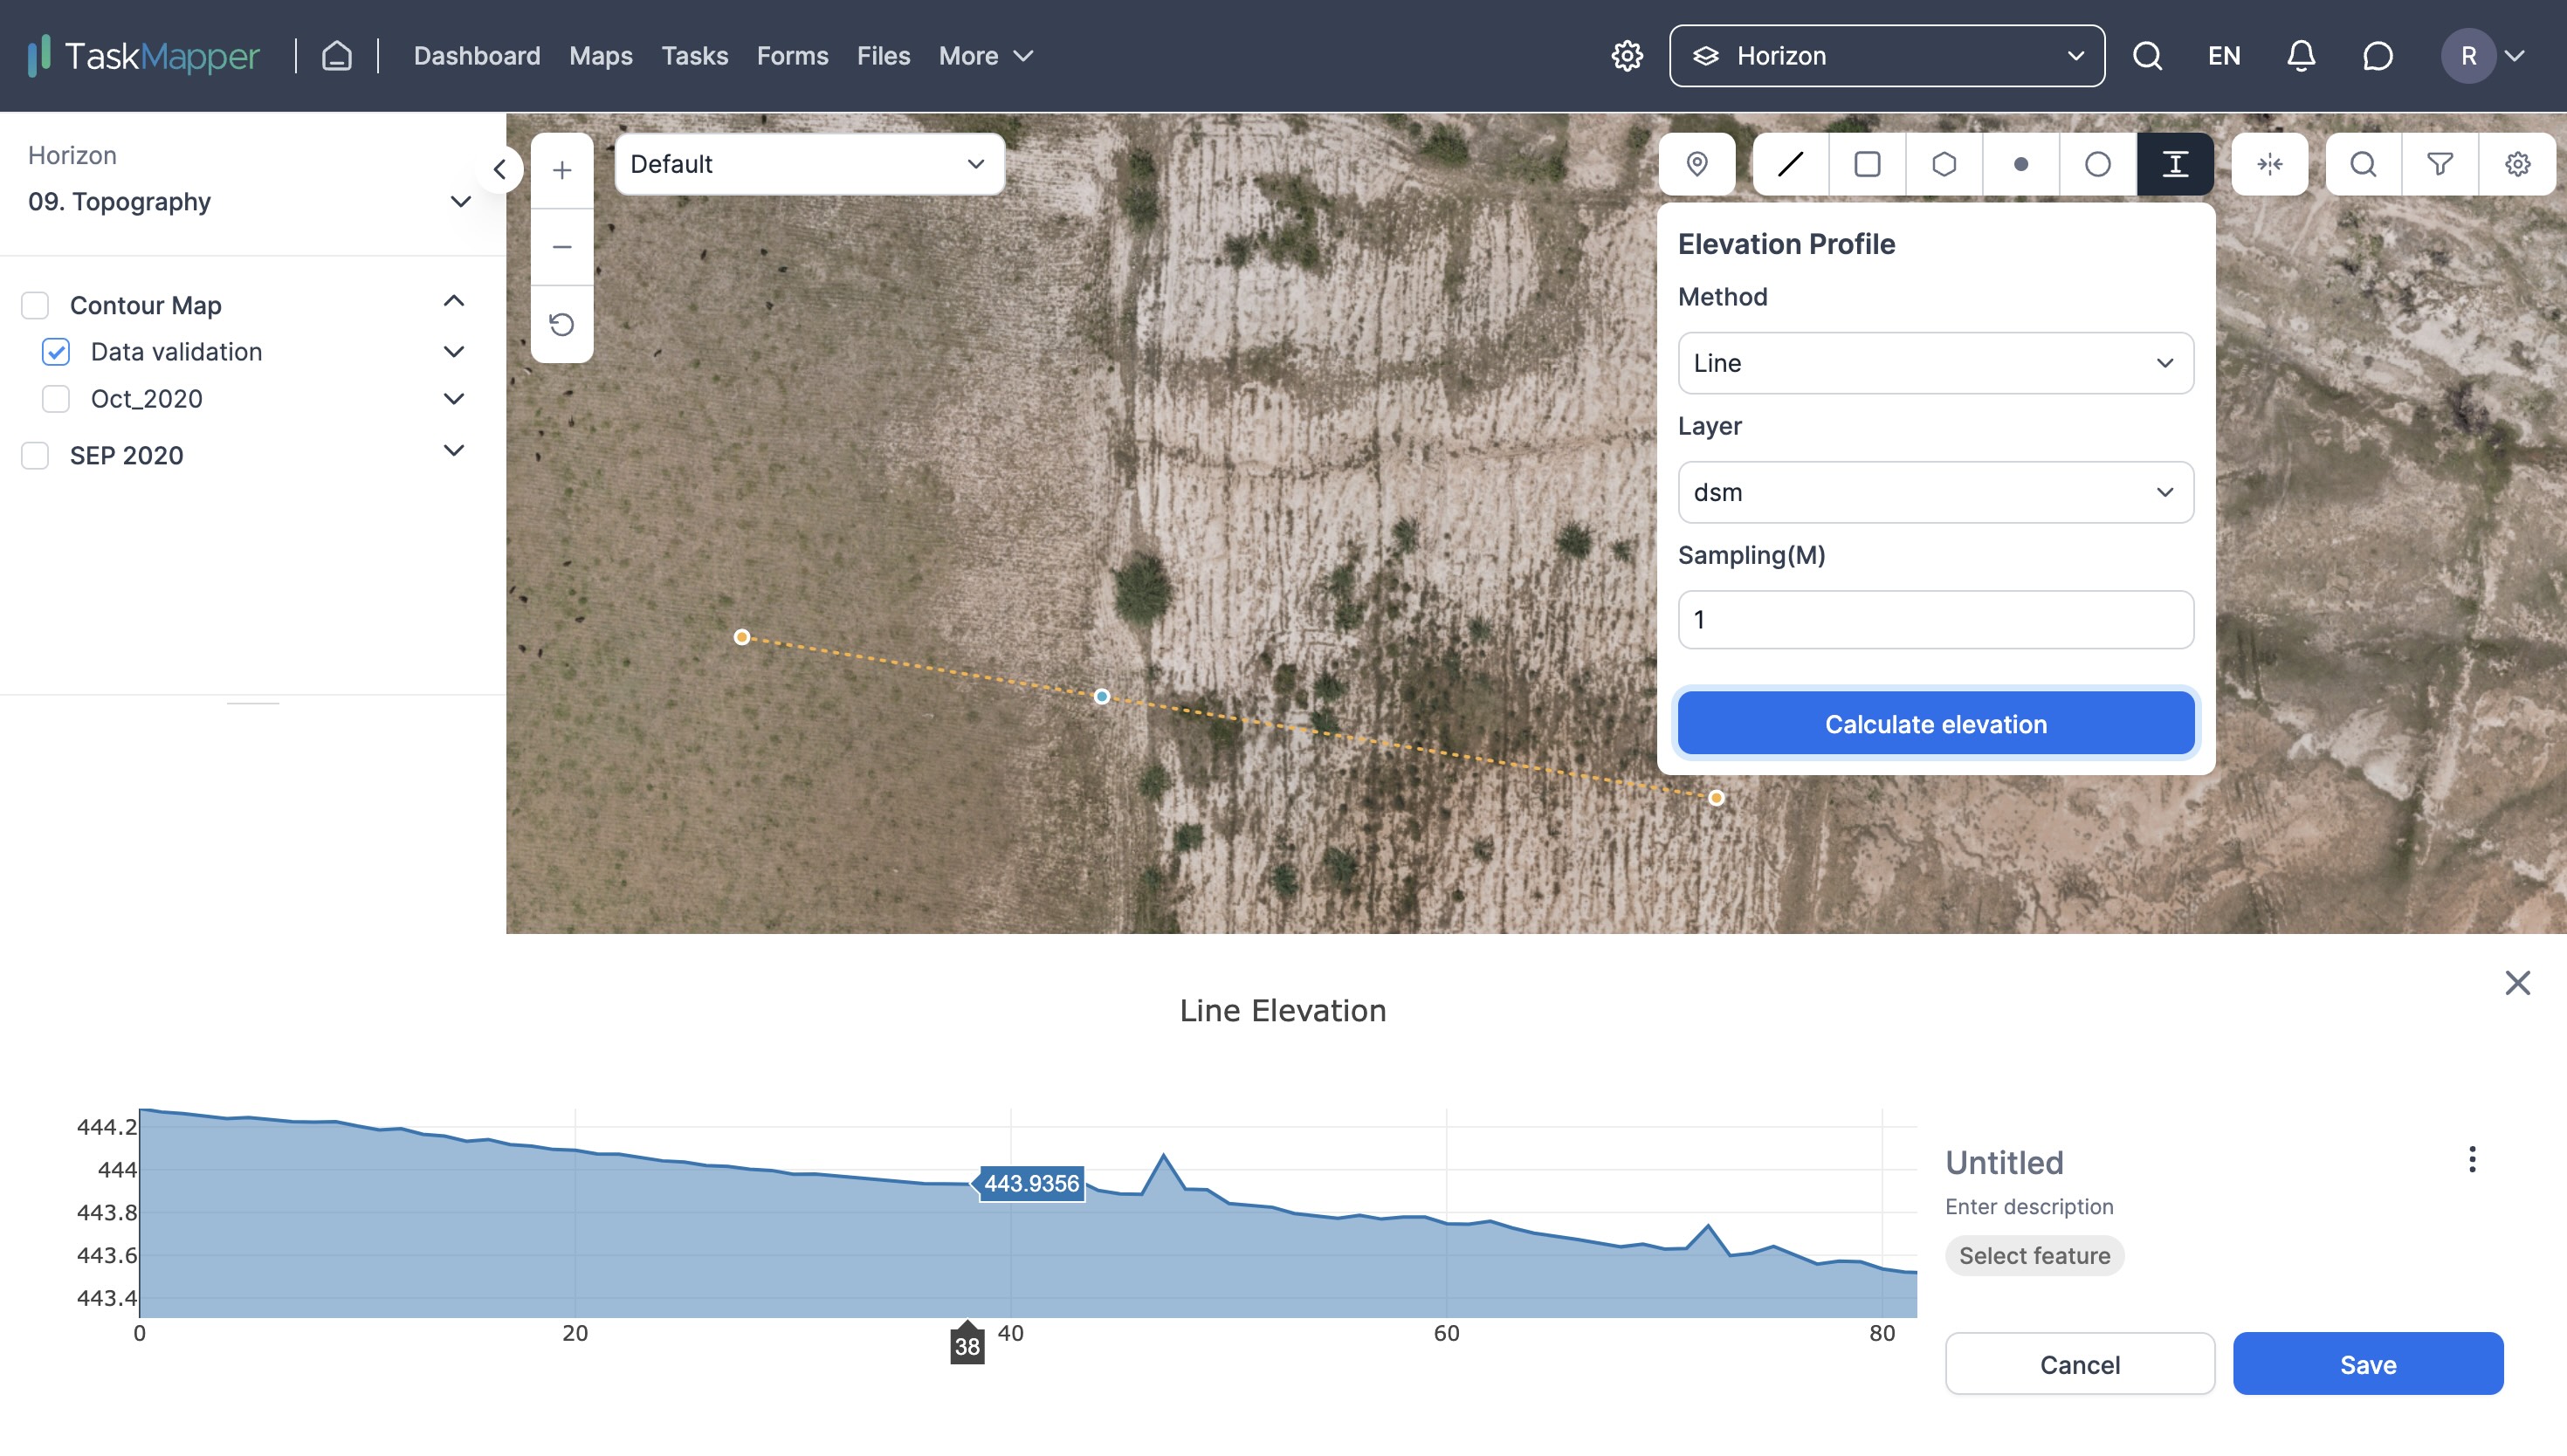
3. In the elevation profile dialogue box, set the parameters. Choose the method as 'Line' and the interval as '1m' or lower. Set the layer as 'DSM' and click on 'Calculate Elevation'.
FIGURE 5: STEPS TO MEASURE ELEVATION PROFILE
Measuring Spot Elevation
Spot elevation, or a point on a map or chart, indicates points higher than their surroundings. Spot elevation displays the actual elevation of a selected point and the top and/or bottom elevation of elements with a thickness.
1. To check spot elevation, select the marker tool from the toolbox and place it on the desired point on the map. Then select 'Elevation Profile' from the toolbox.
FIGURE 6: SPOT ELEVATION MARKER
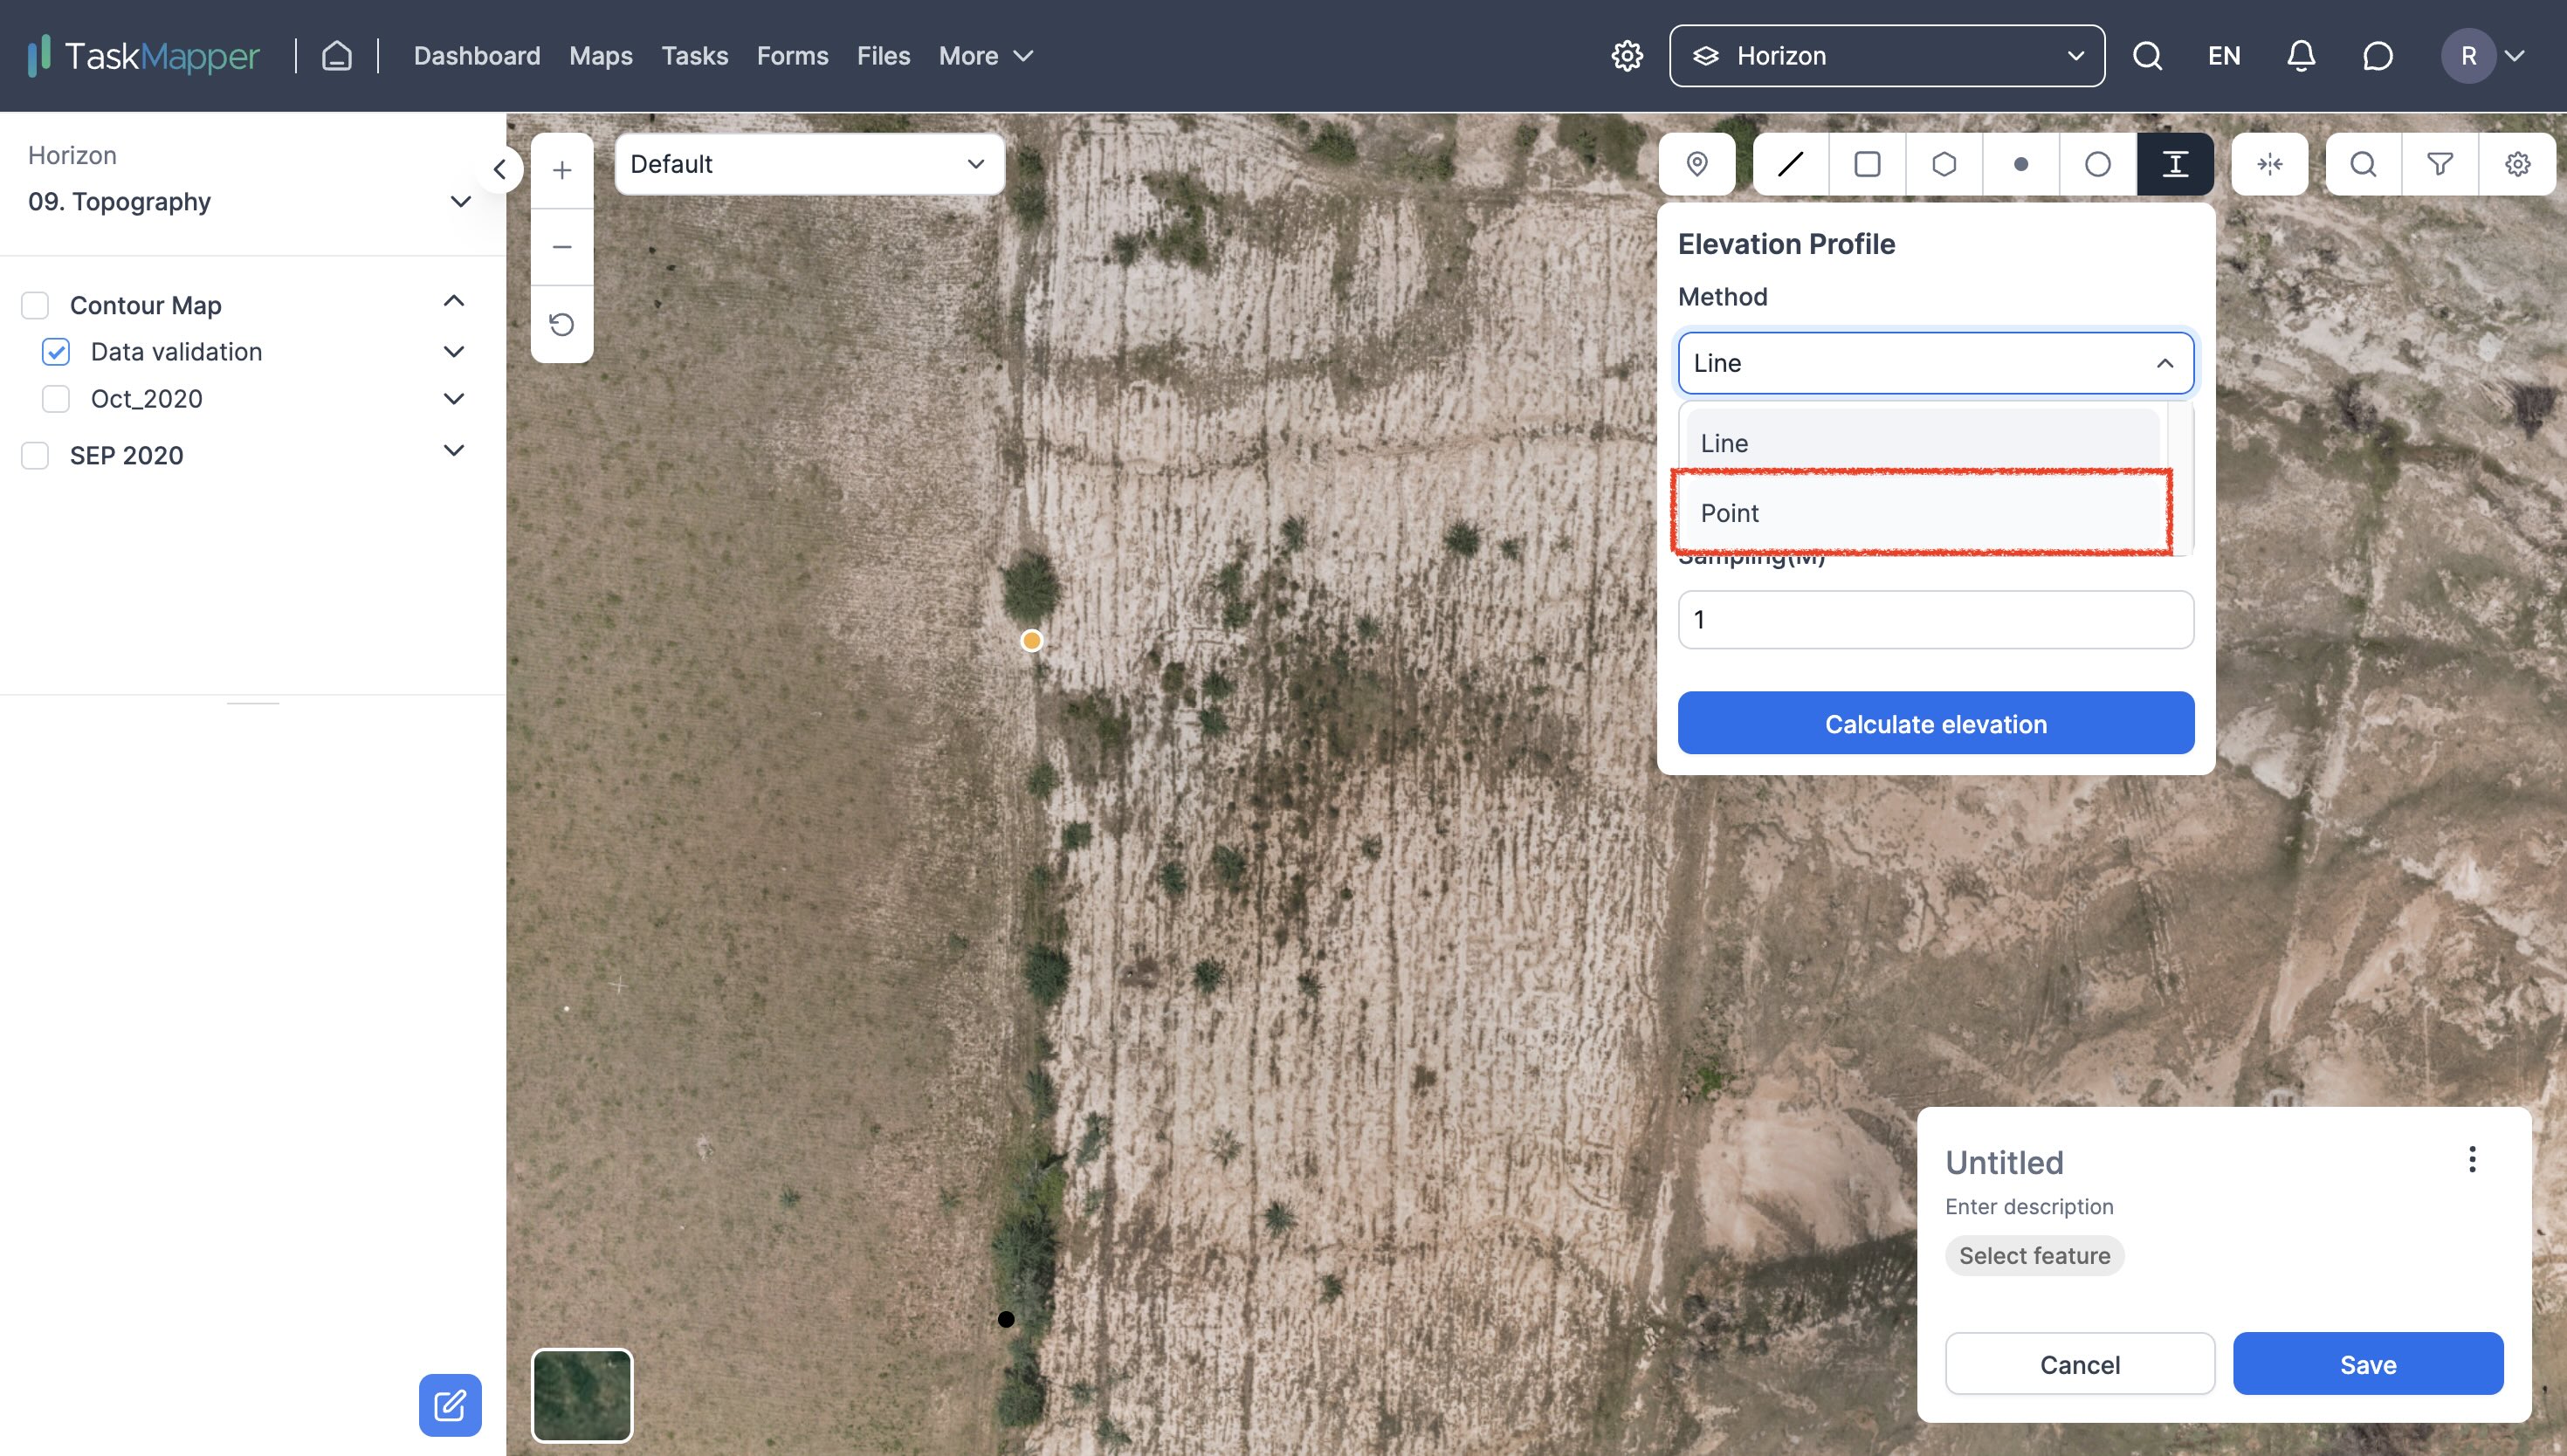
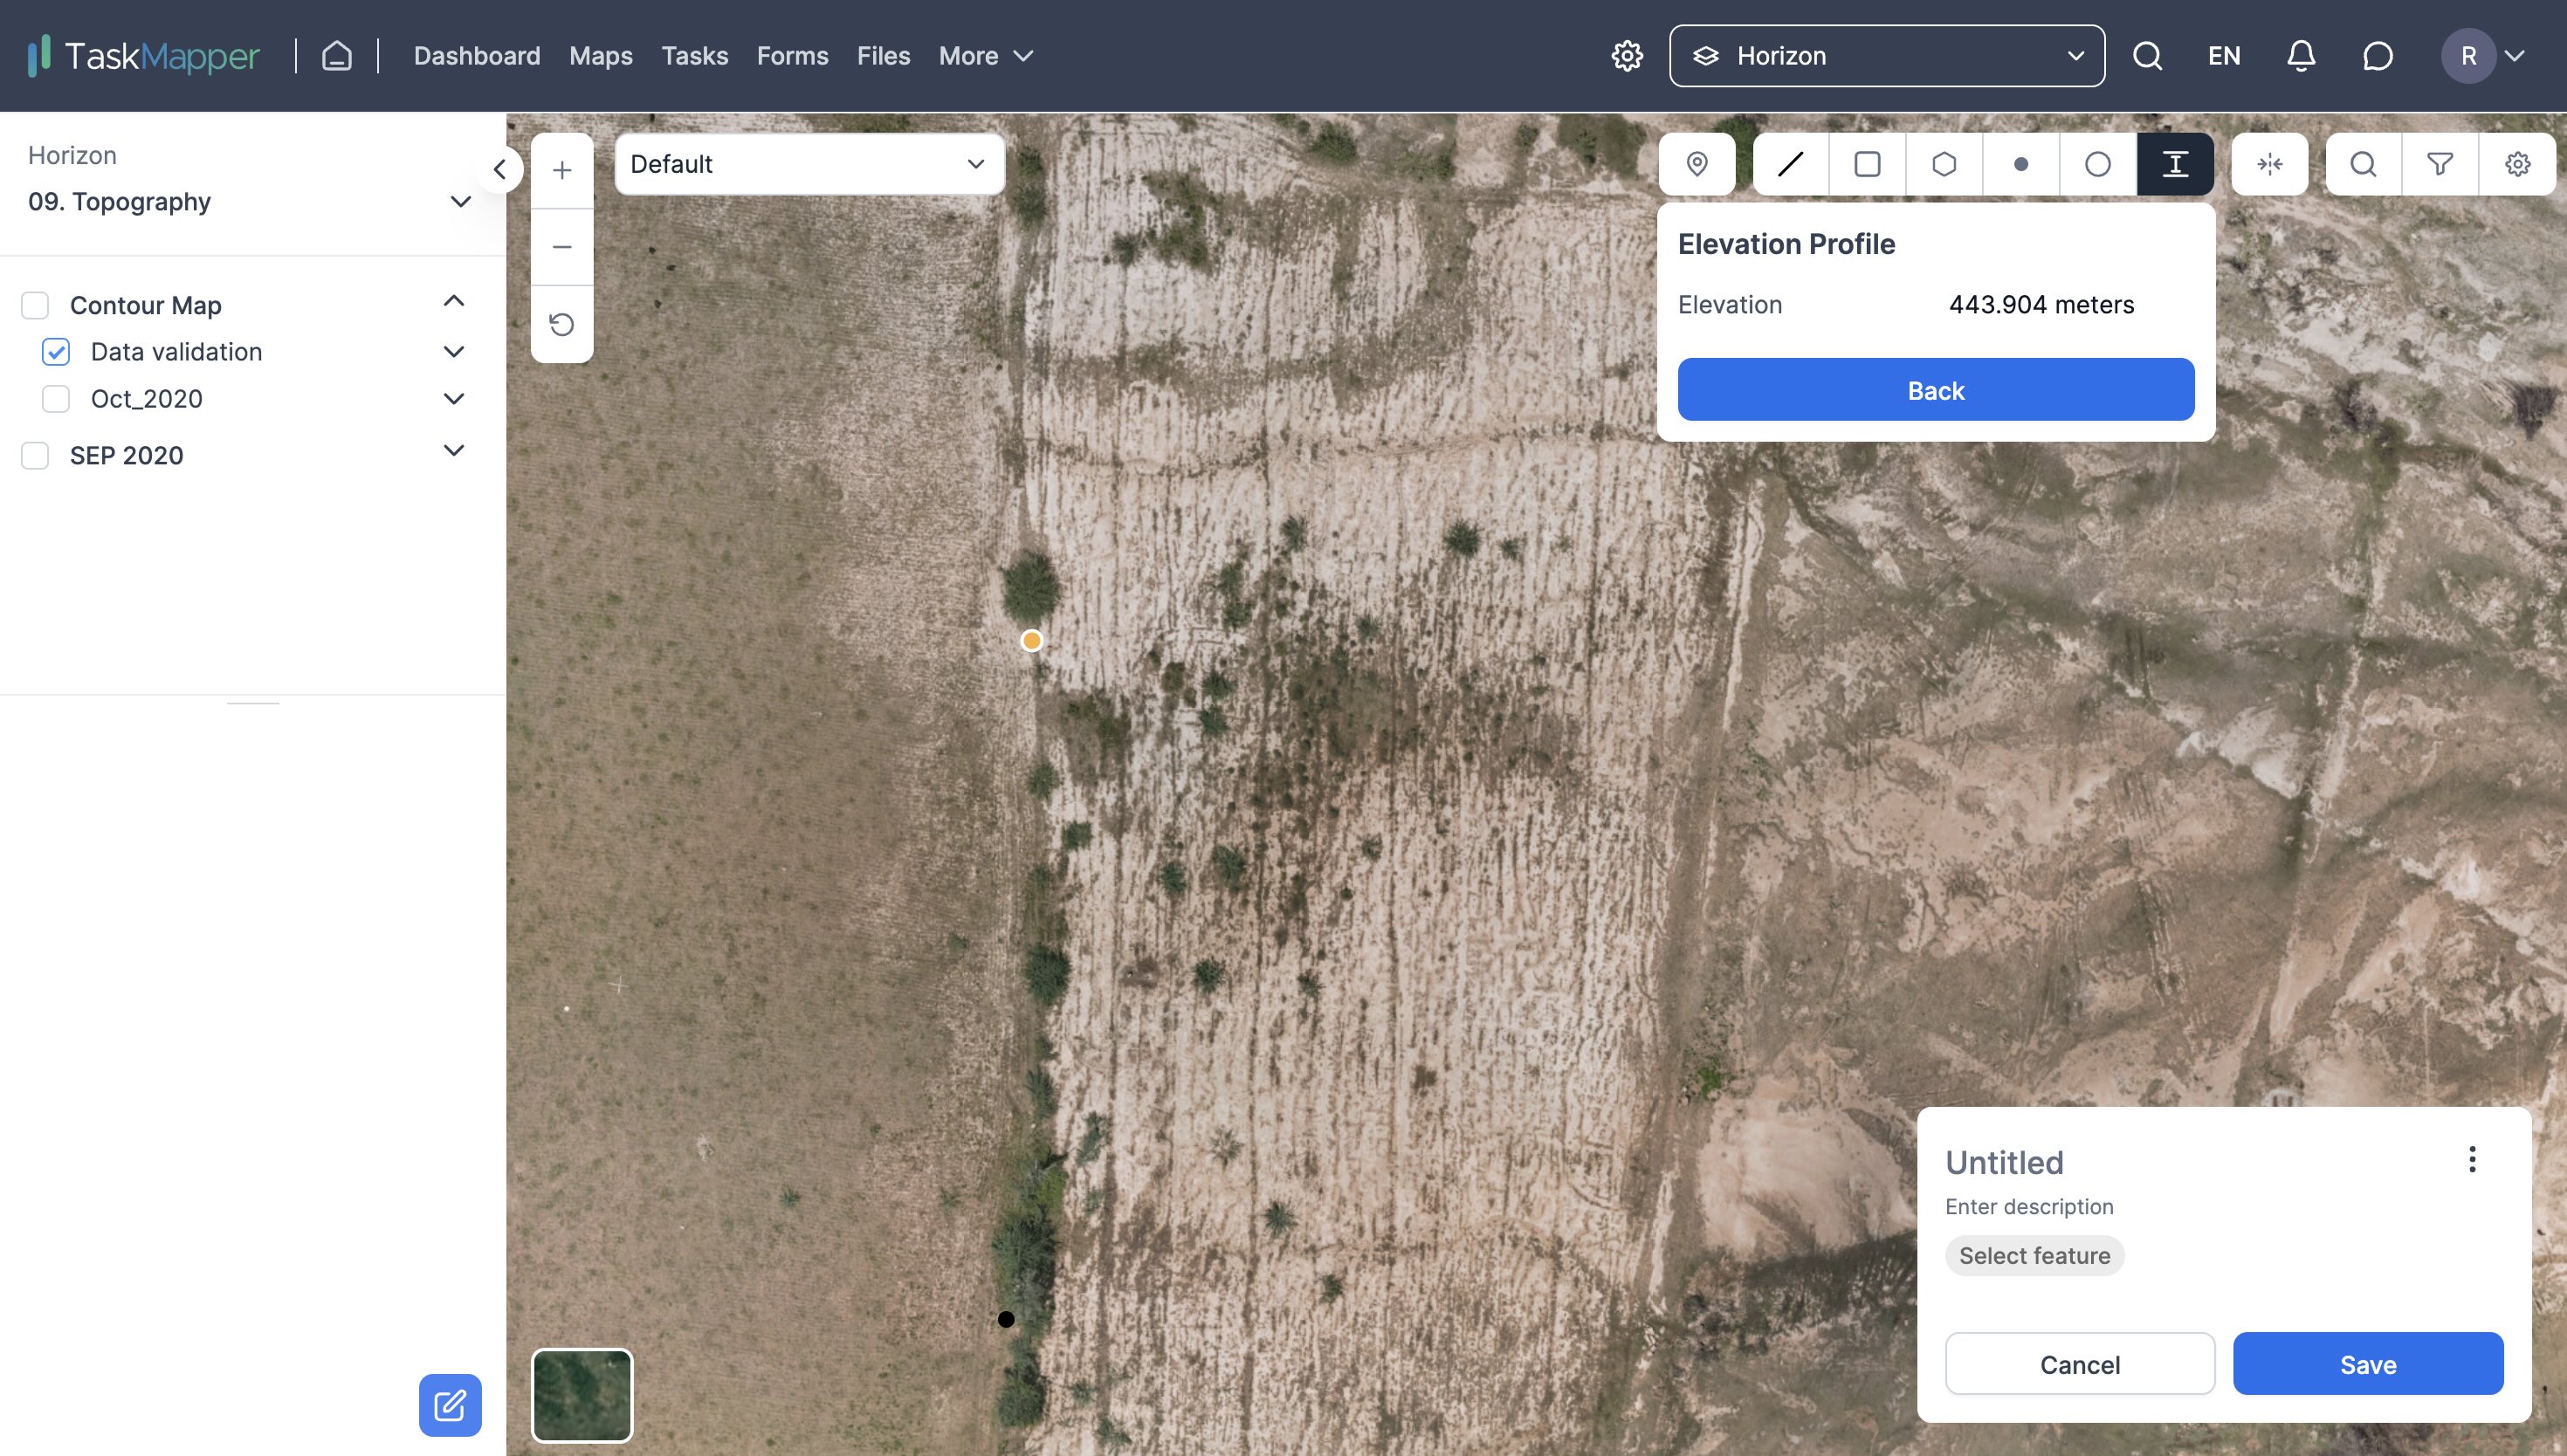
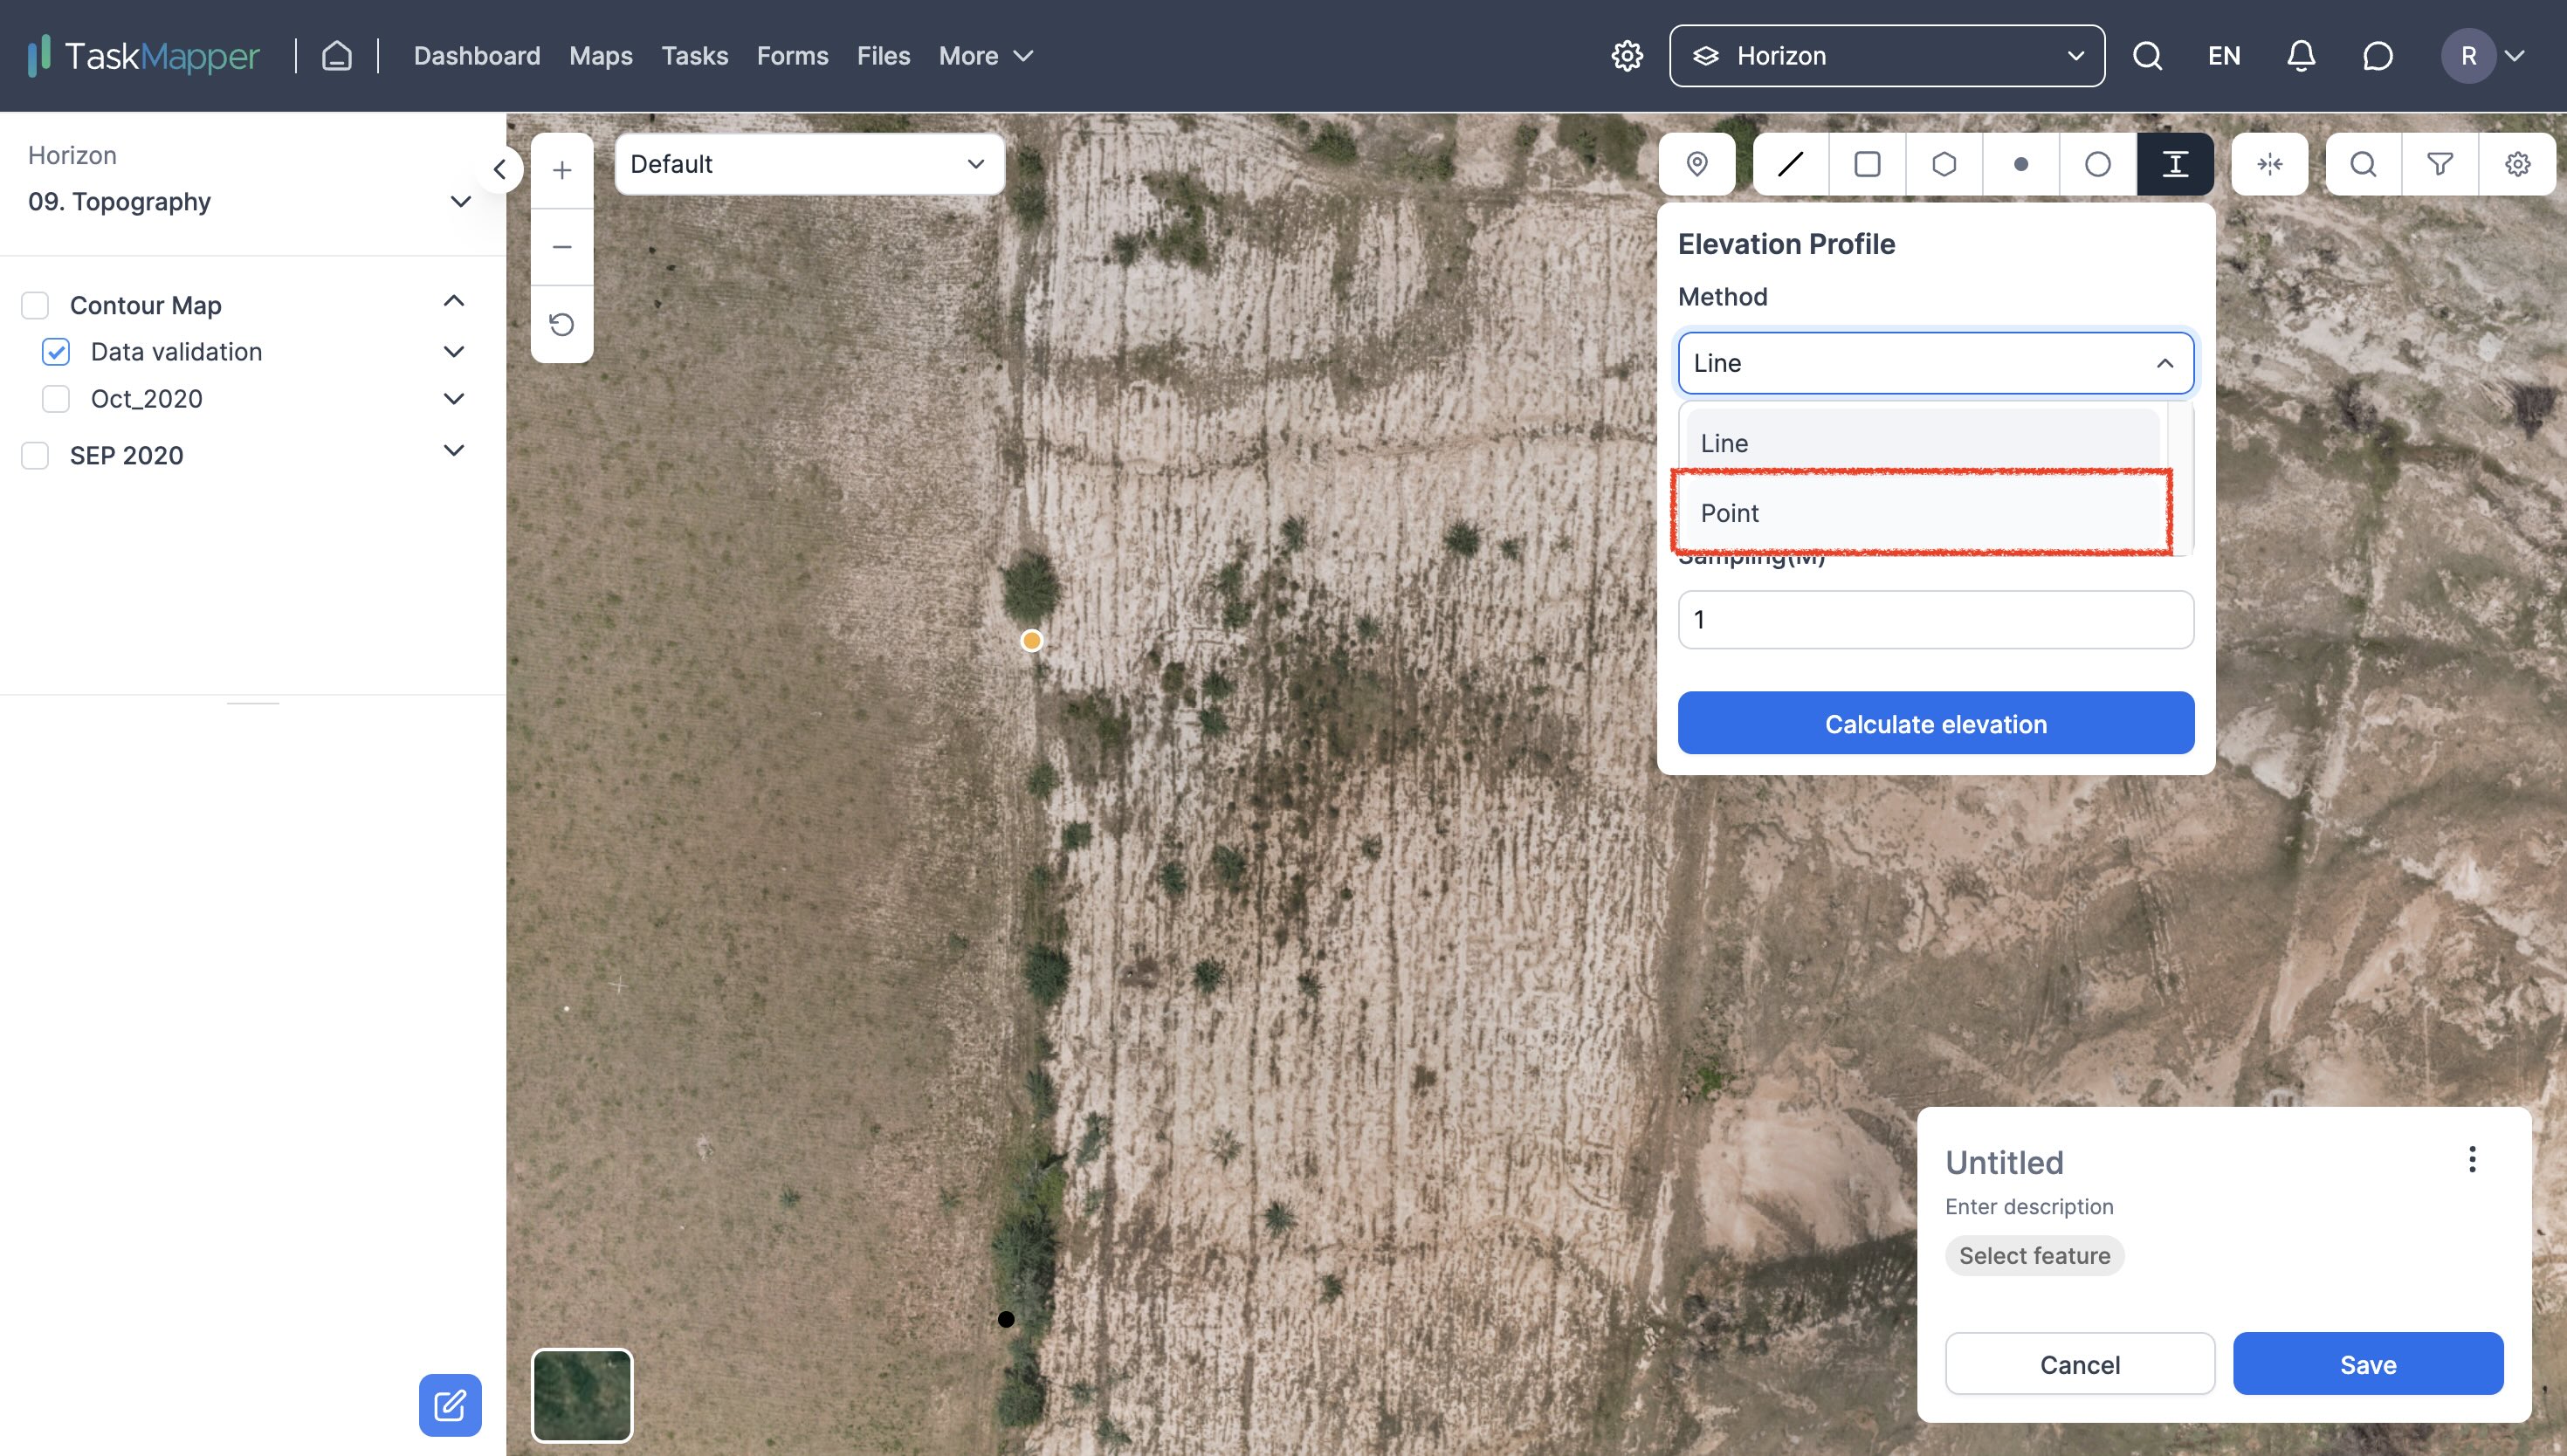
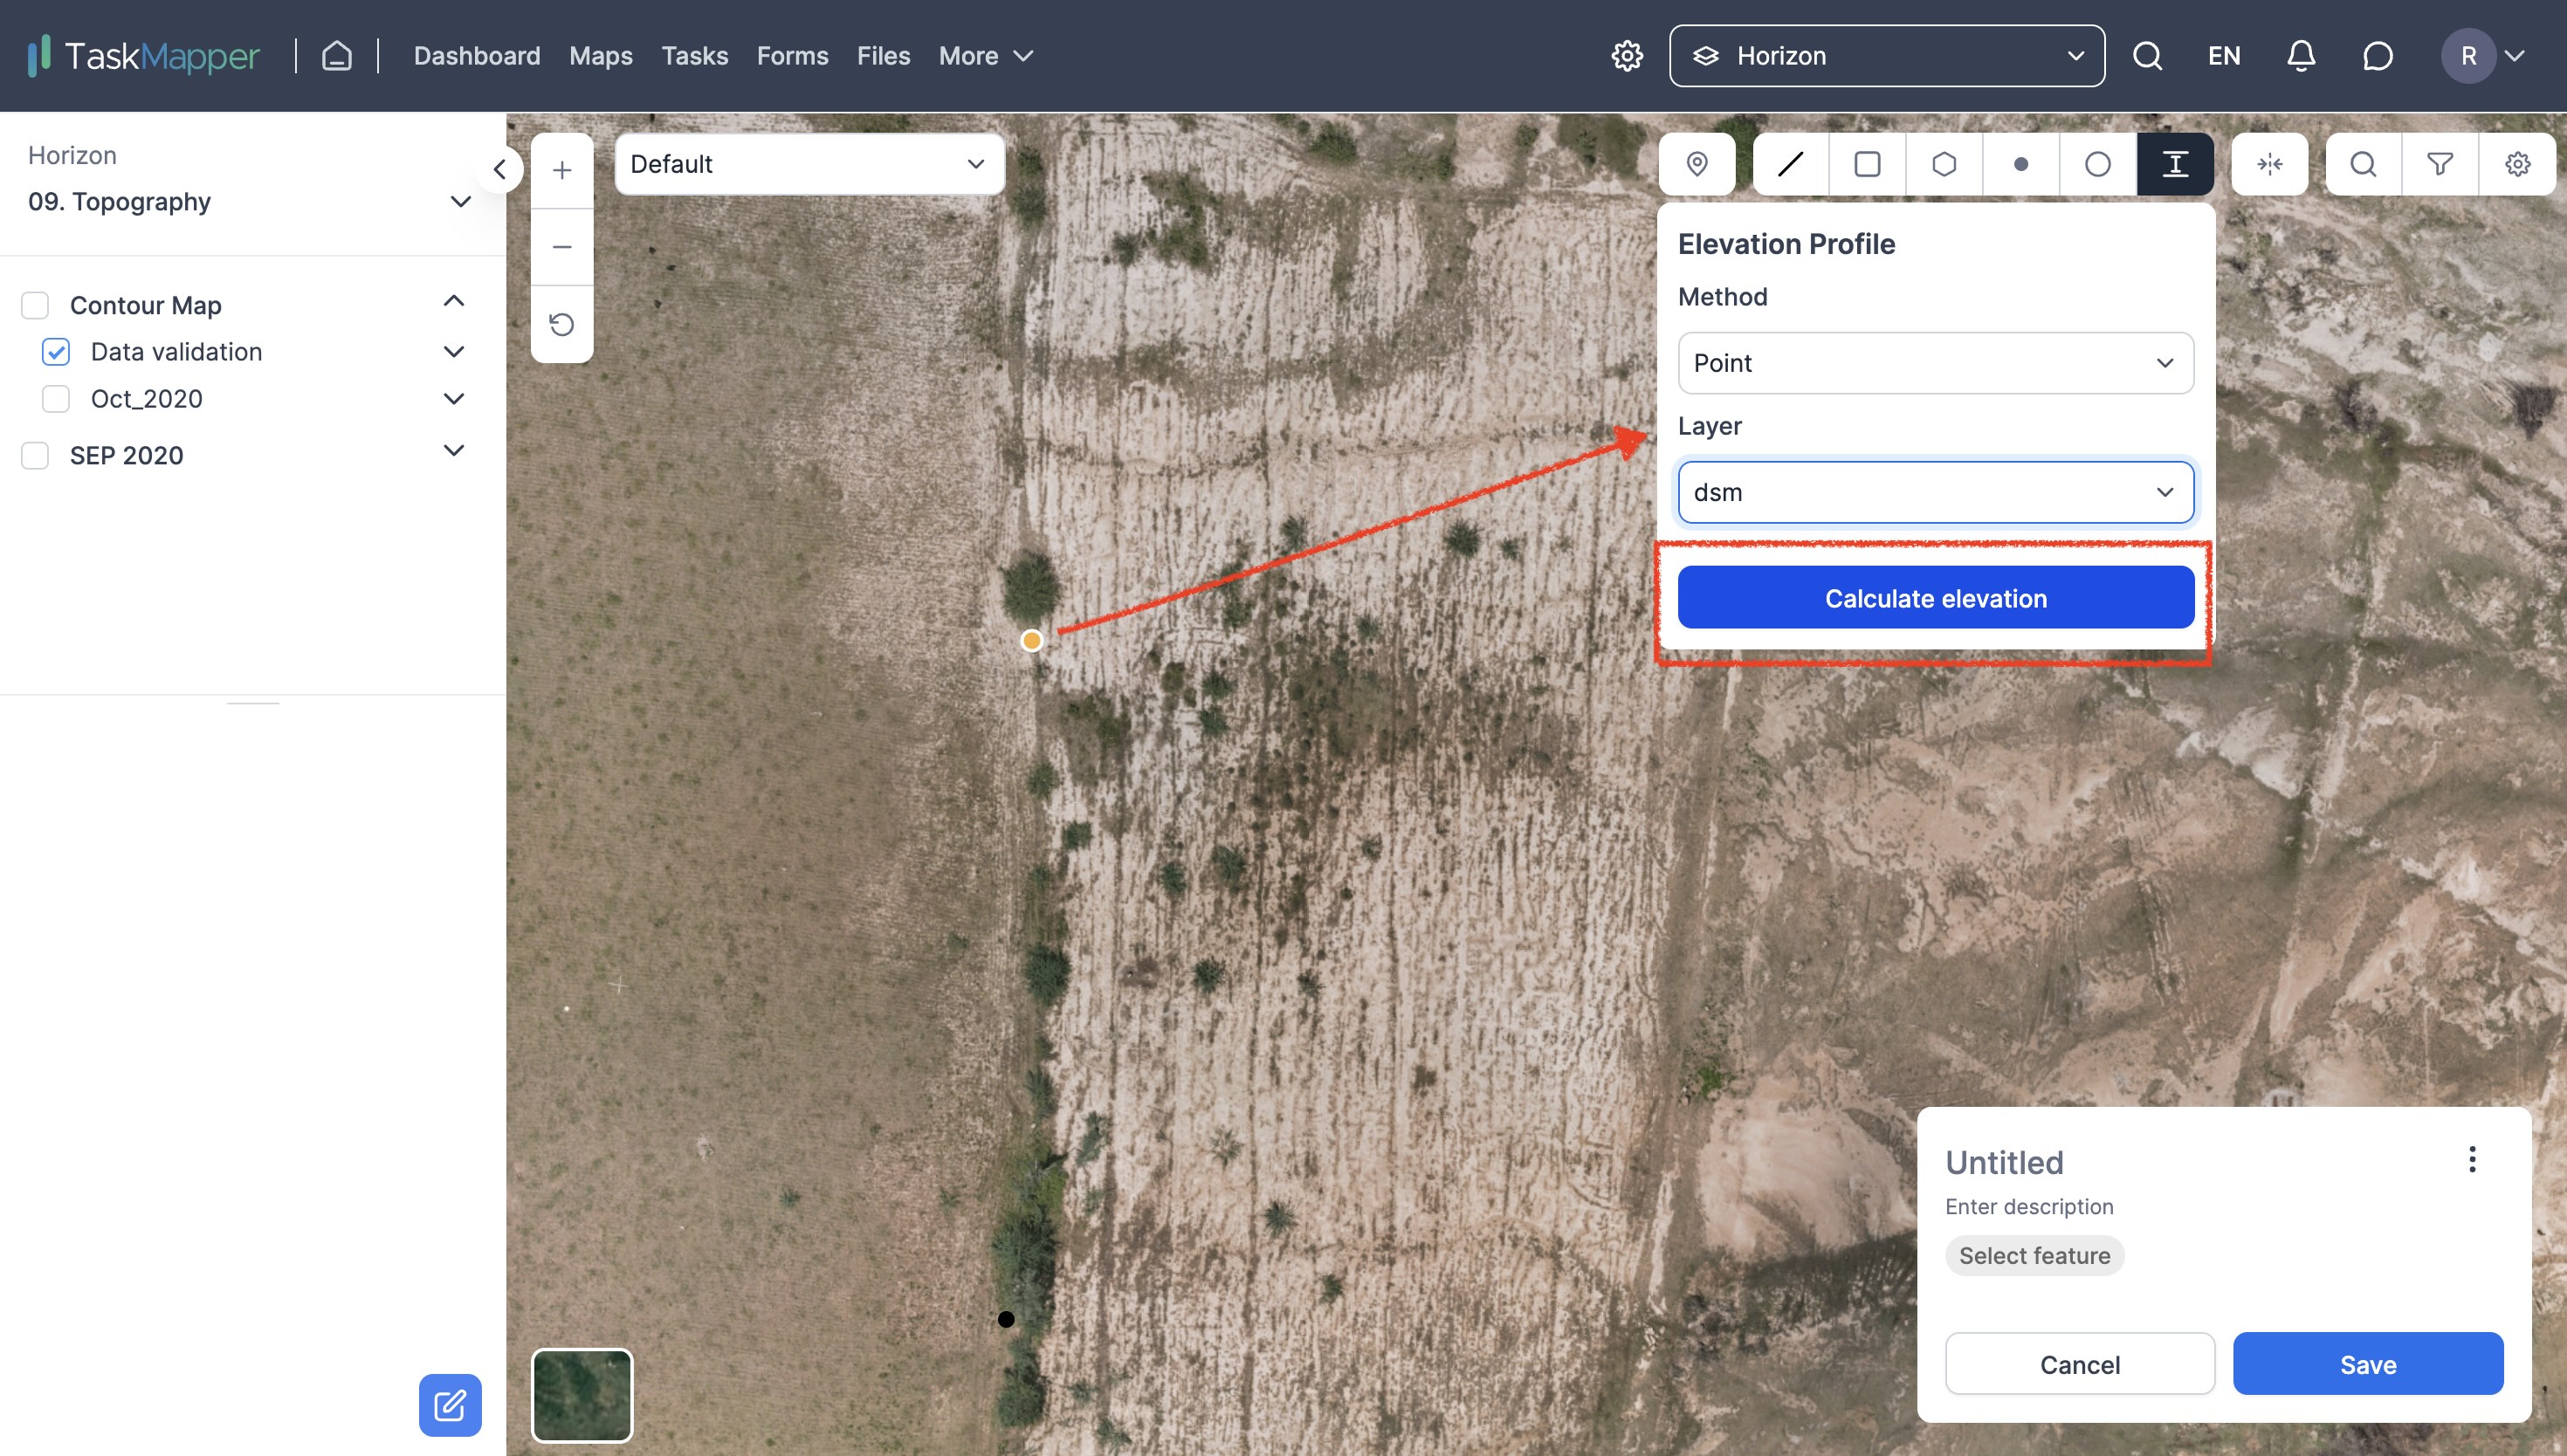
2. In the Elevation Profile dialogue box, select the method parameter as 'Point' and layer as 'DSM'.
FIGURE 7: ELEVATION PROFILE
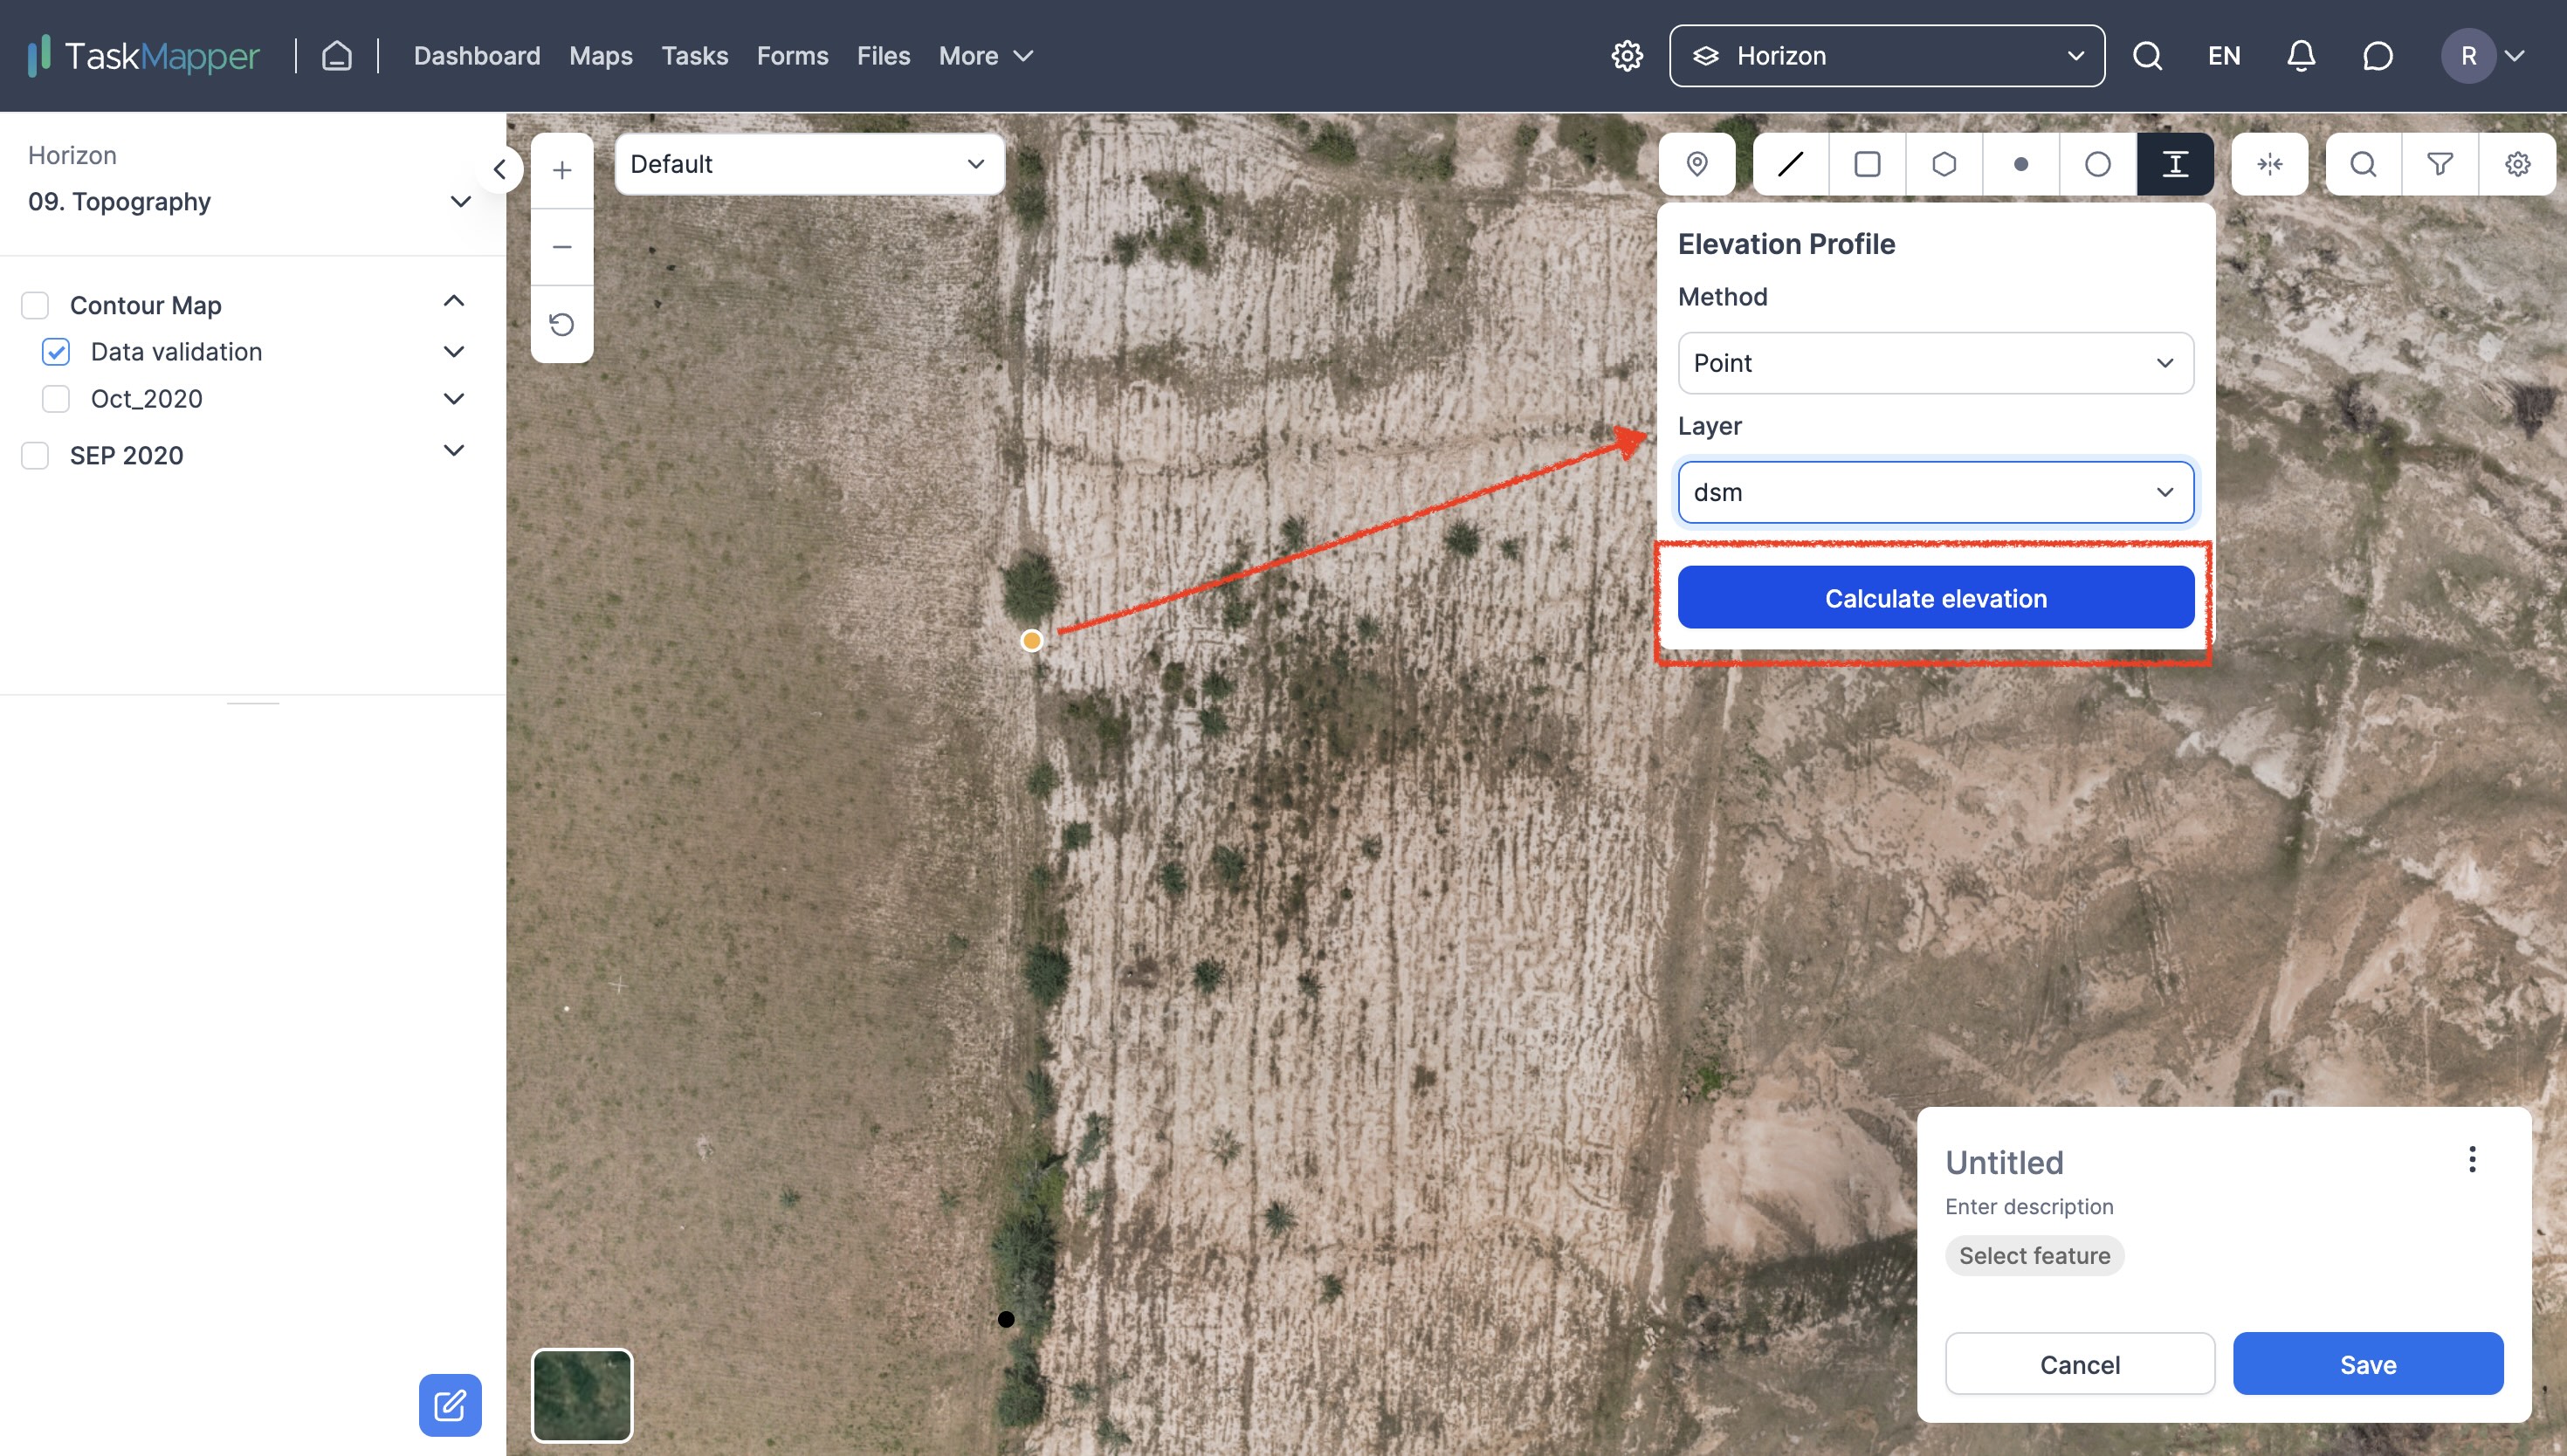
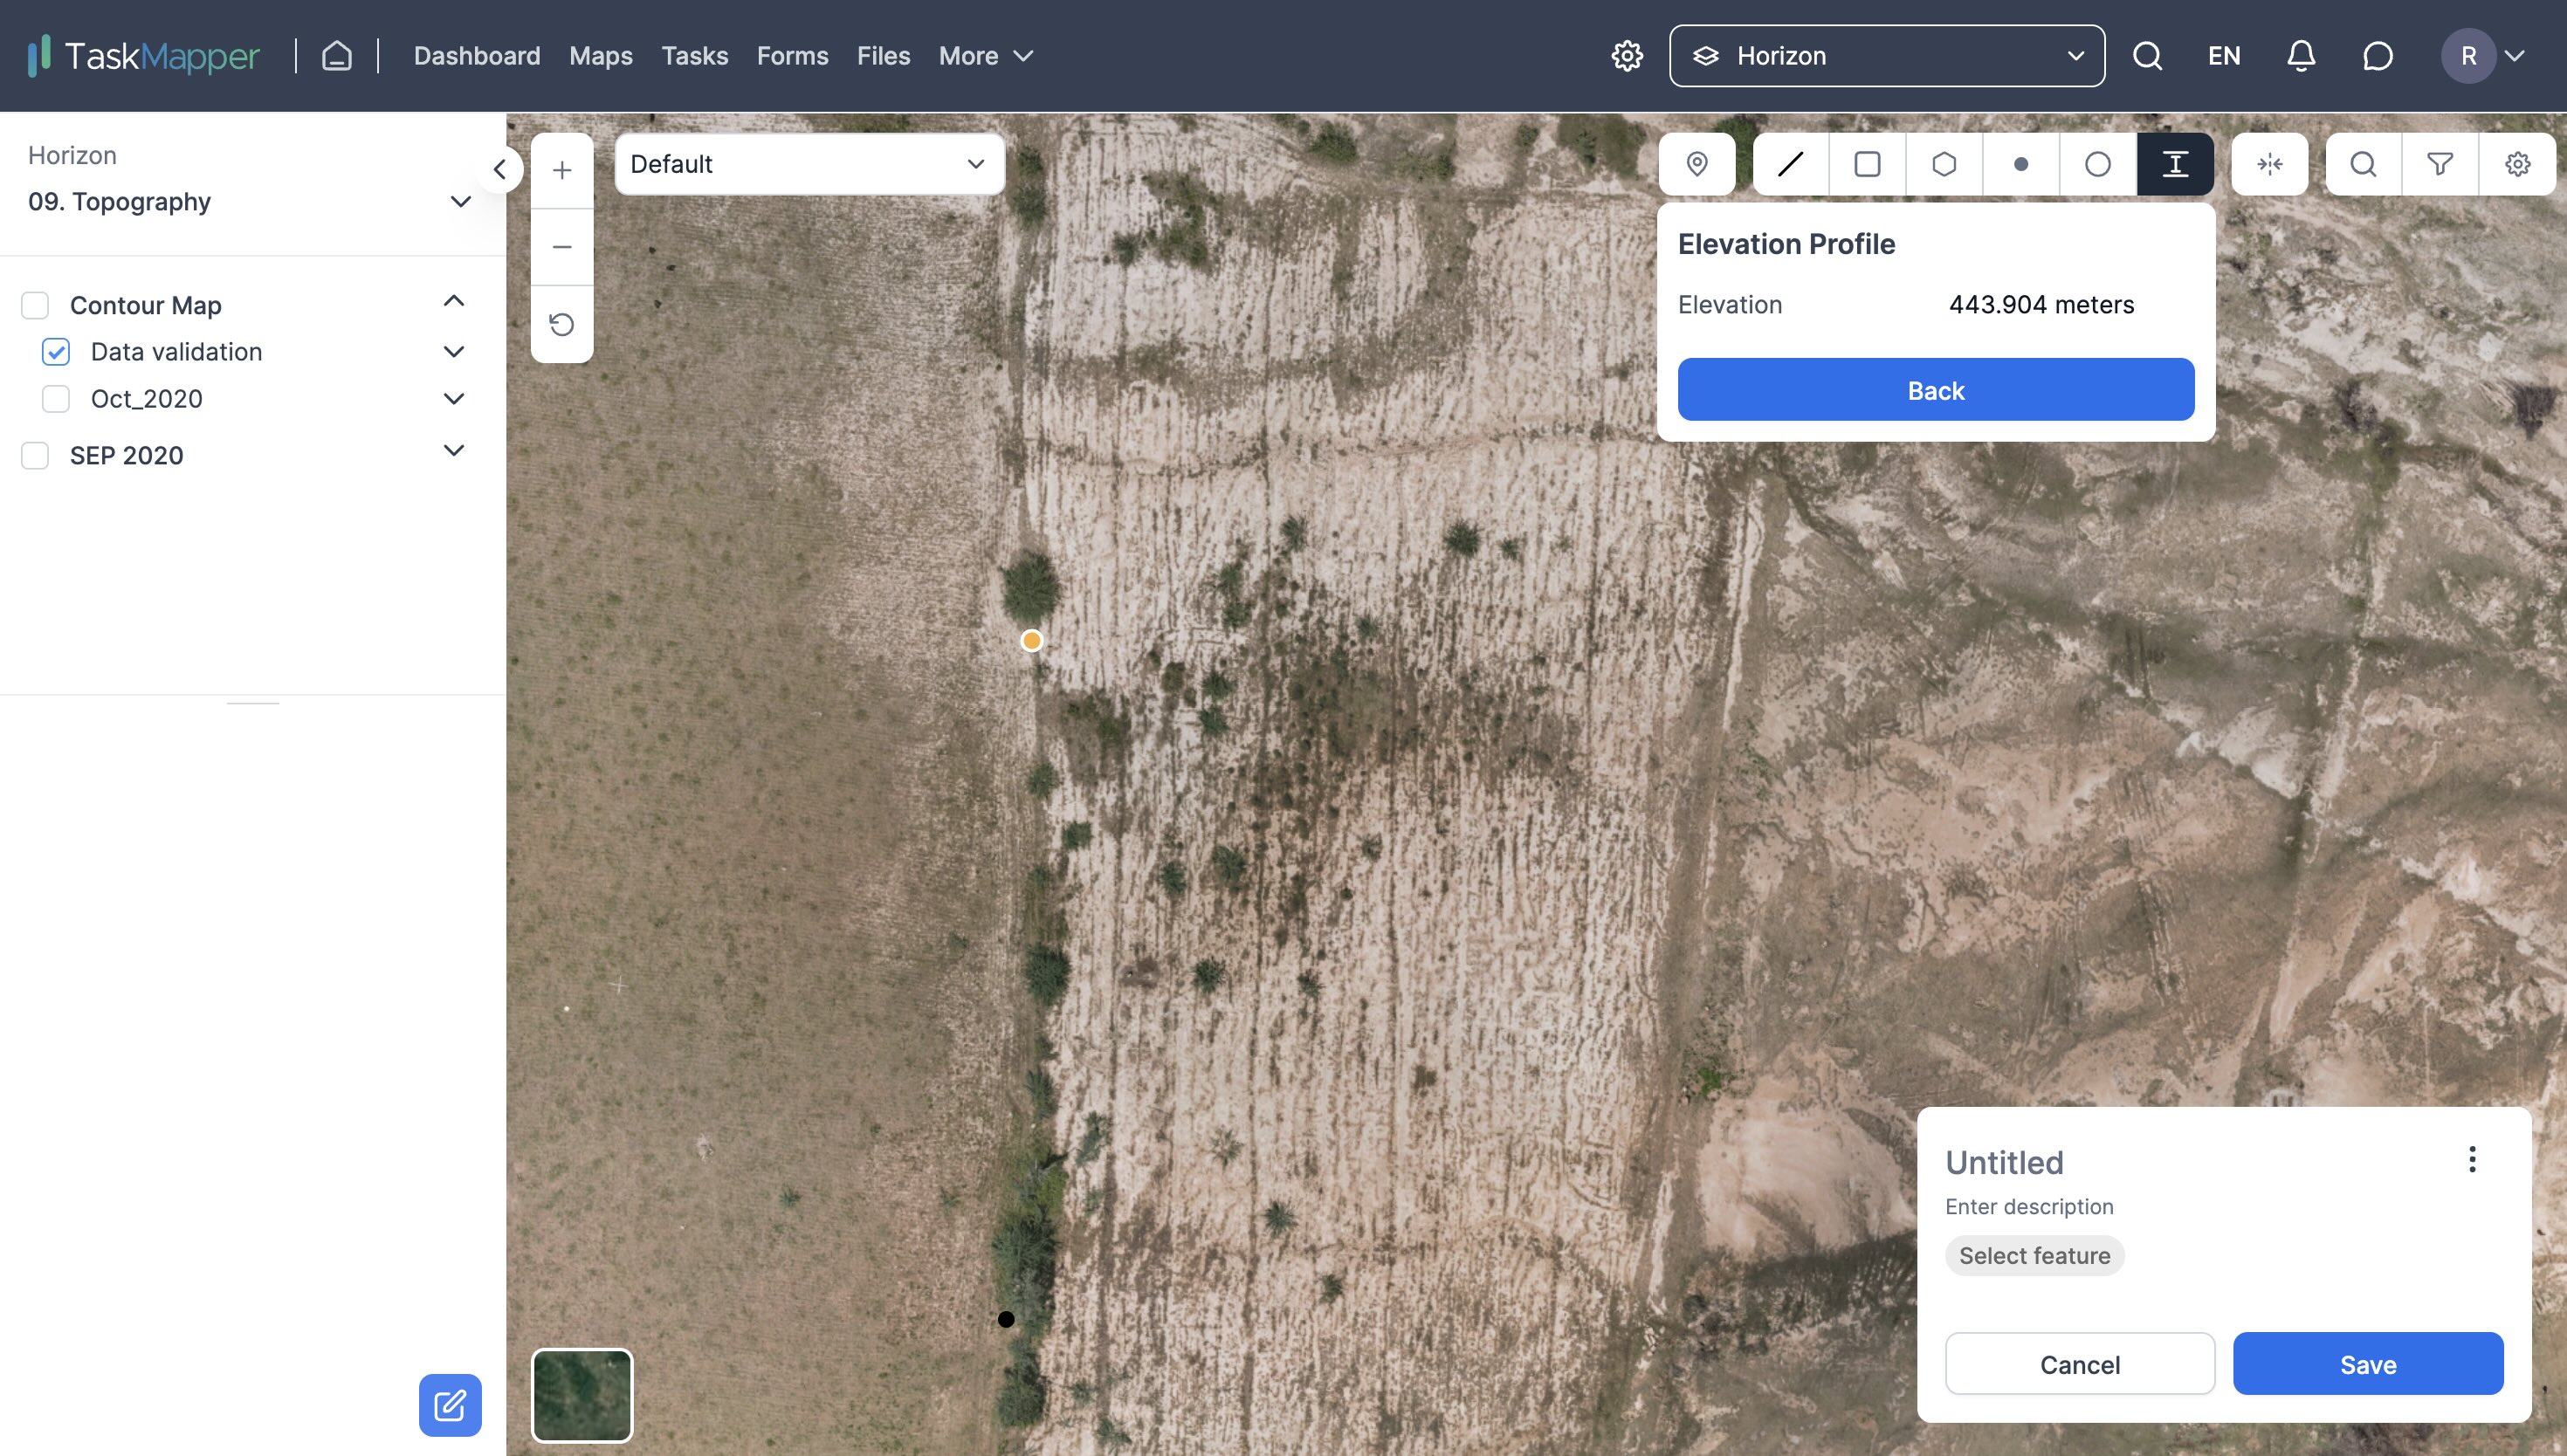
3. Click 'Calculate Elevation' to get the spot elevation results.
FIGURE 8: STEPS TO MEASURE SPOT ELEVATION
Volume Calculations
Volume calculations give accurate results for the volume of an area. The area of cutting and filling is found for each section with the polygon or net area calculation method. The volume is determined by multiplying the average area with the distance between sections.
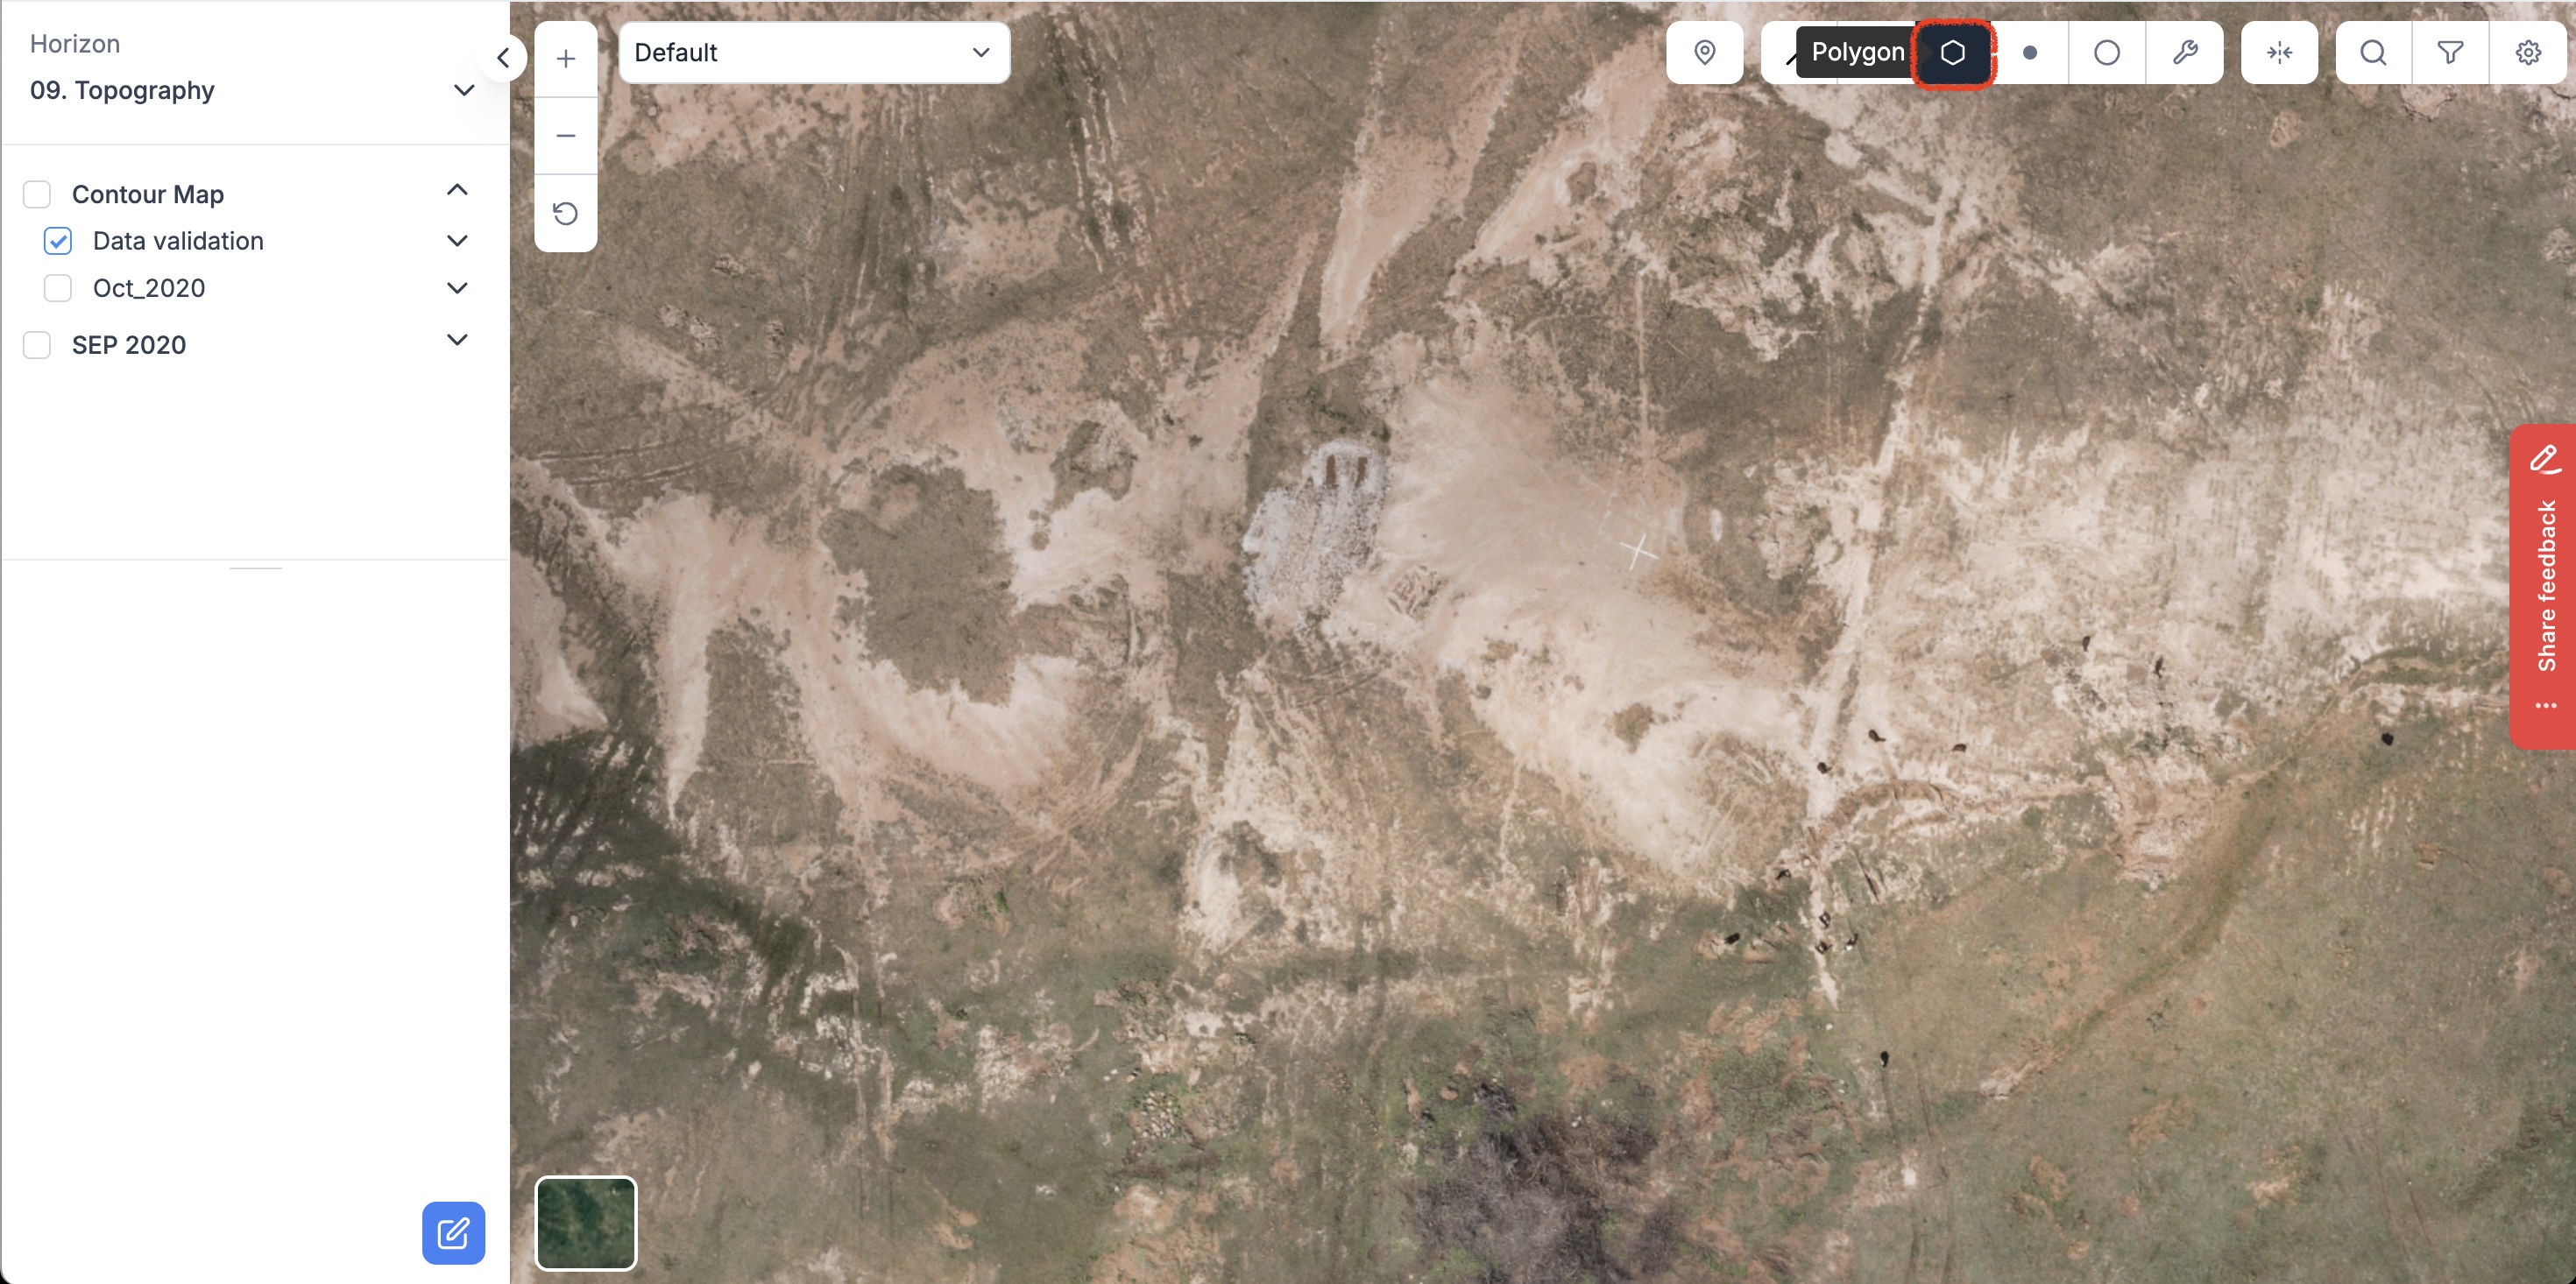
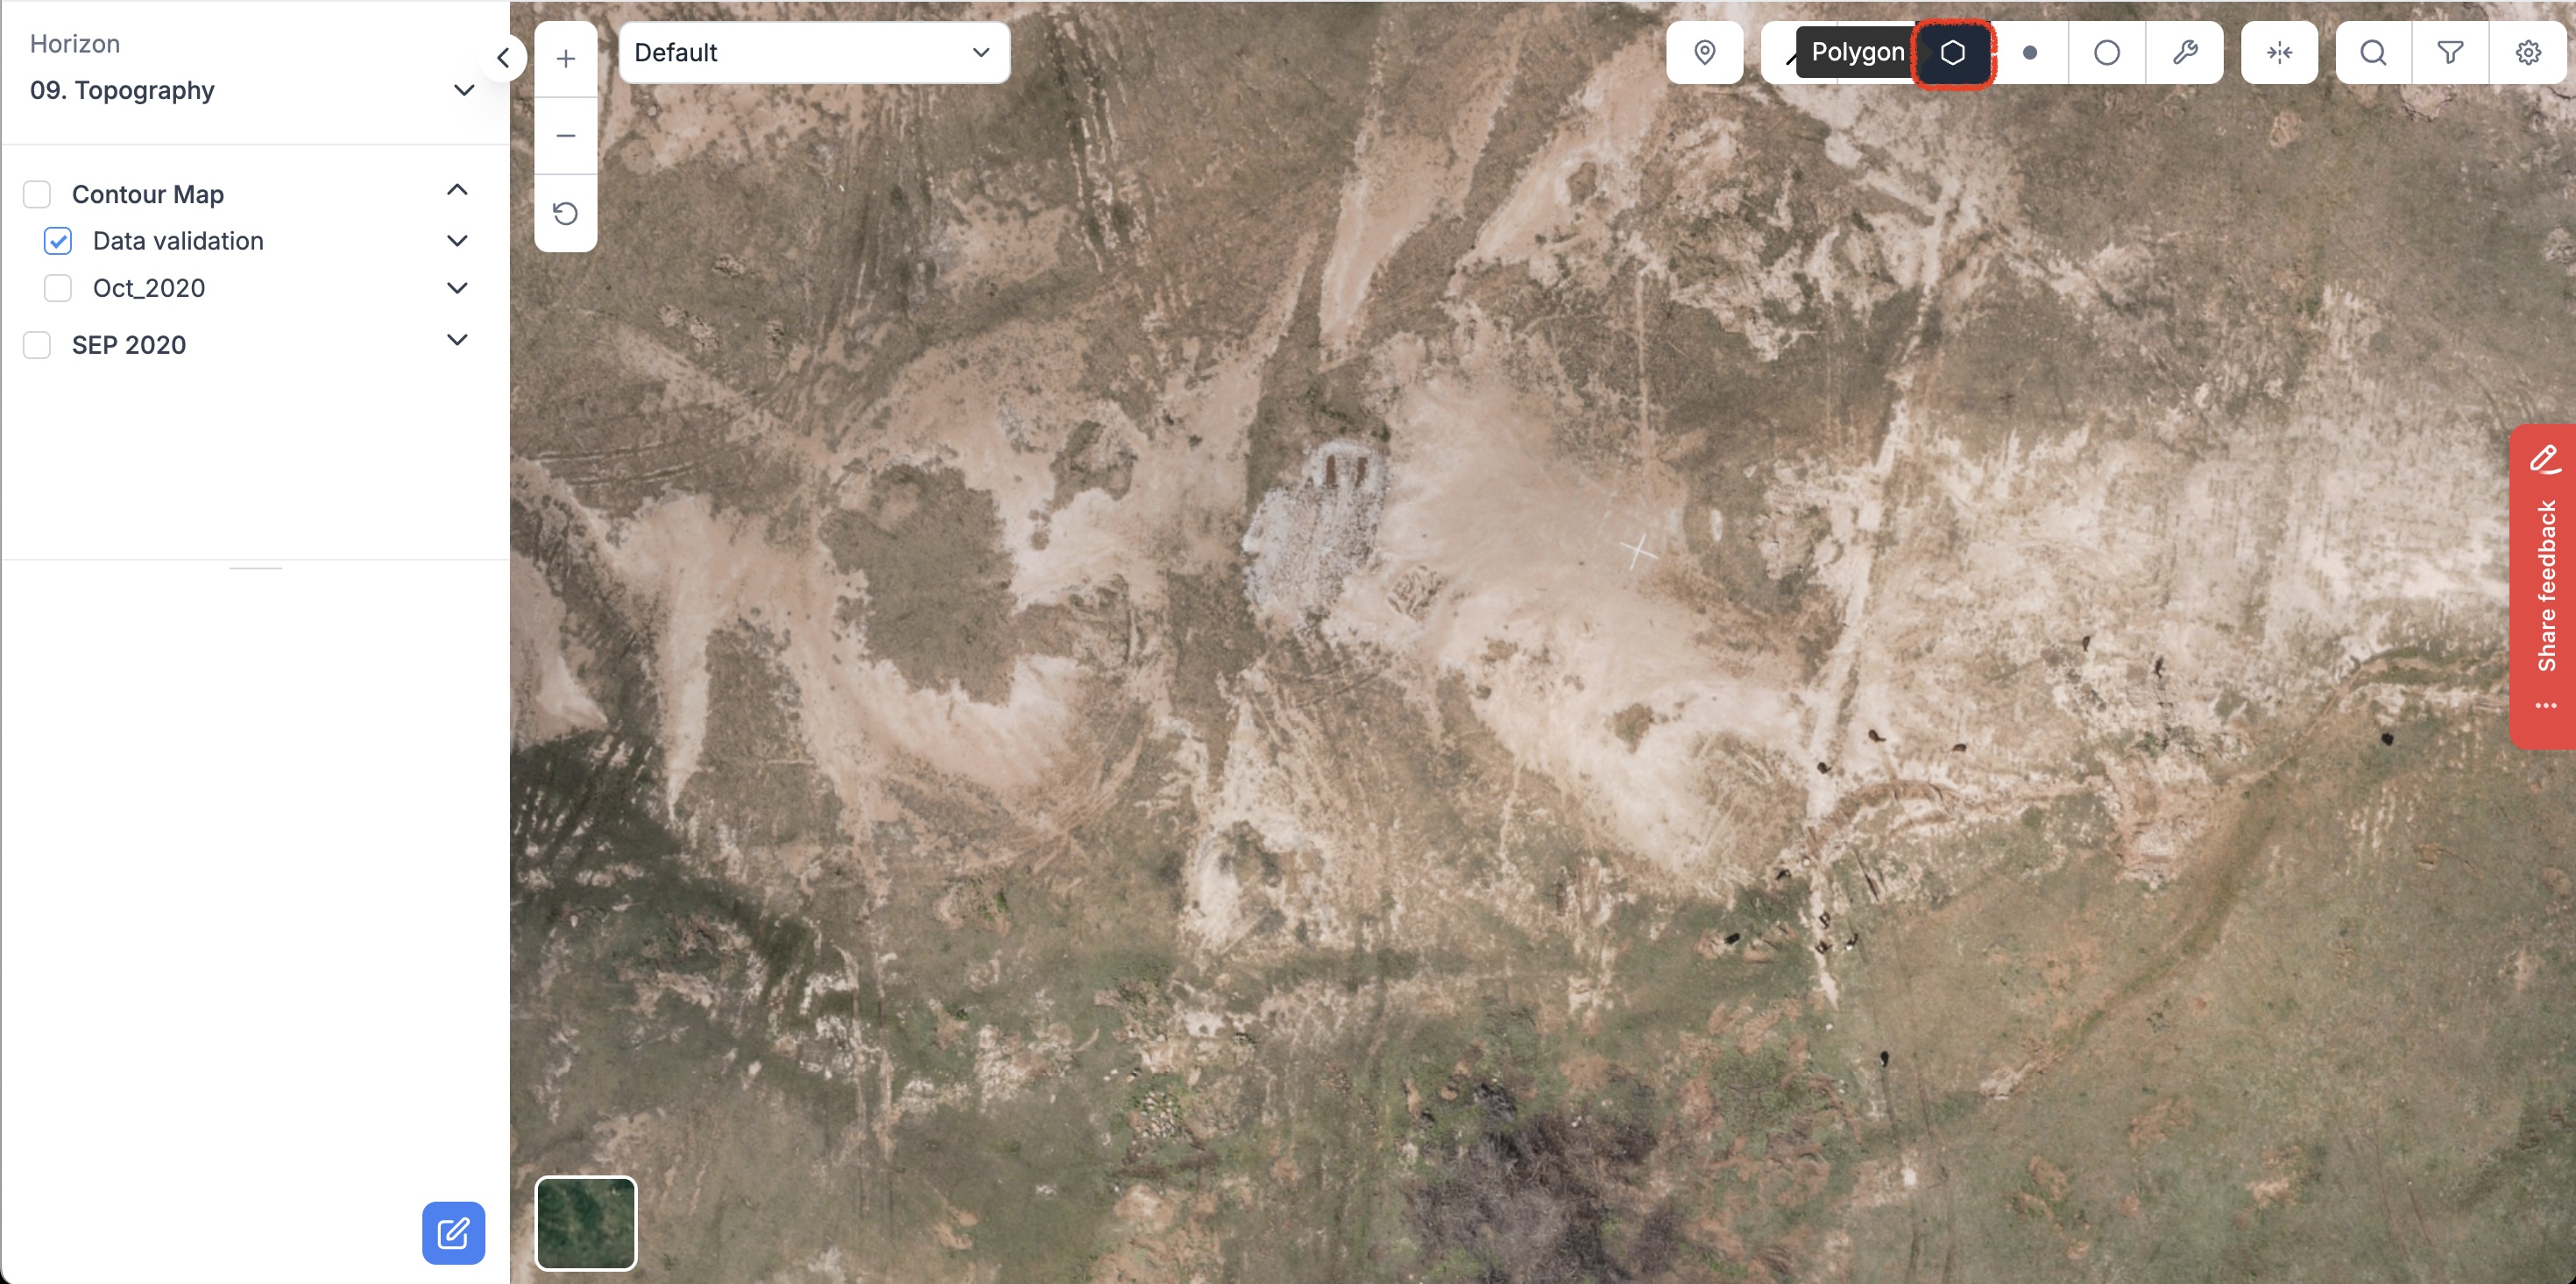
1. To begin calculating the volume of an area, select the polygon tool from the toolbox and draw the area on the map.
FIGURE 9: POLYGON MARKER TOOL
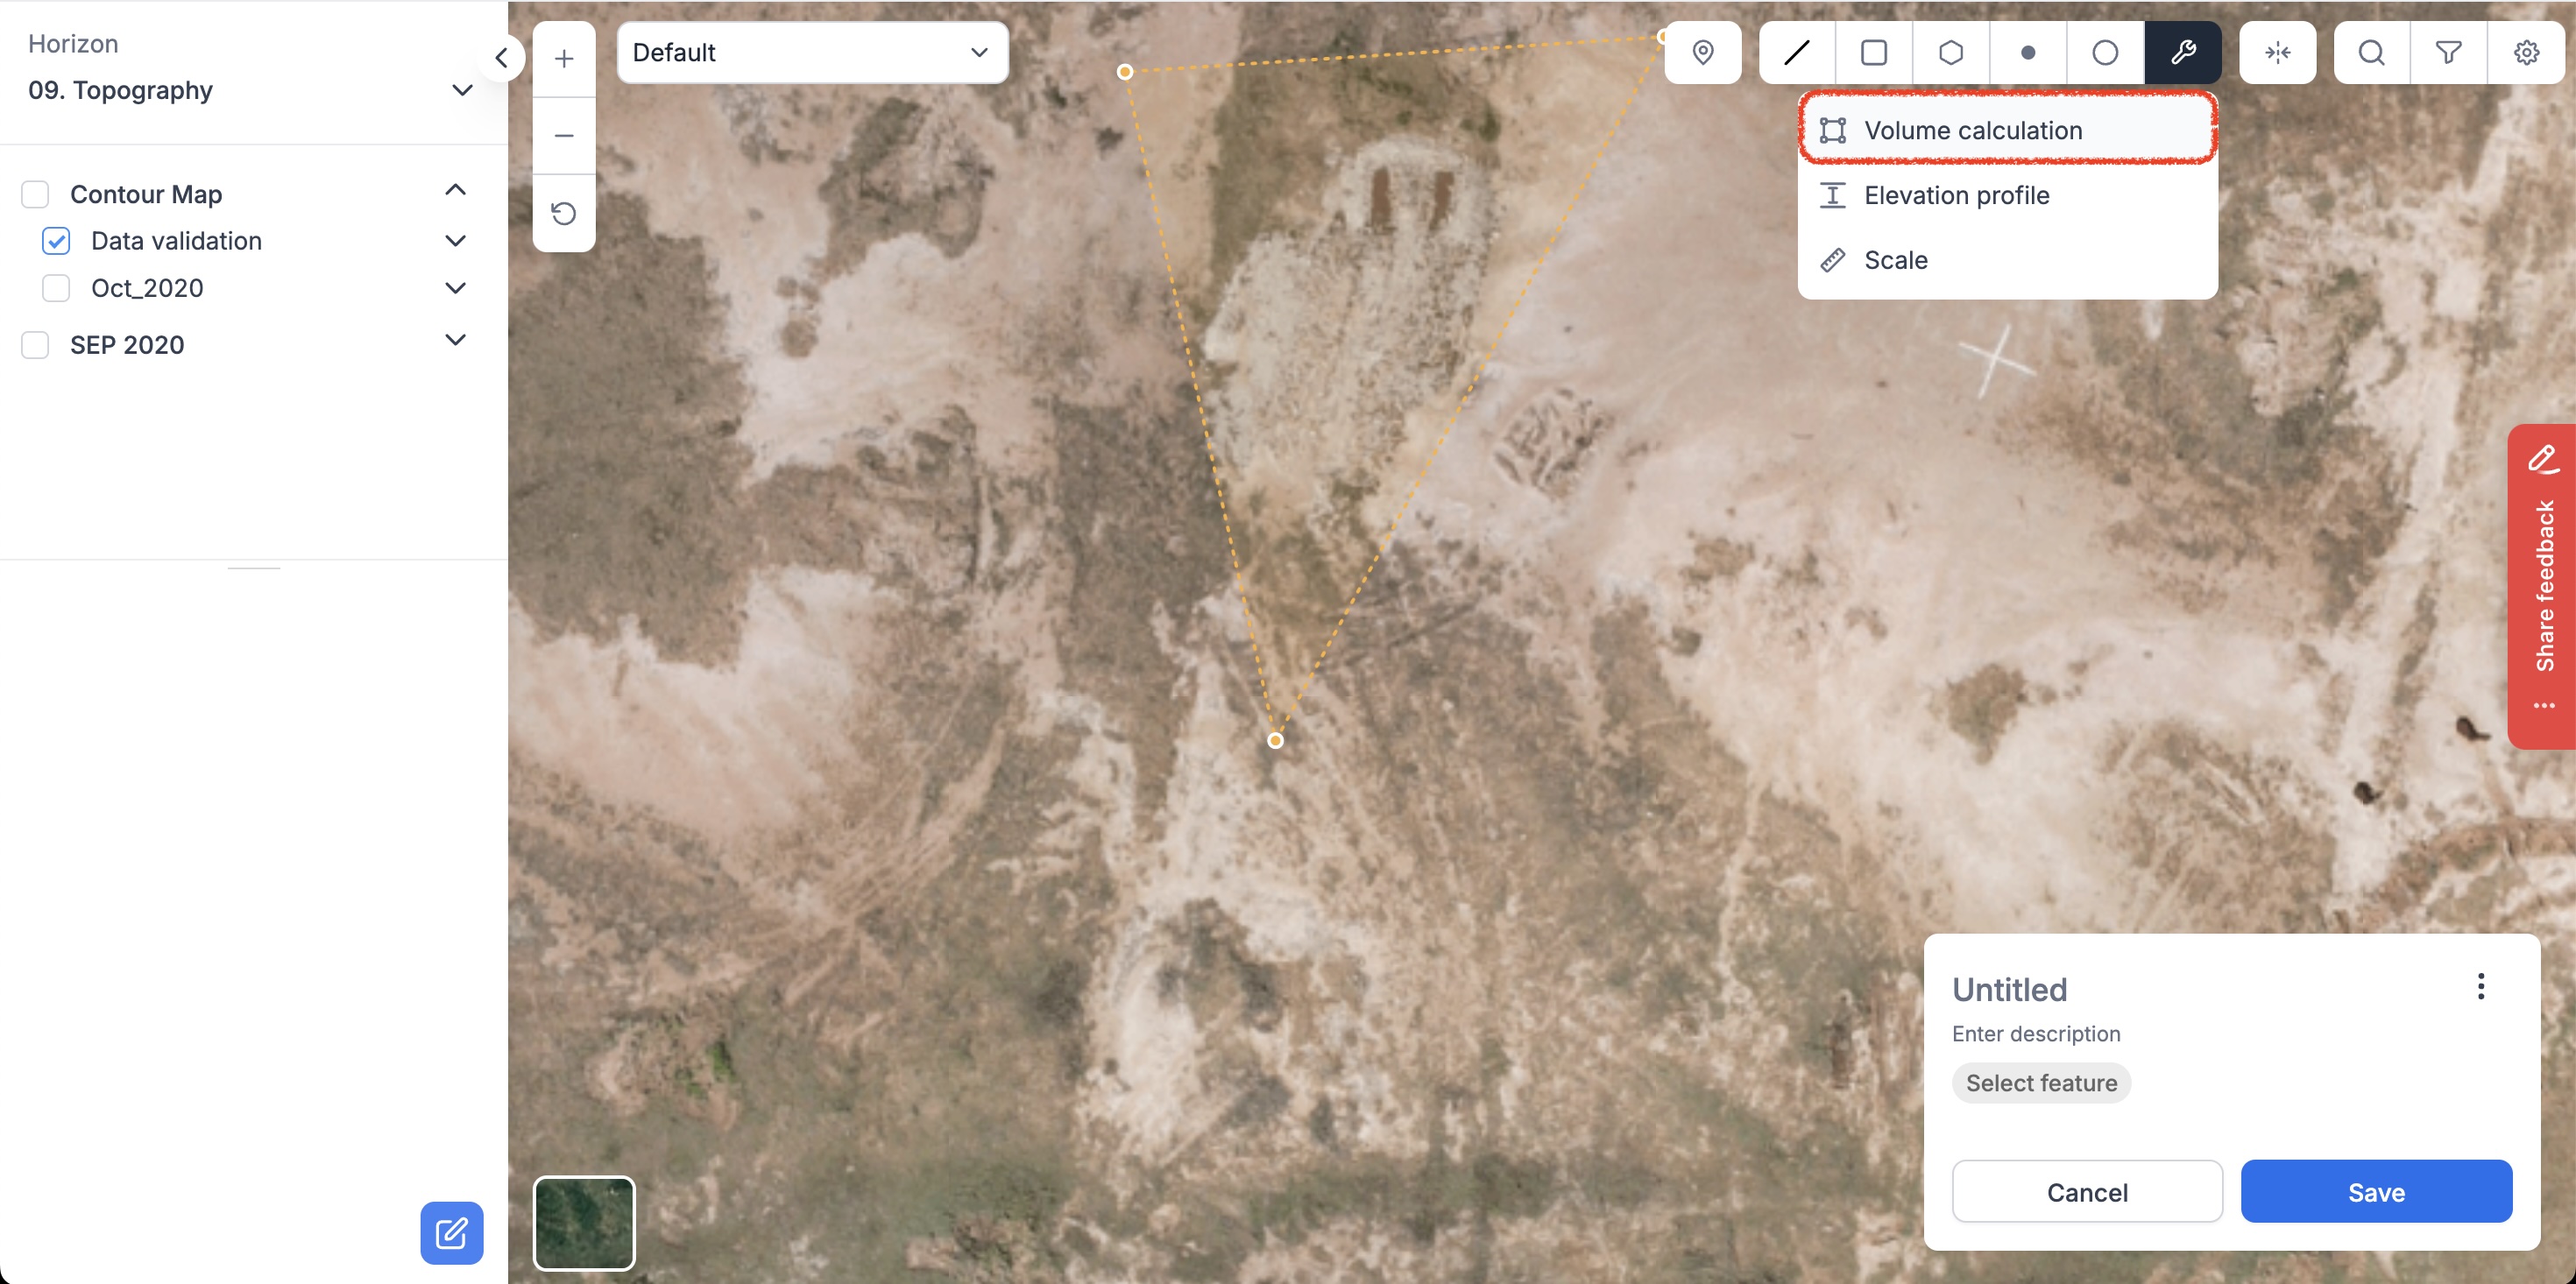
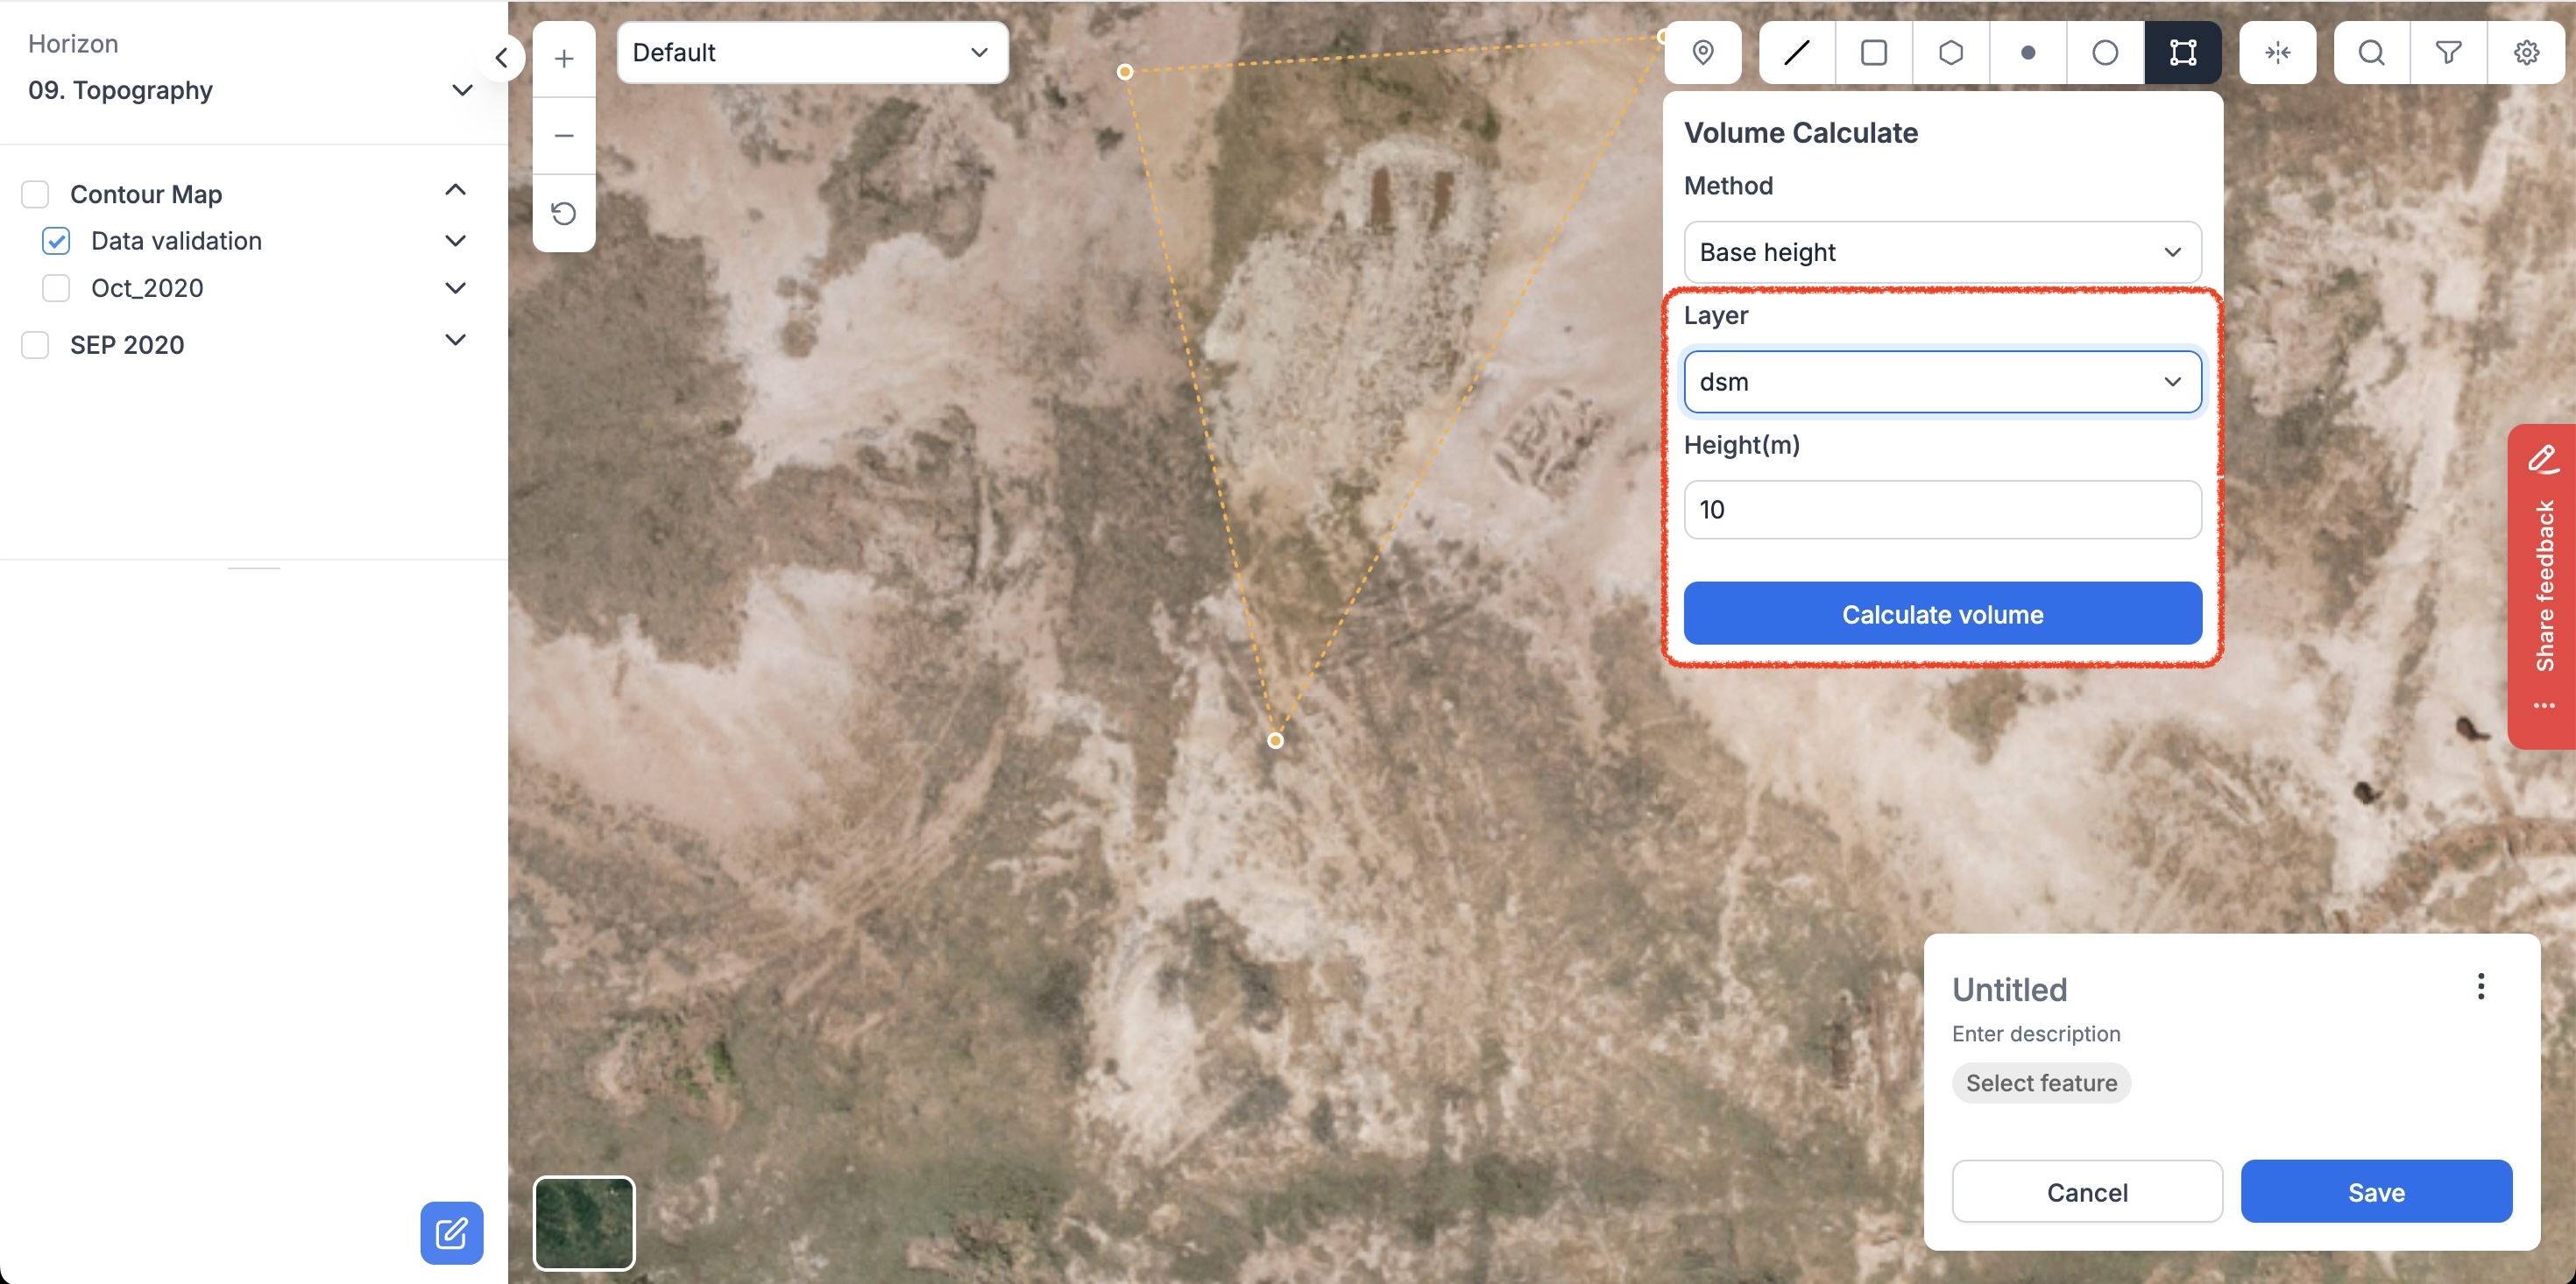
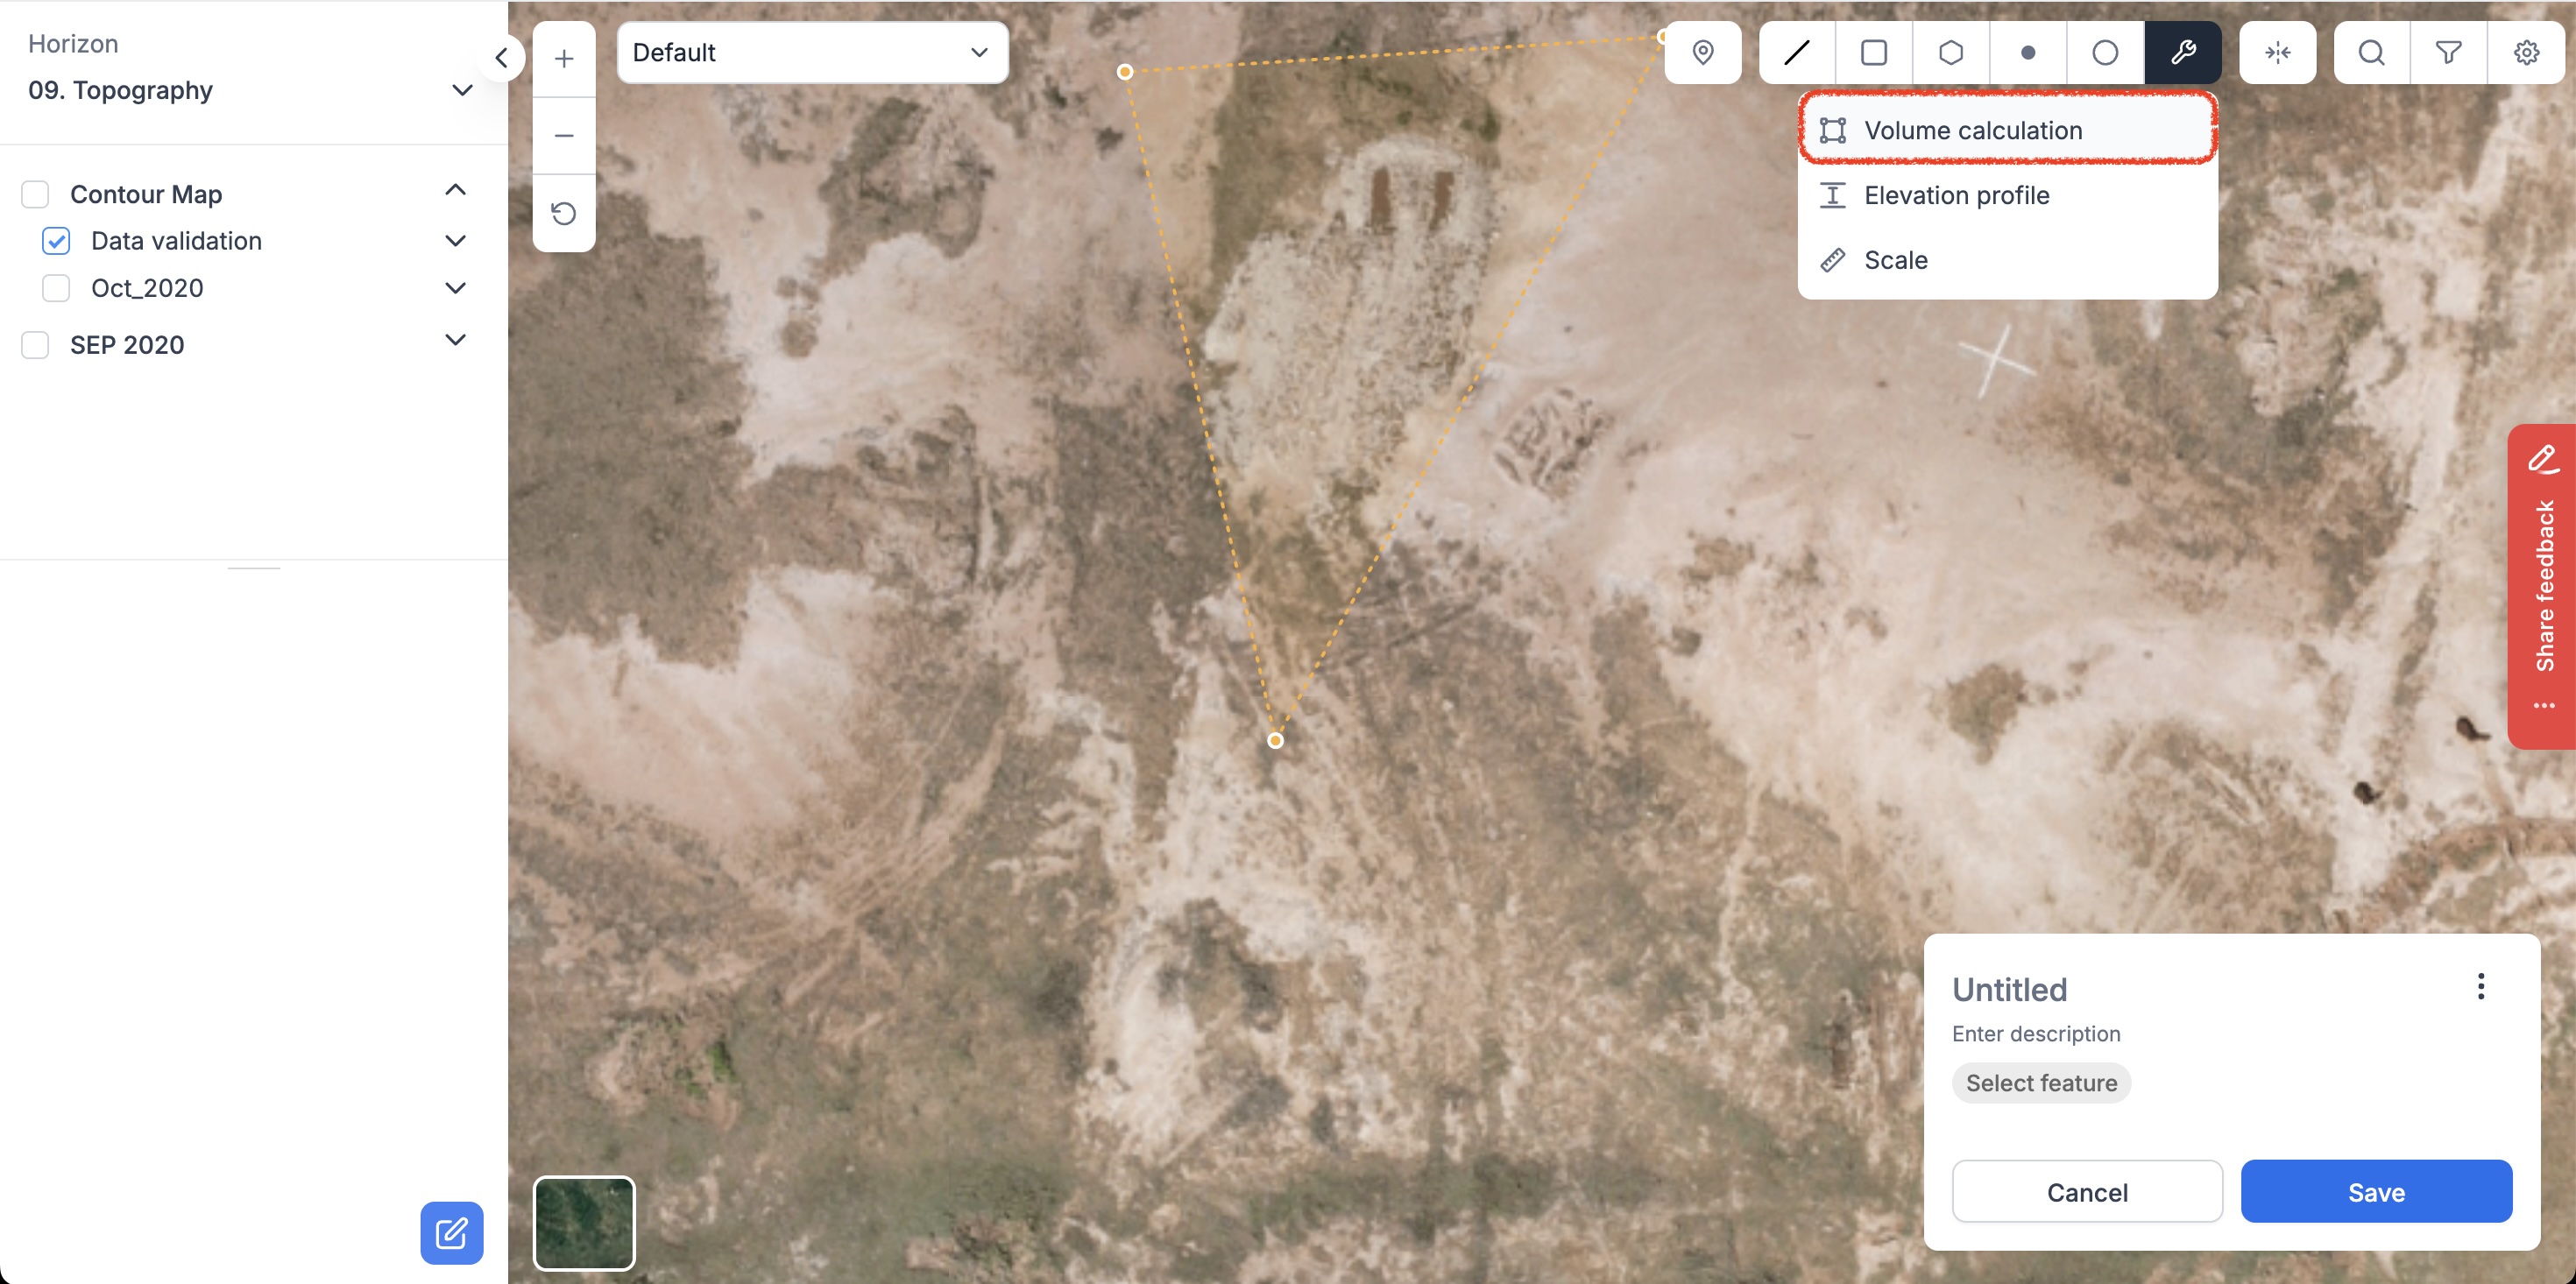
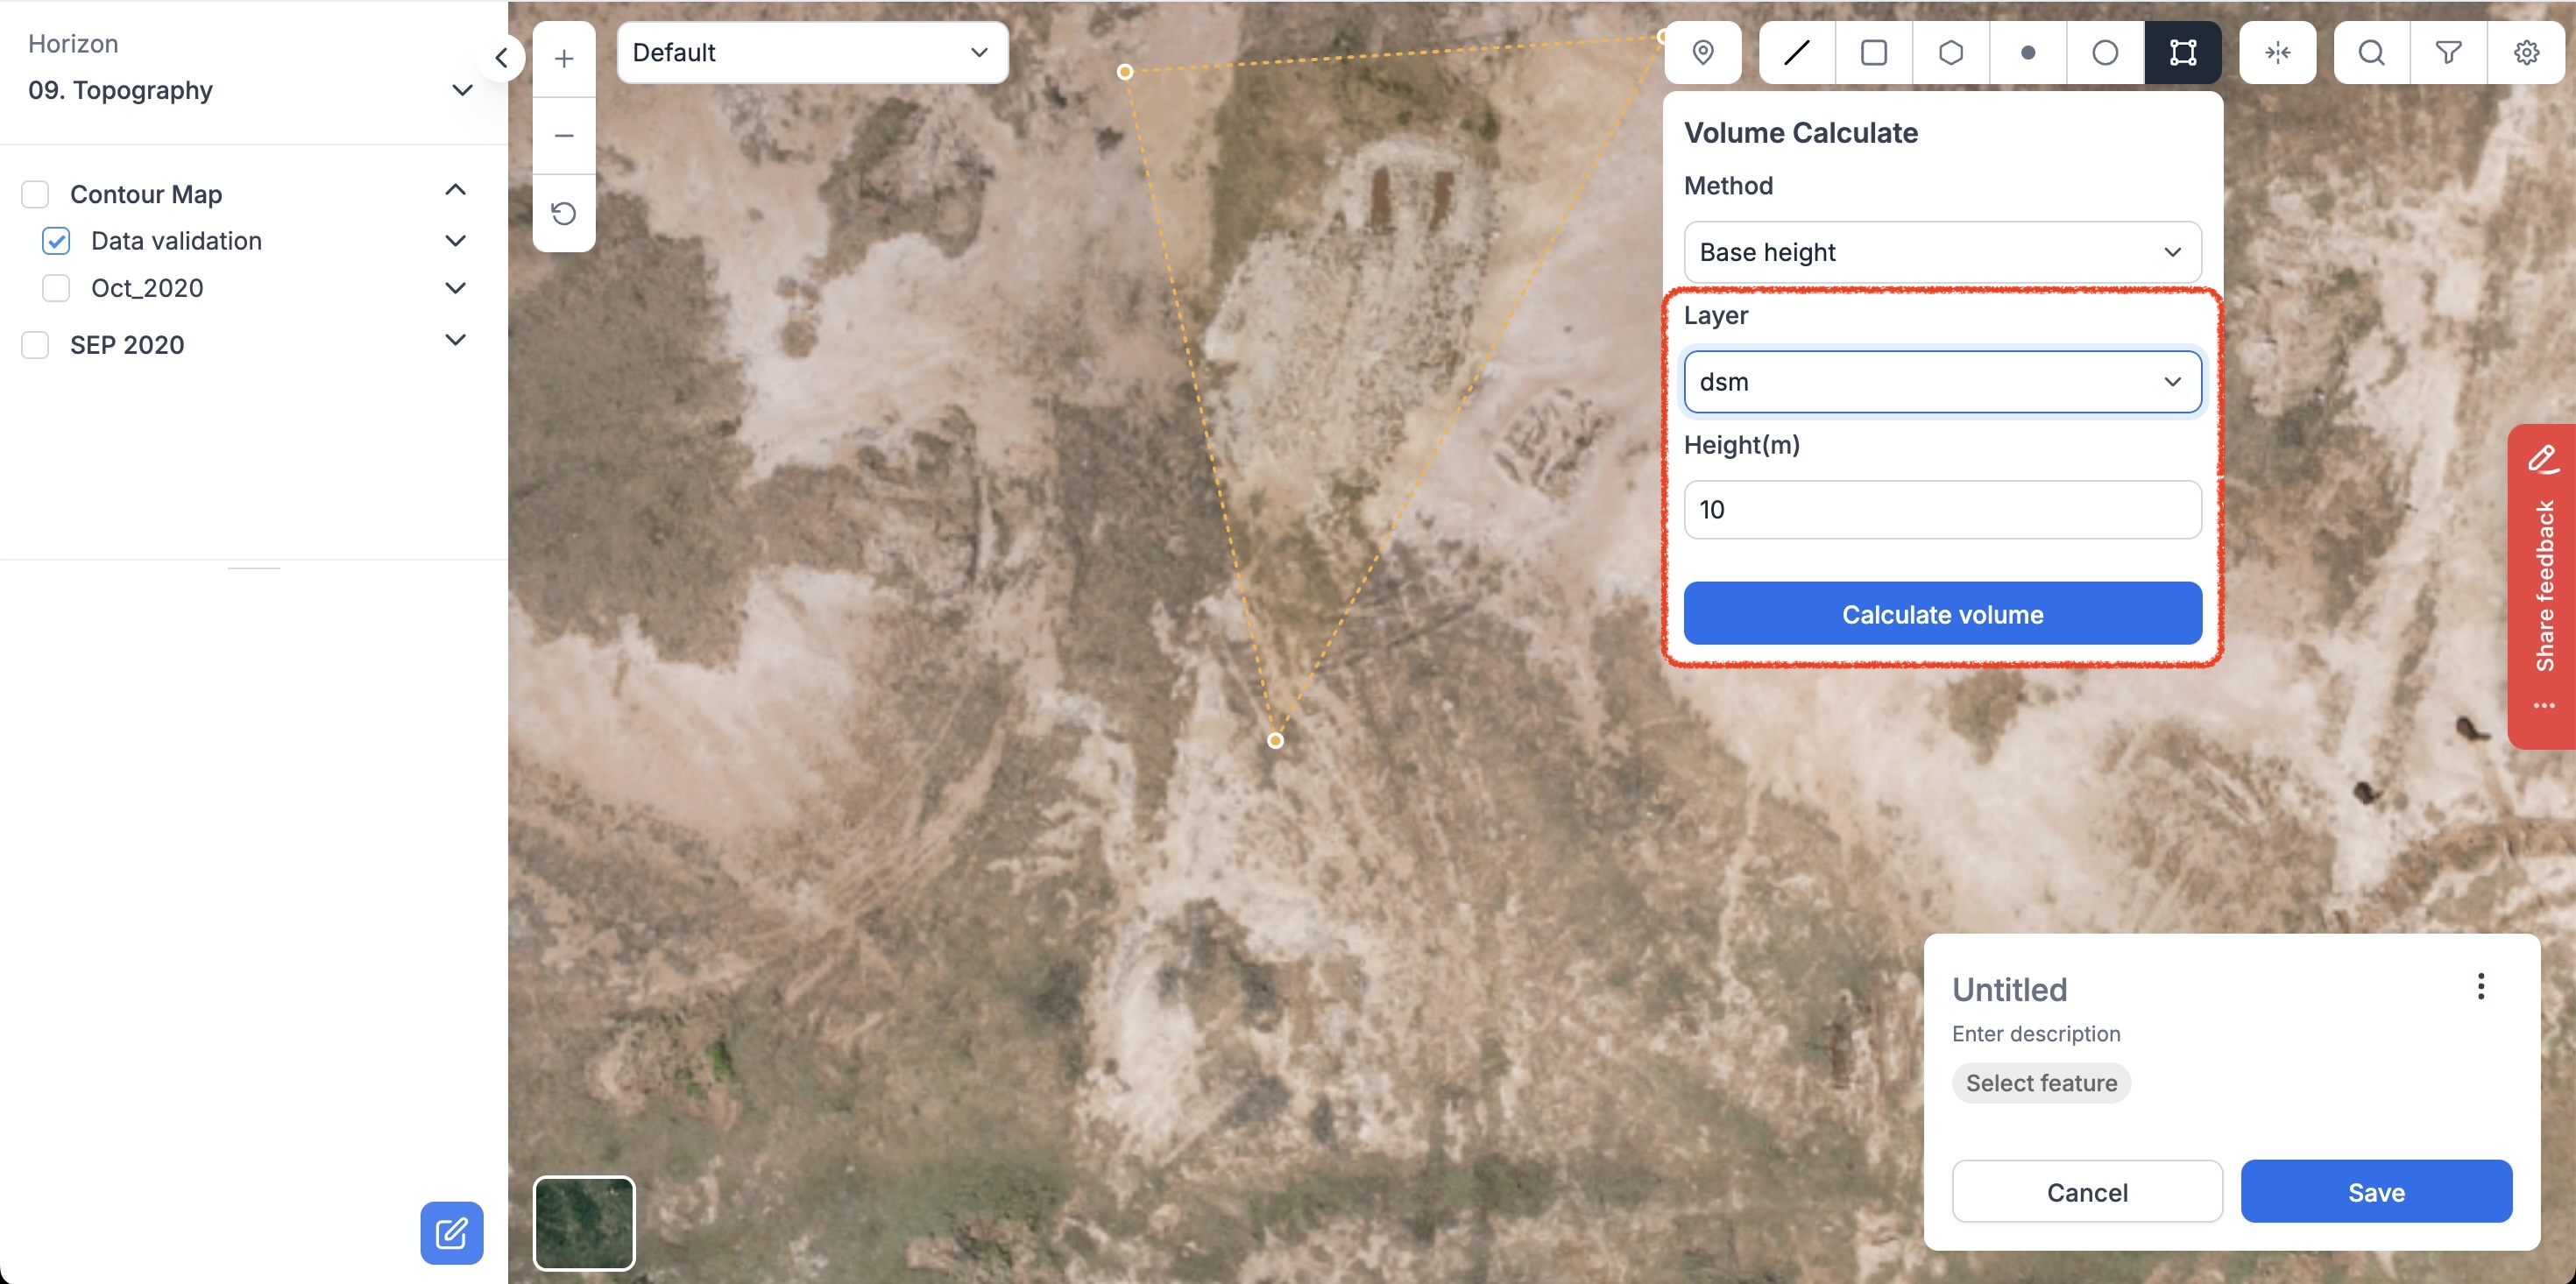
2. Click on the area and select 'Elevation Profile' from the toolbox. Select the method parameter as 'Base Height' and layer as 'DSM' in the dialogue box.
FIGURE 10: STEPS FOR VOLUME CALCULATION
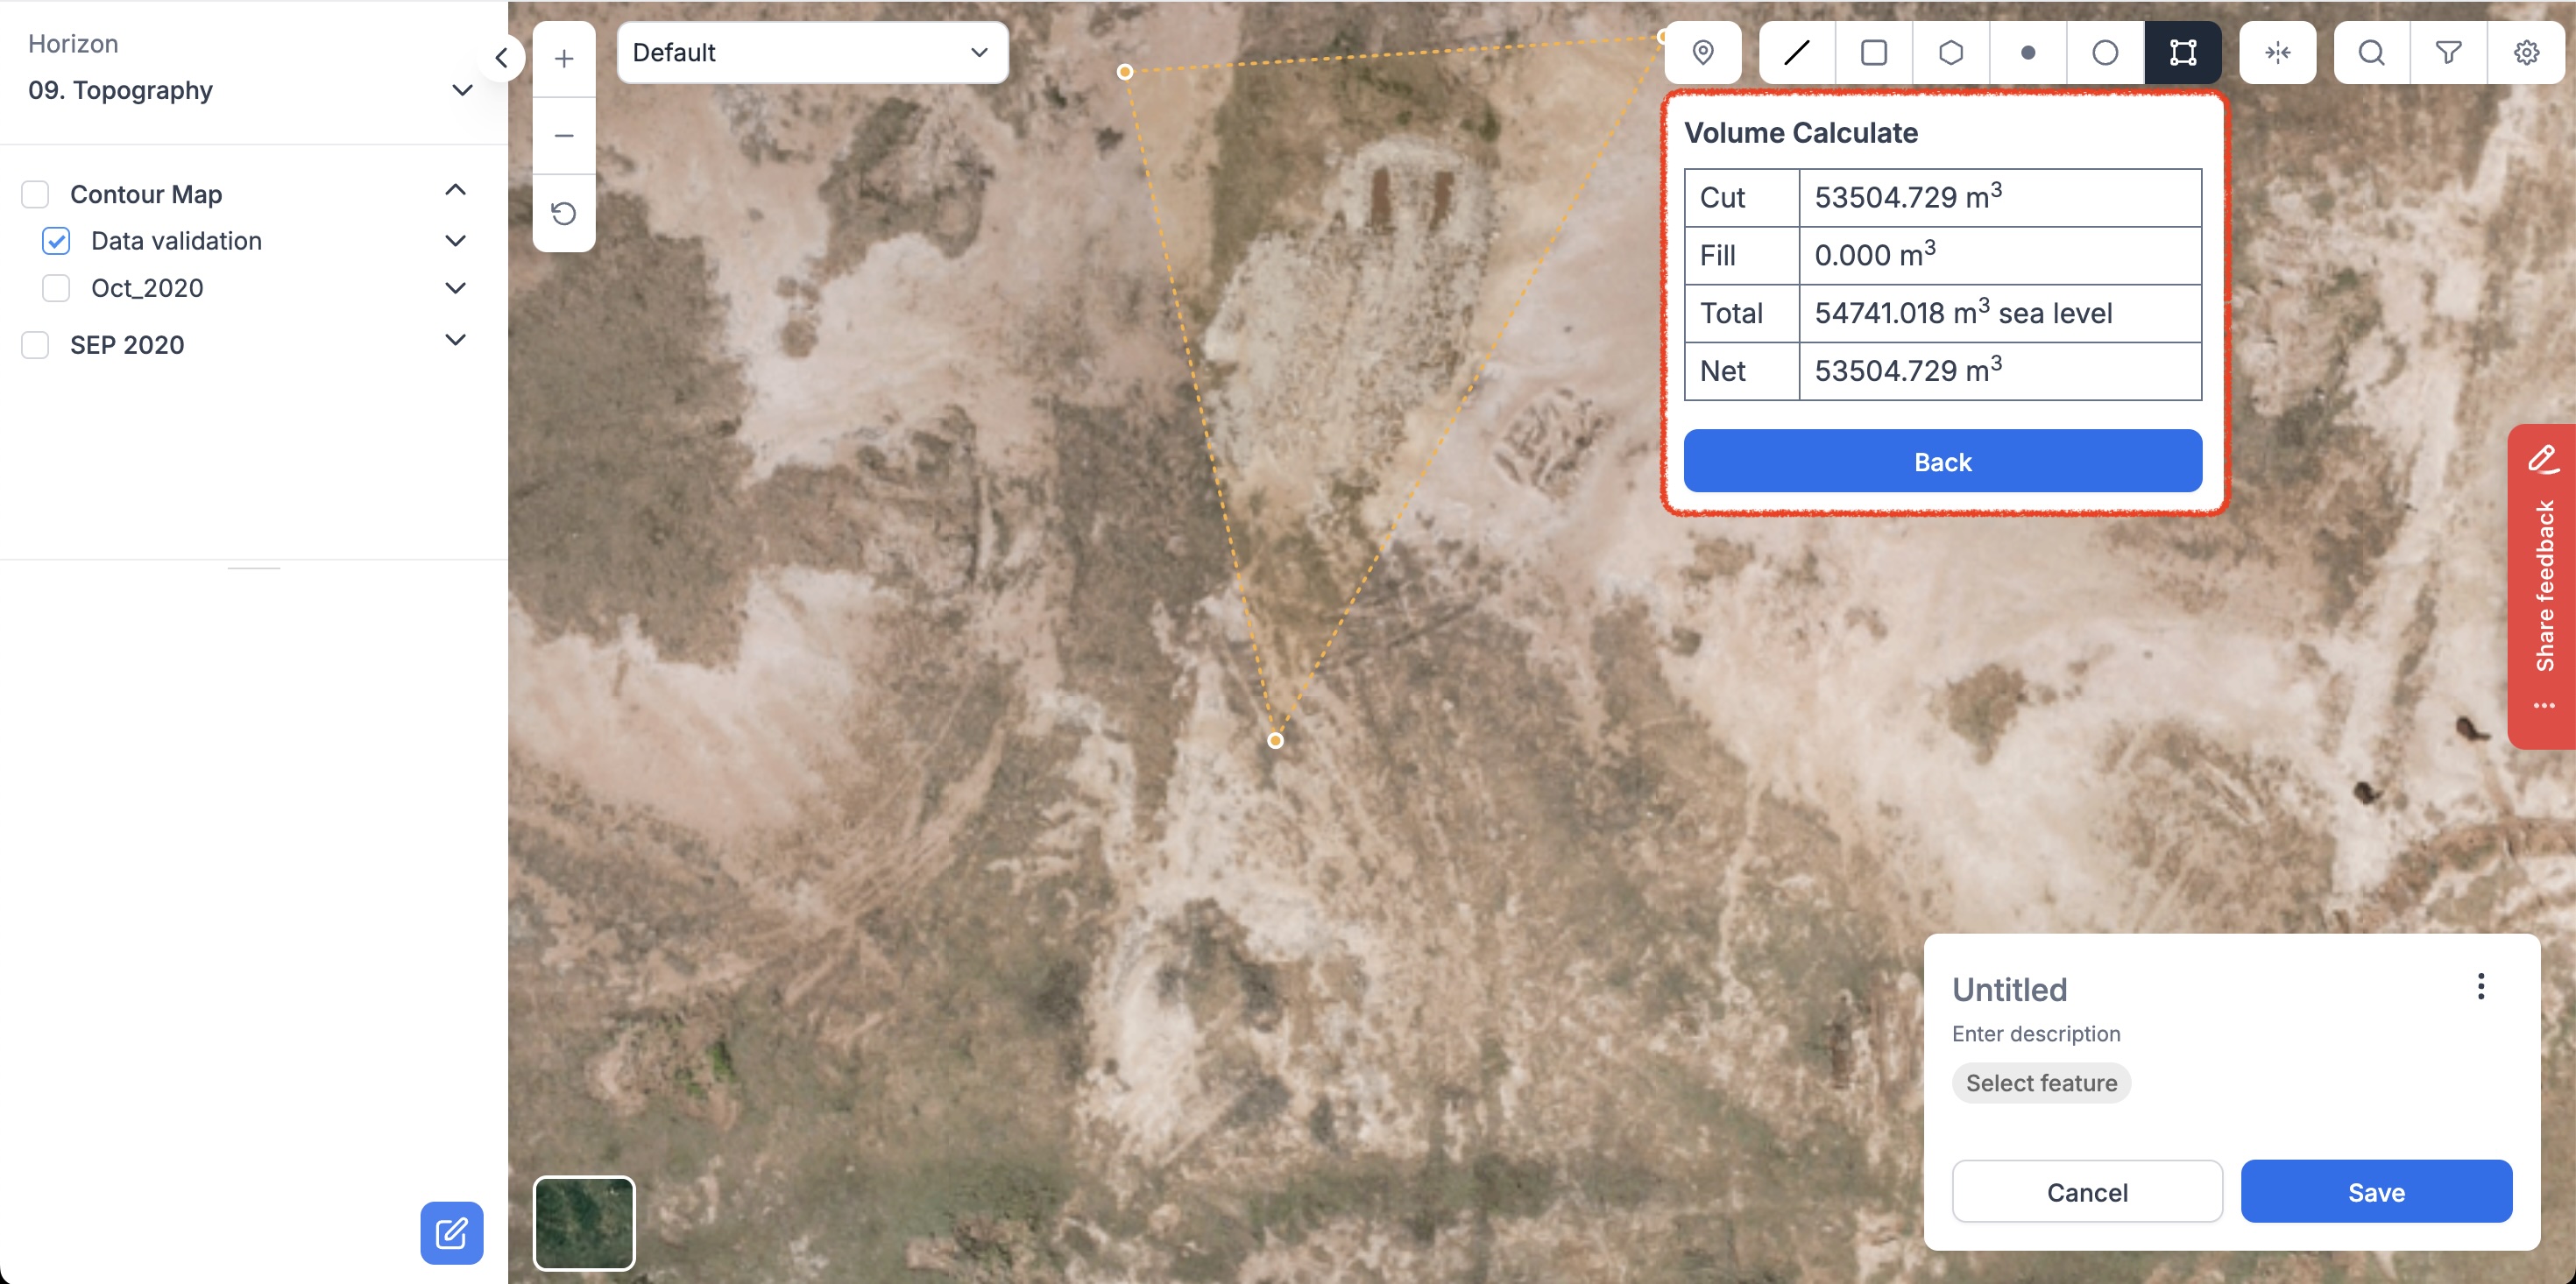
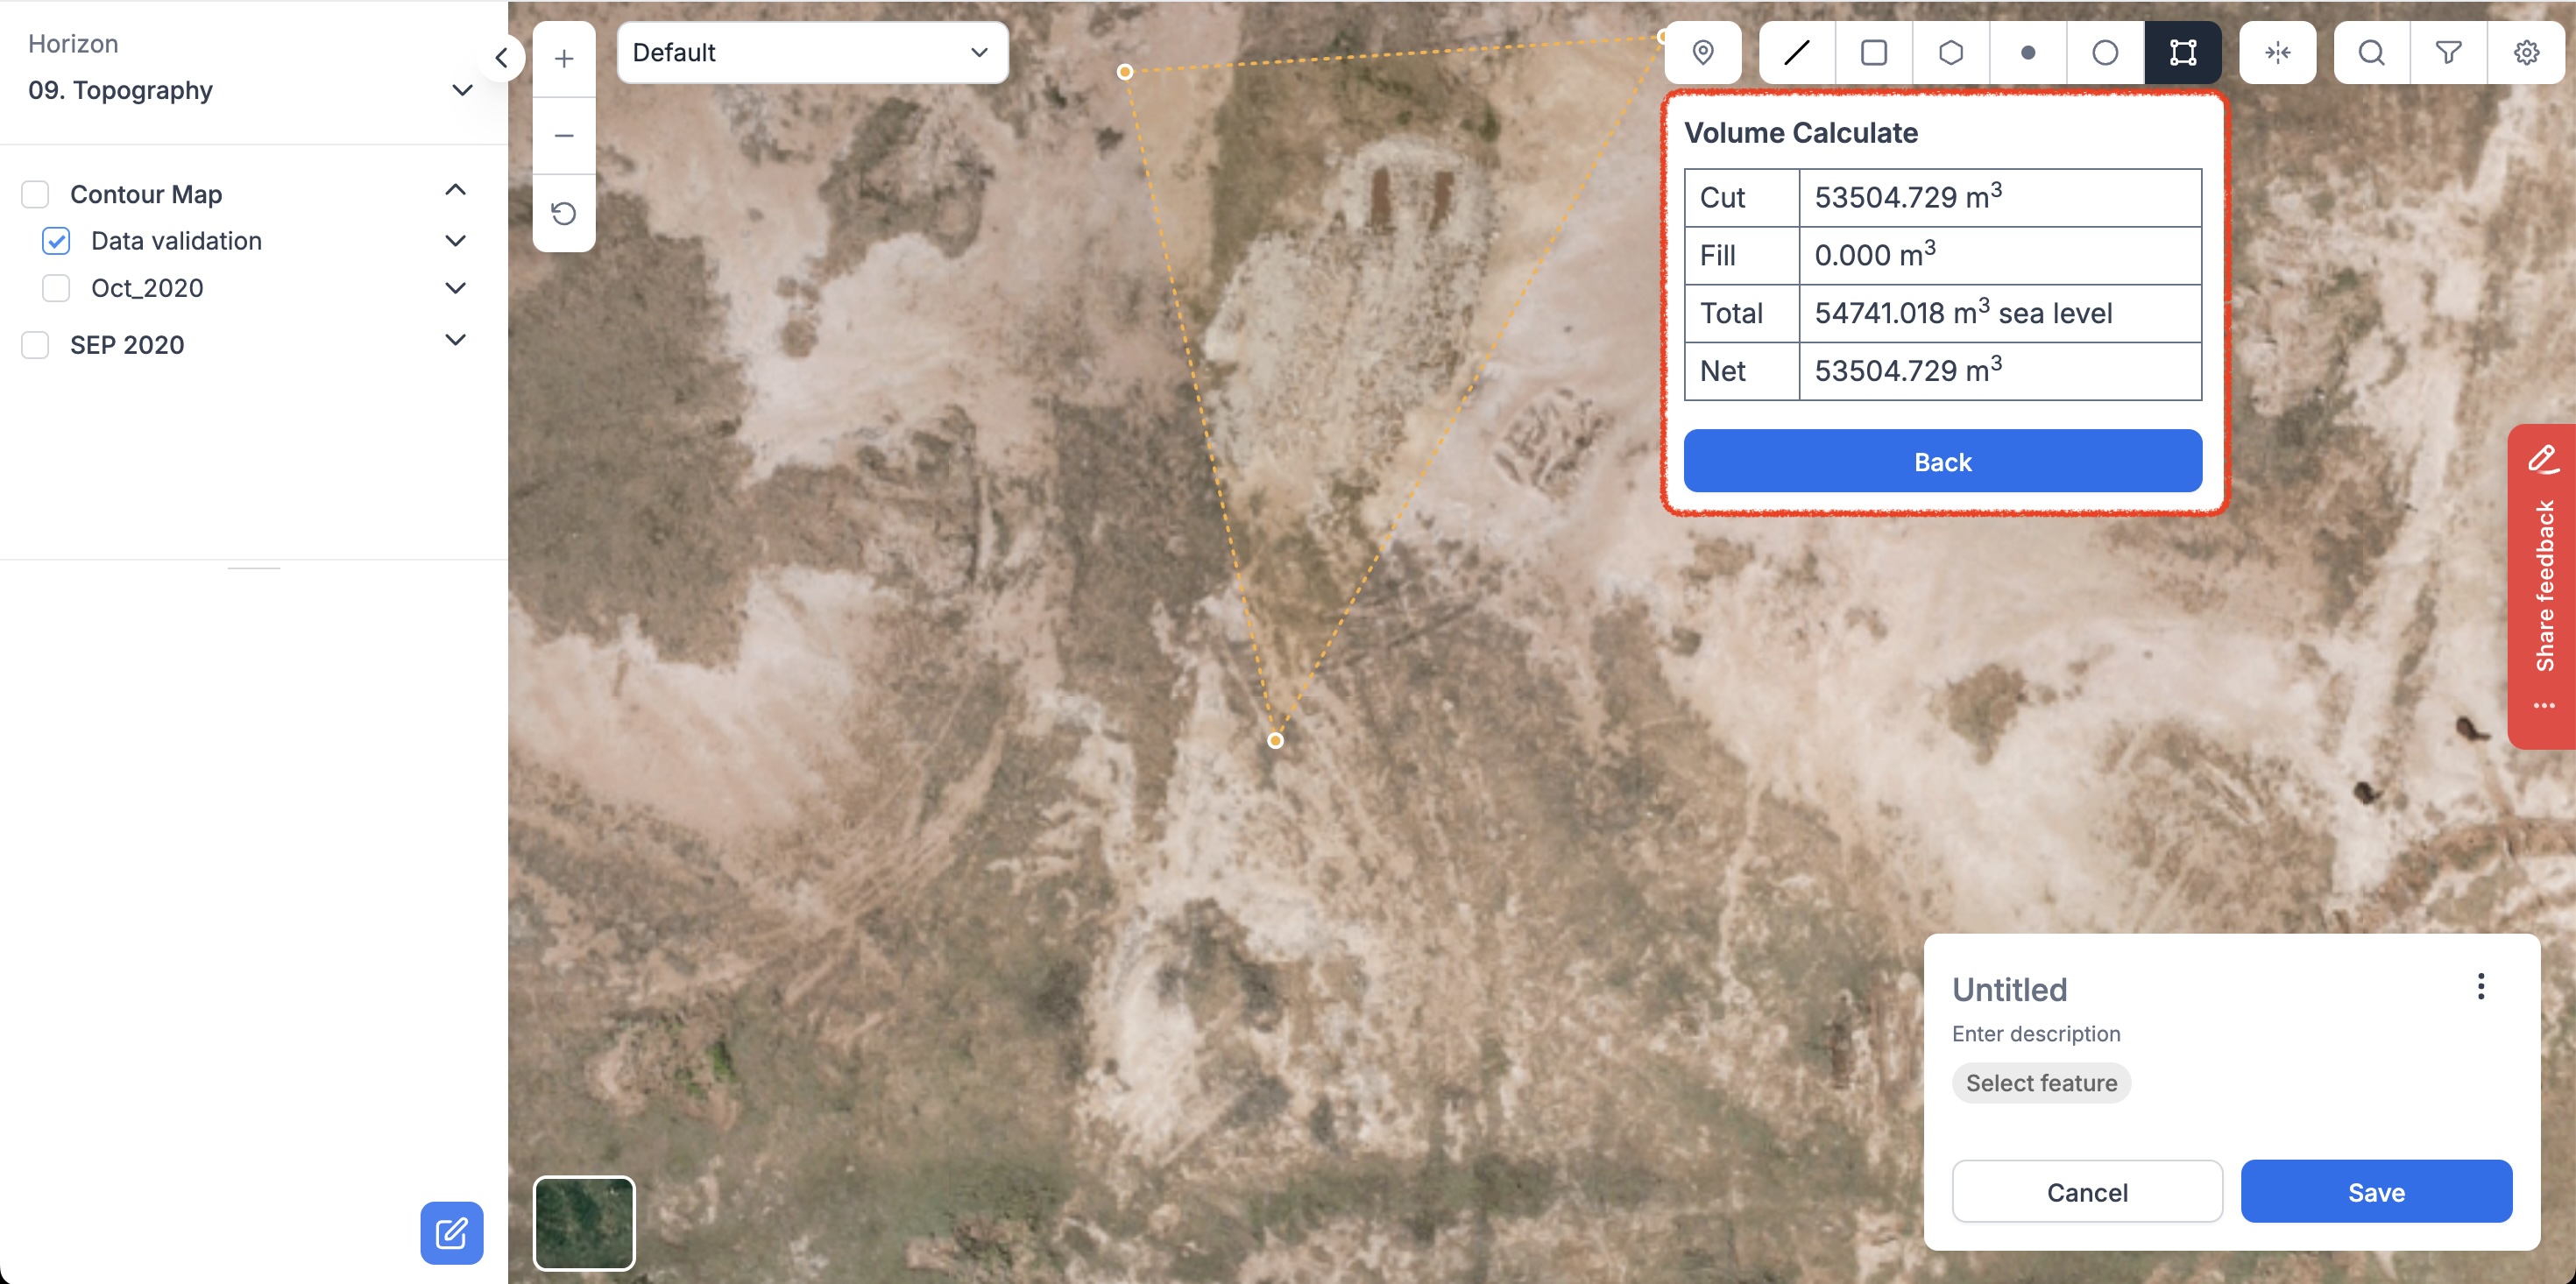
3. Click on 'Calculate Volume' and view the result.
FIGURE 11(a): STEPS FOR VOLUME CALCULATION
Maps Overview (Construction Monitoring)
TaskMapper overlays a digital map of your site with periodic drone scans that compare the as-built against the plan. Other reports and data can also be integrated to give you a complete picture of on-site progress. The platform also organizes and stores this data to facilitate quick retrieval and advanced analytics.
Drone Based Construction Monitoring:
Dashboard
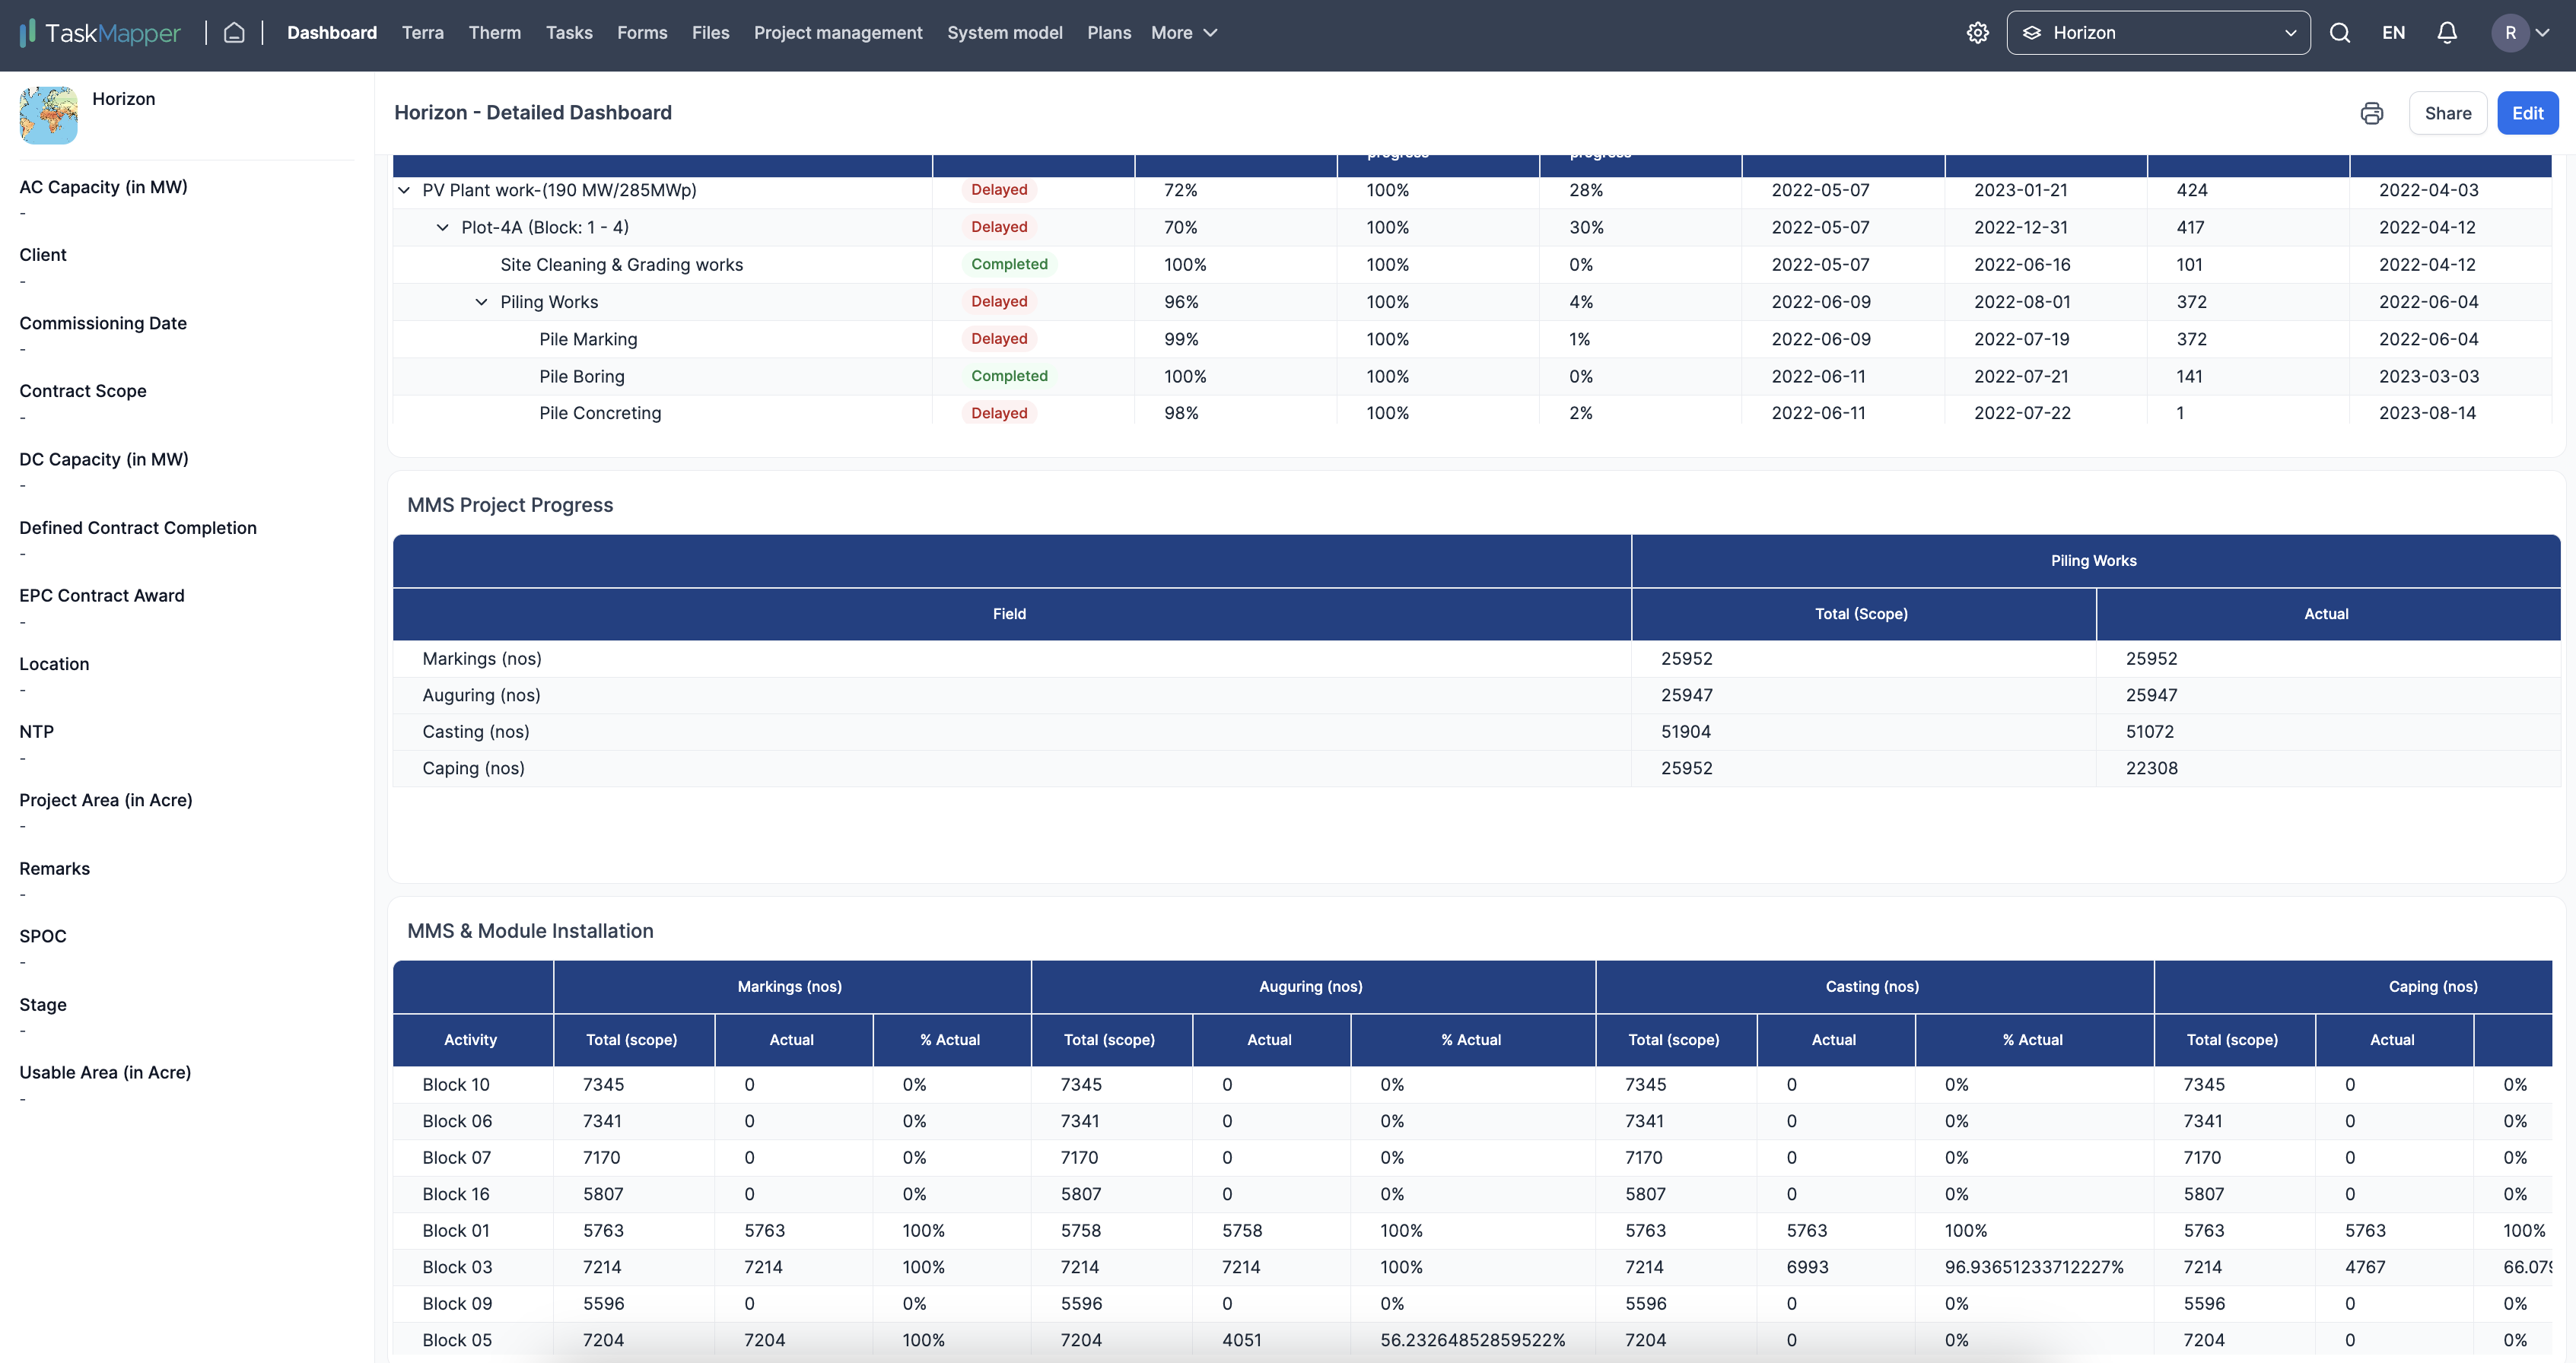
The dashboard is configurable and displays important information and data on a single screen. It provides users with a visual snapshot of metrics and analytics. Dashboards can be customized to display different data types, such as tasks, forms, project progress information, construction progress information, etc. Data from the dashboards can be exported to PDF for sharing.
FIGURE 12: DASHBOARD VIEW
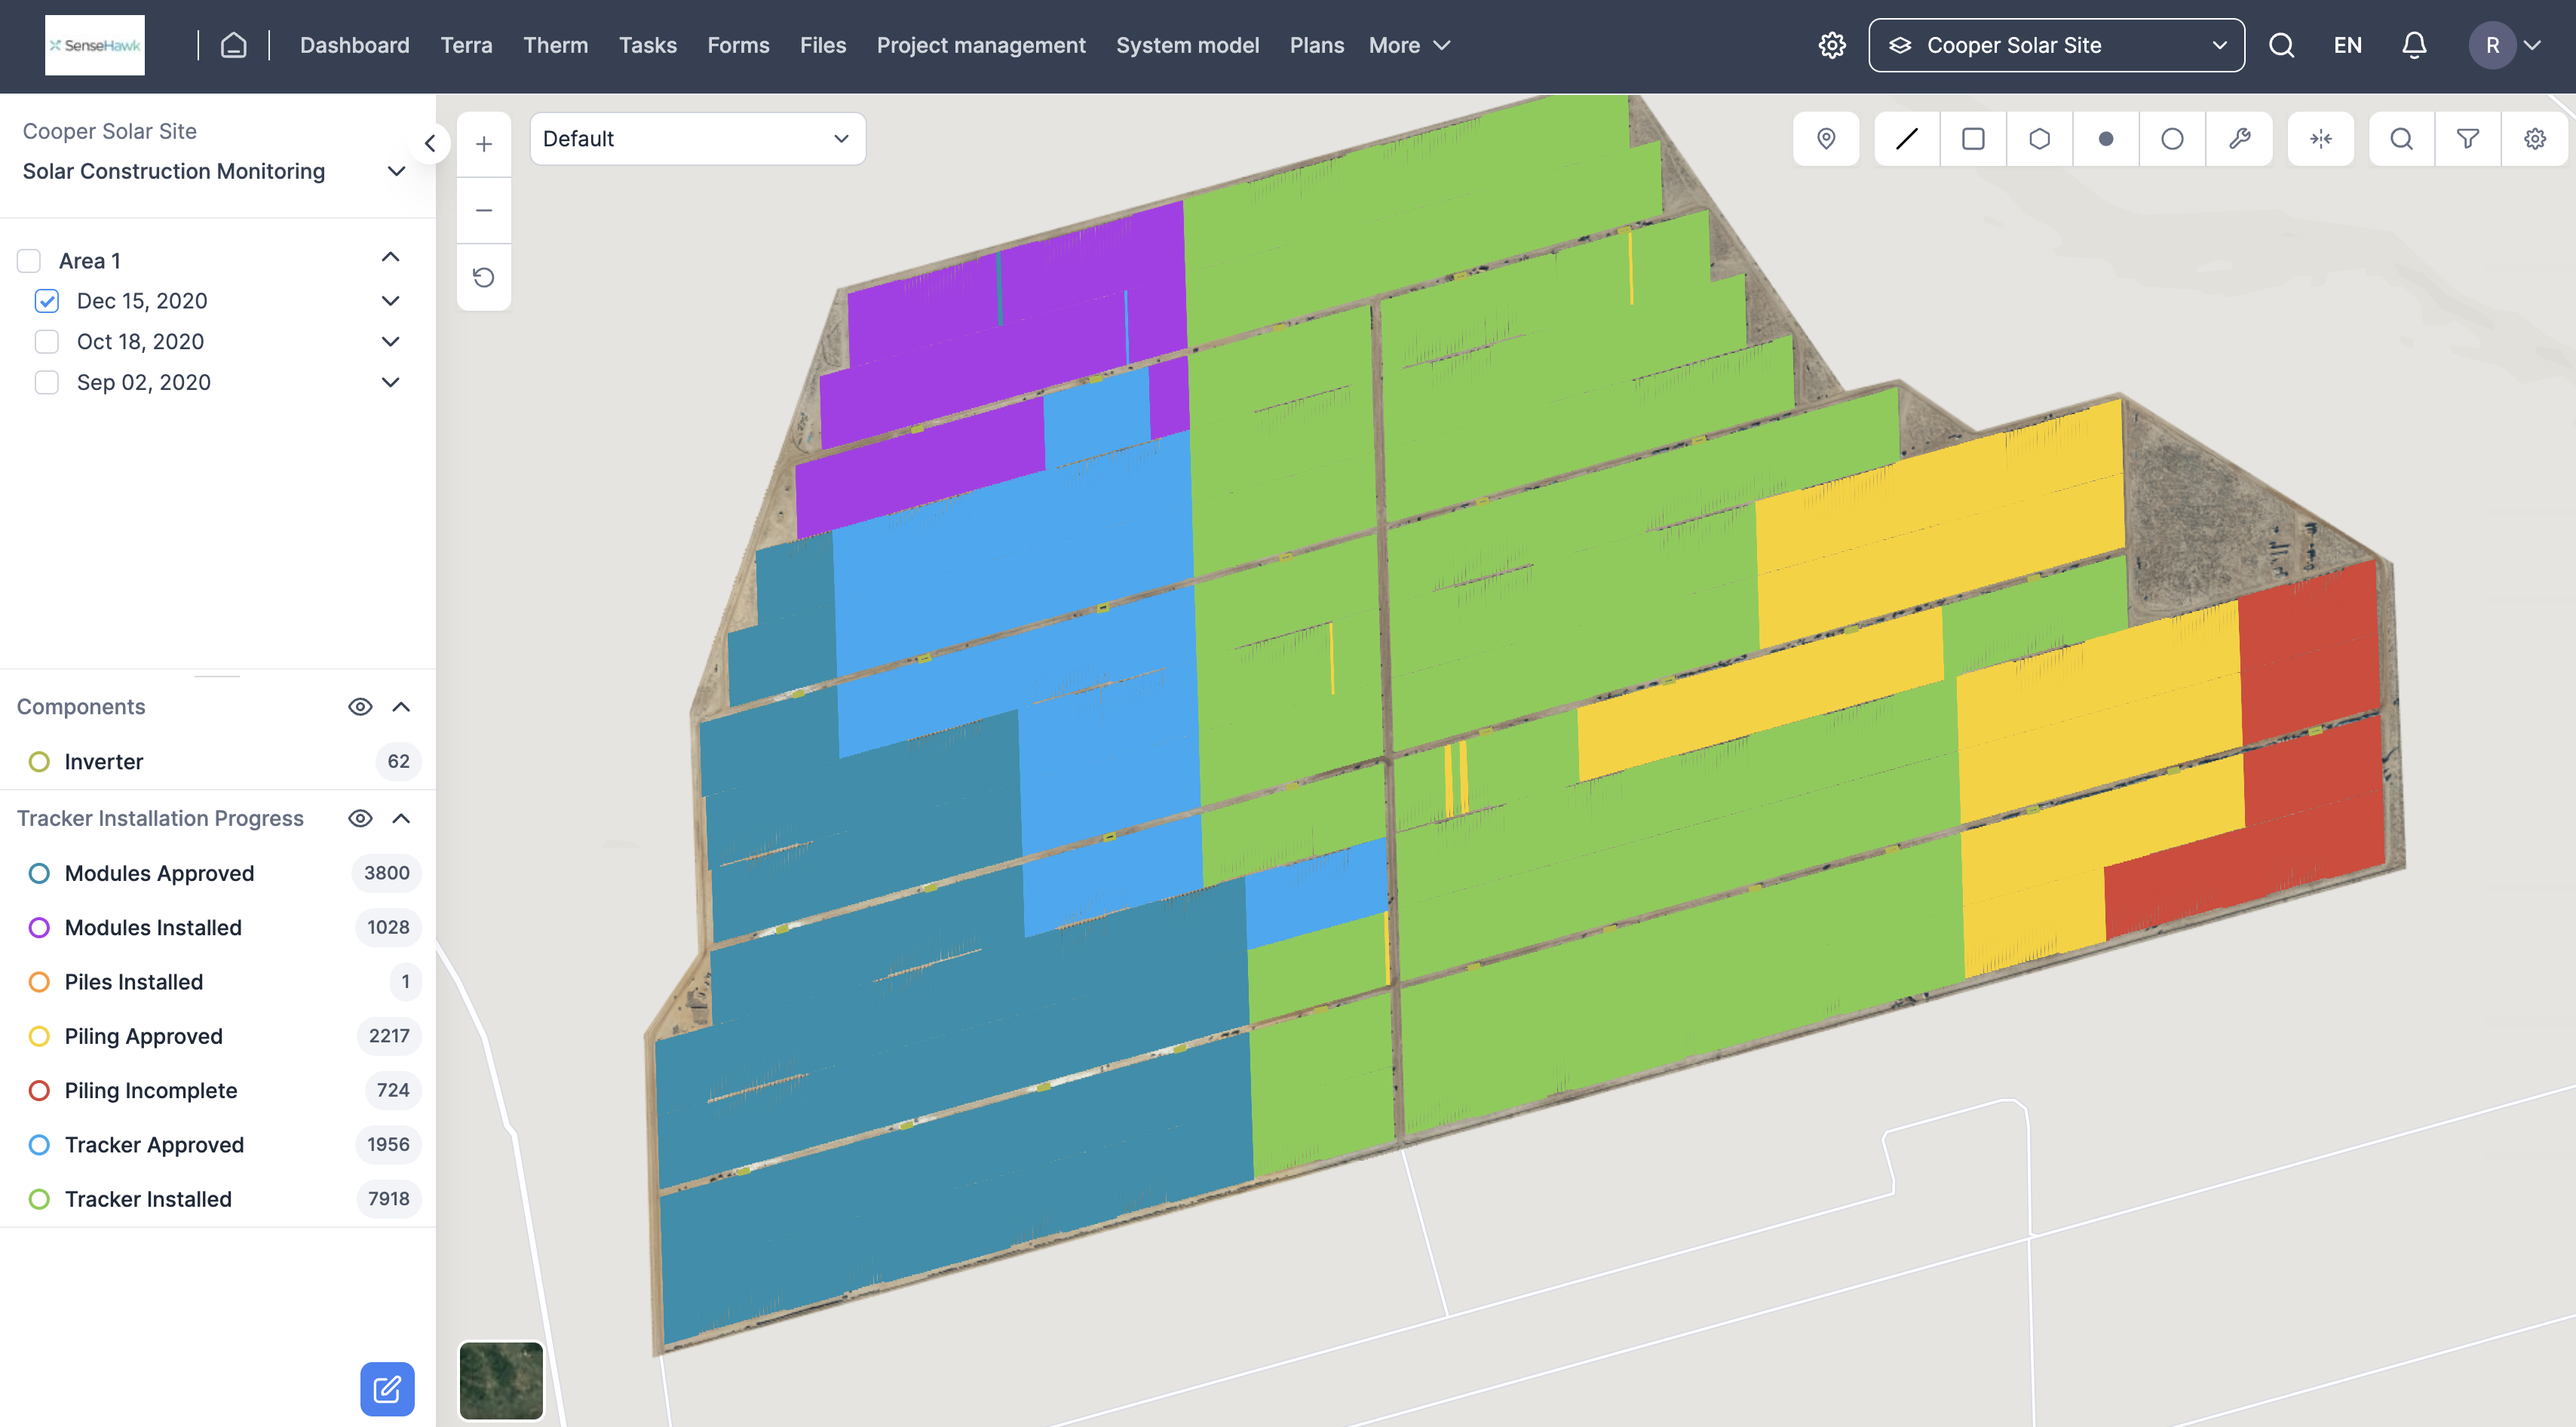
FIGURE 13: MAP/TERRAIN VIEW
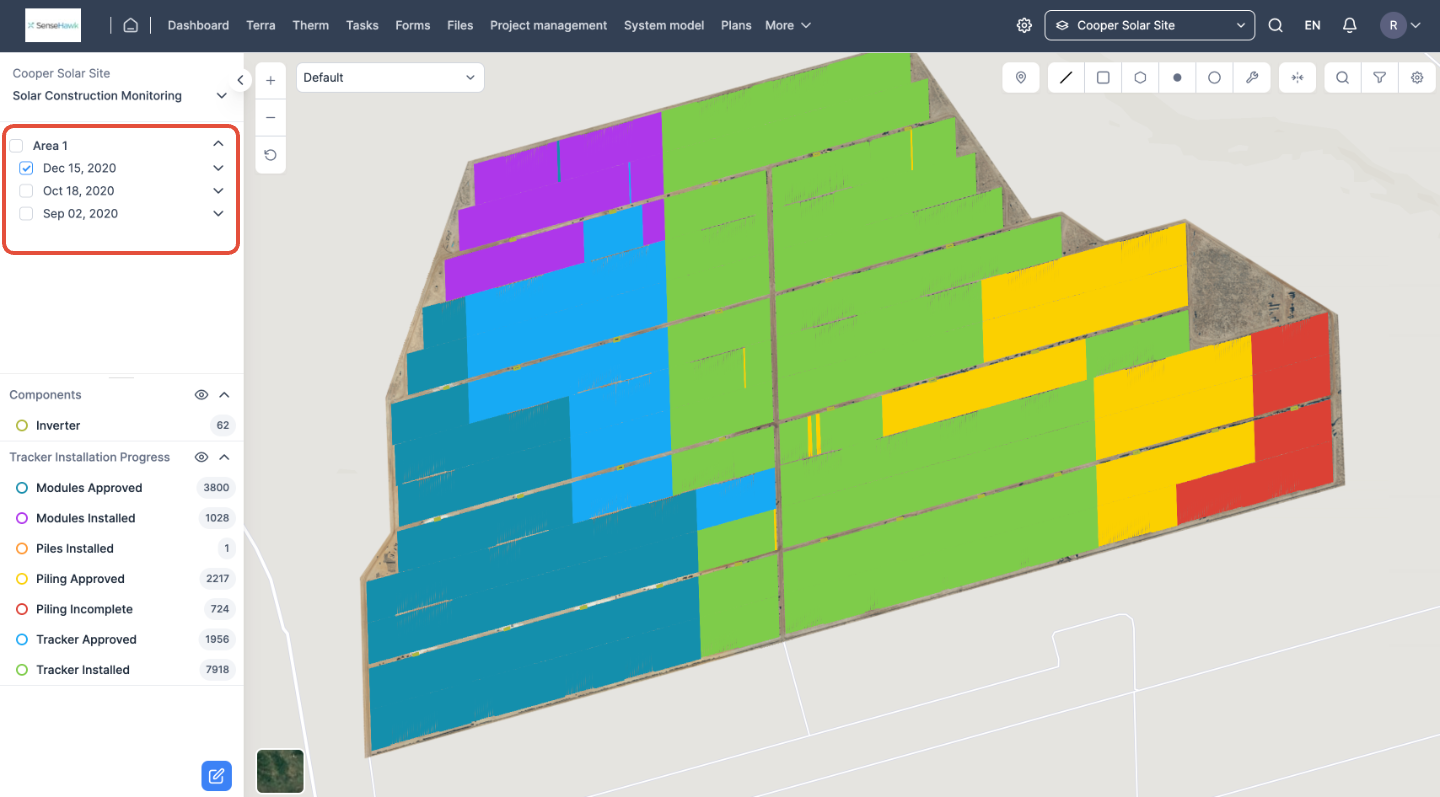
Scan Dates
On the map/terrain view of the site., select the desired scan date.
FIGURE 14: SCAN DATES FOR PROGRESS MONiTORING
Filters
Now, use various filters to access the data you want.
a) App Filters
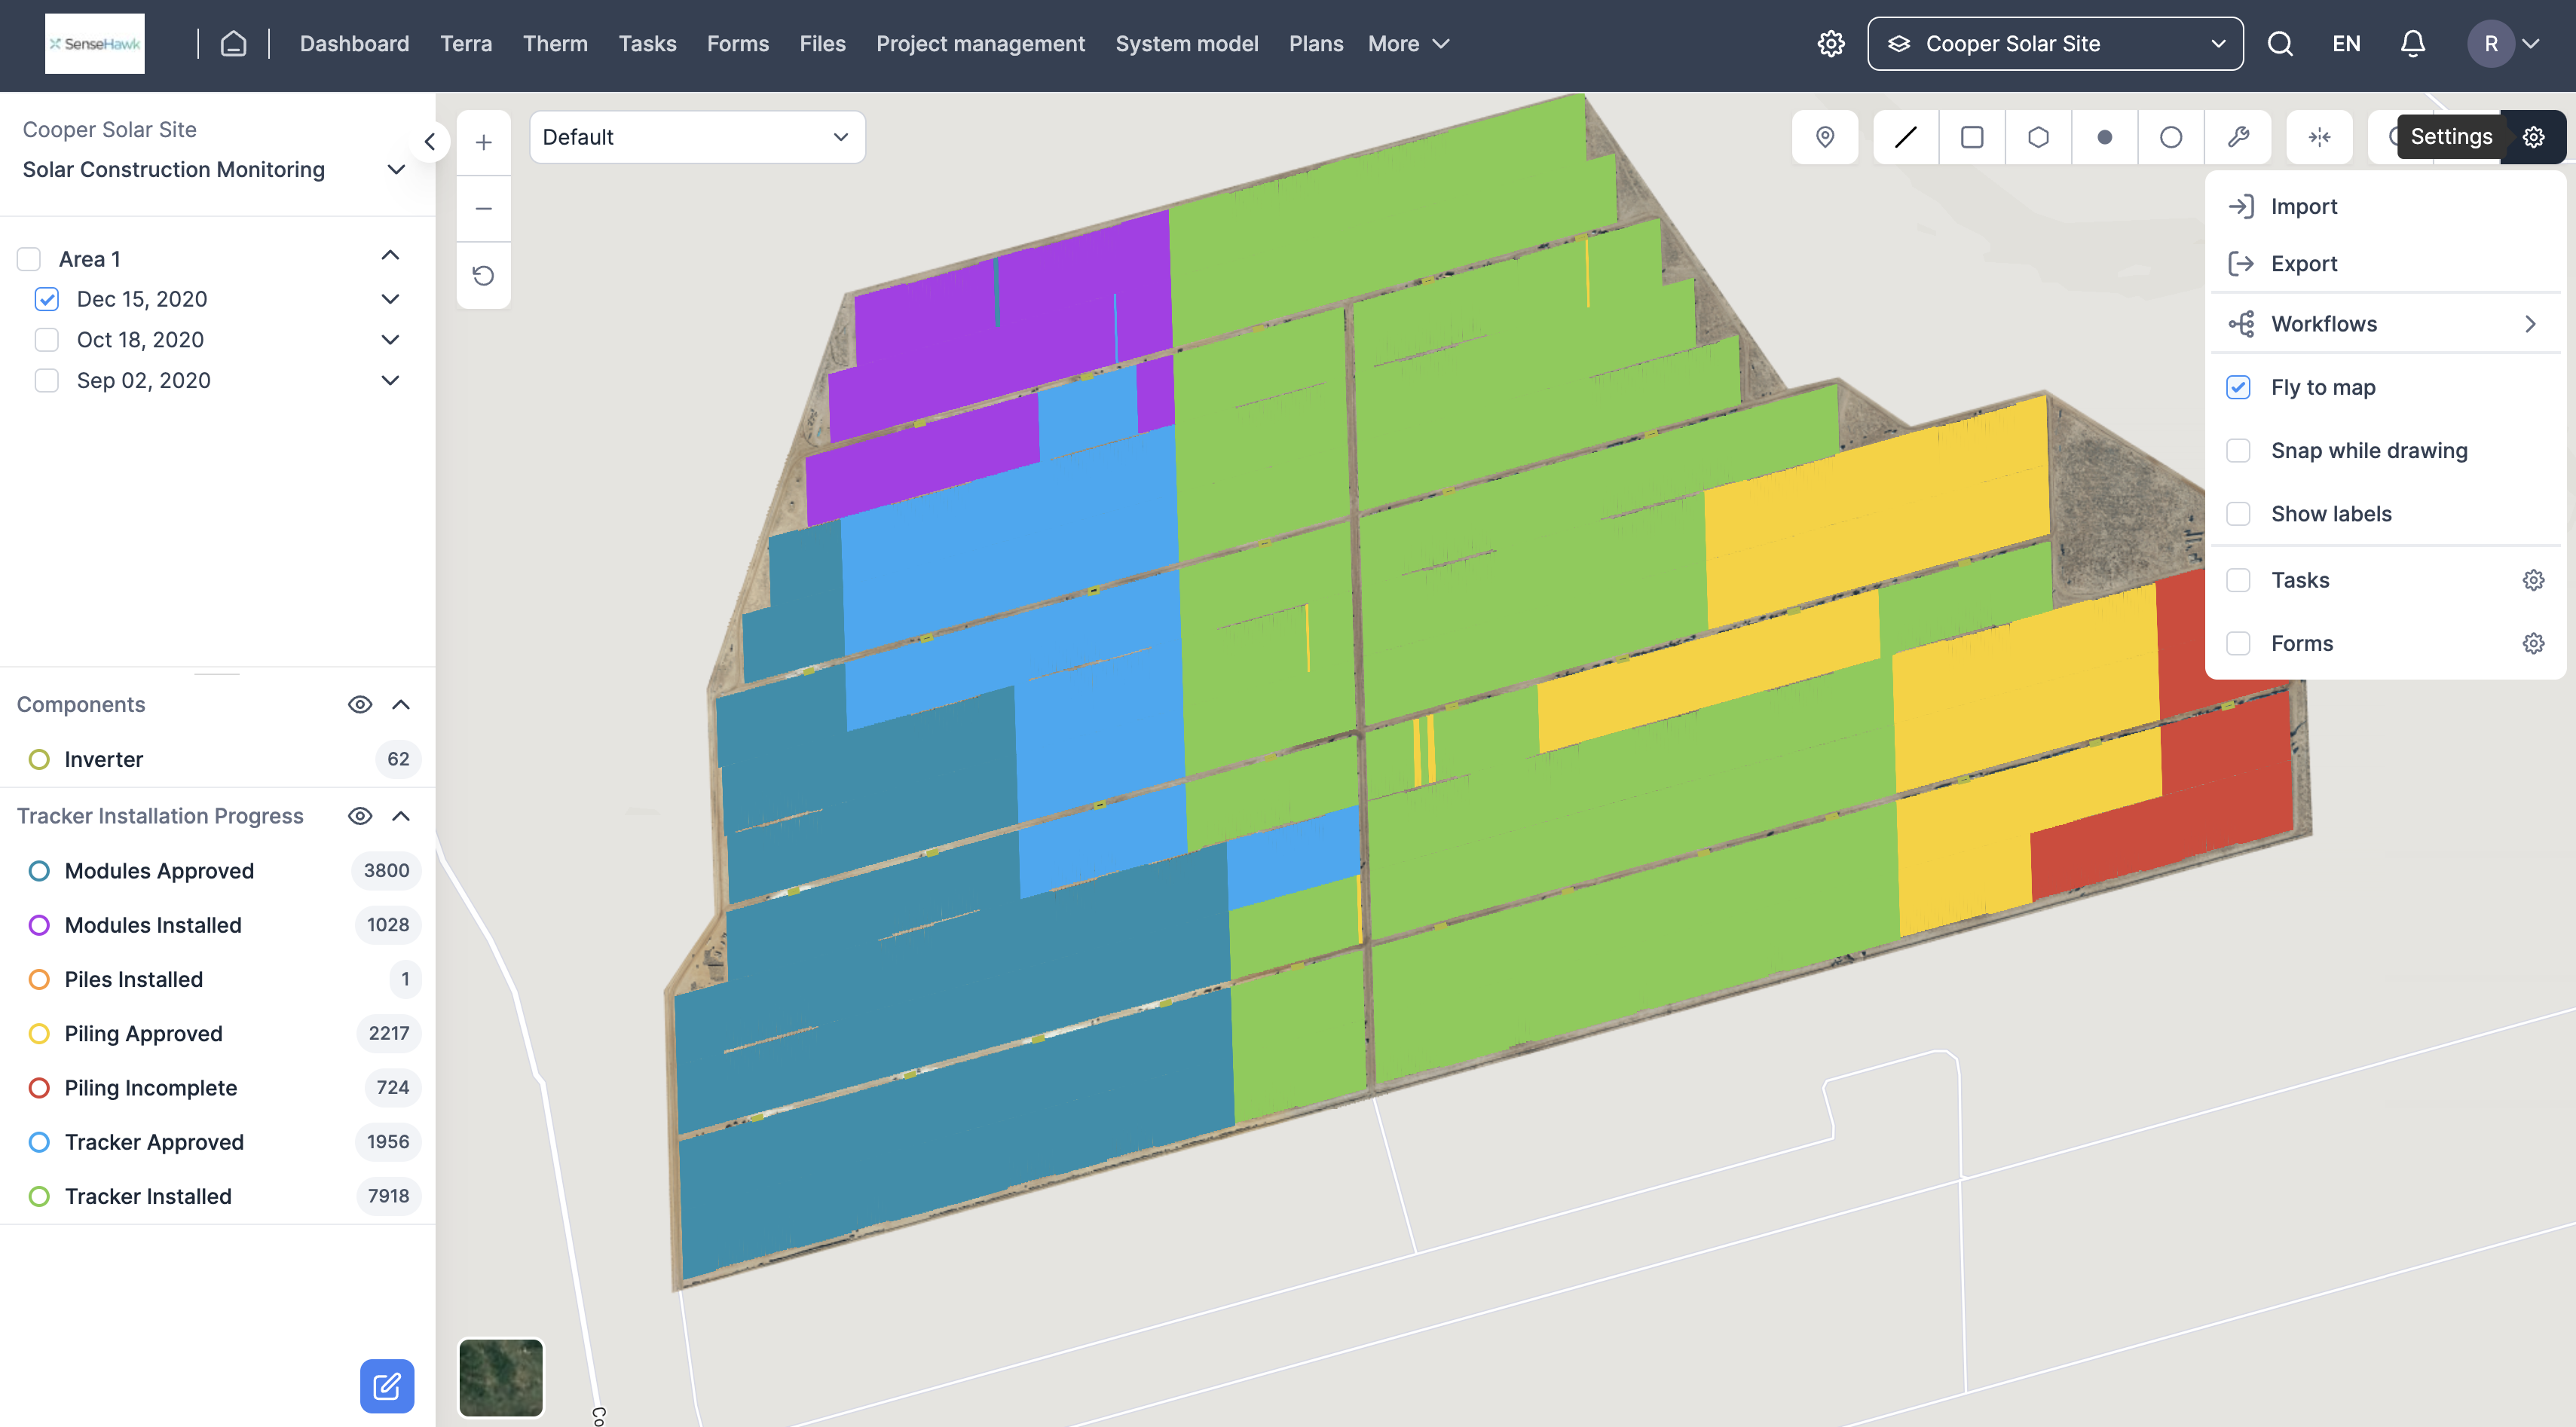
Click on the gear icon in the tools menu for App filters
- Check or uncheck Tasks/Forms on the map view
FIGURE 15: APP FILTERS TO FILTER OUT LABELS, TASKS, AND FORMS ON THE MAP ViEW
b) Feature Filters
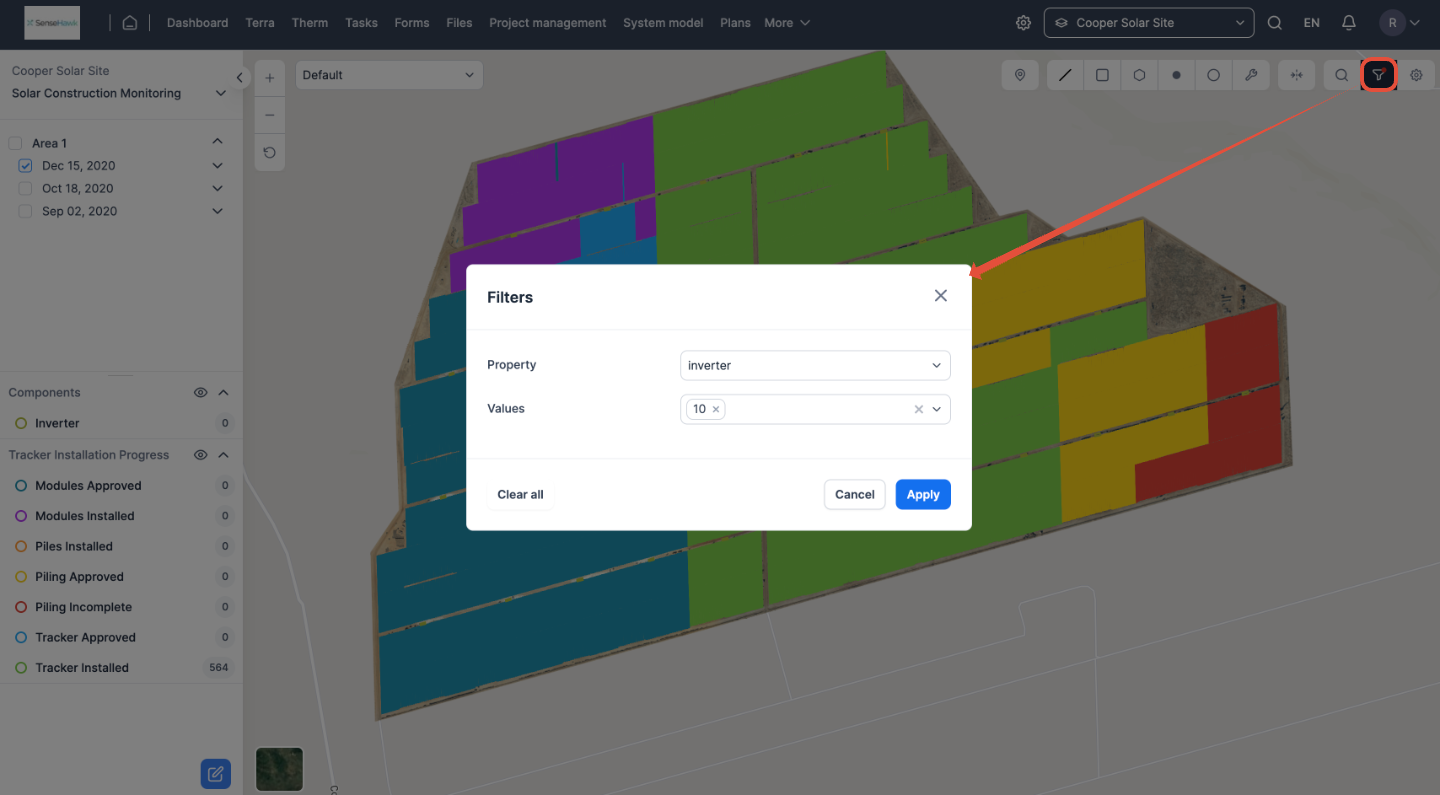
Click on the Feature Filter button in the tools menu to filter by feature types on the map.
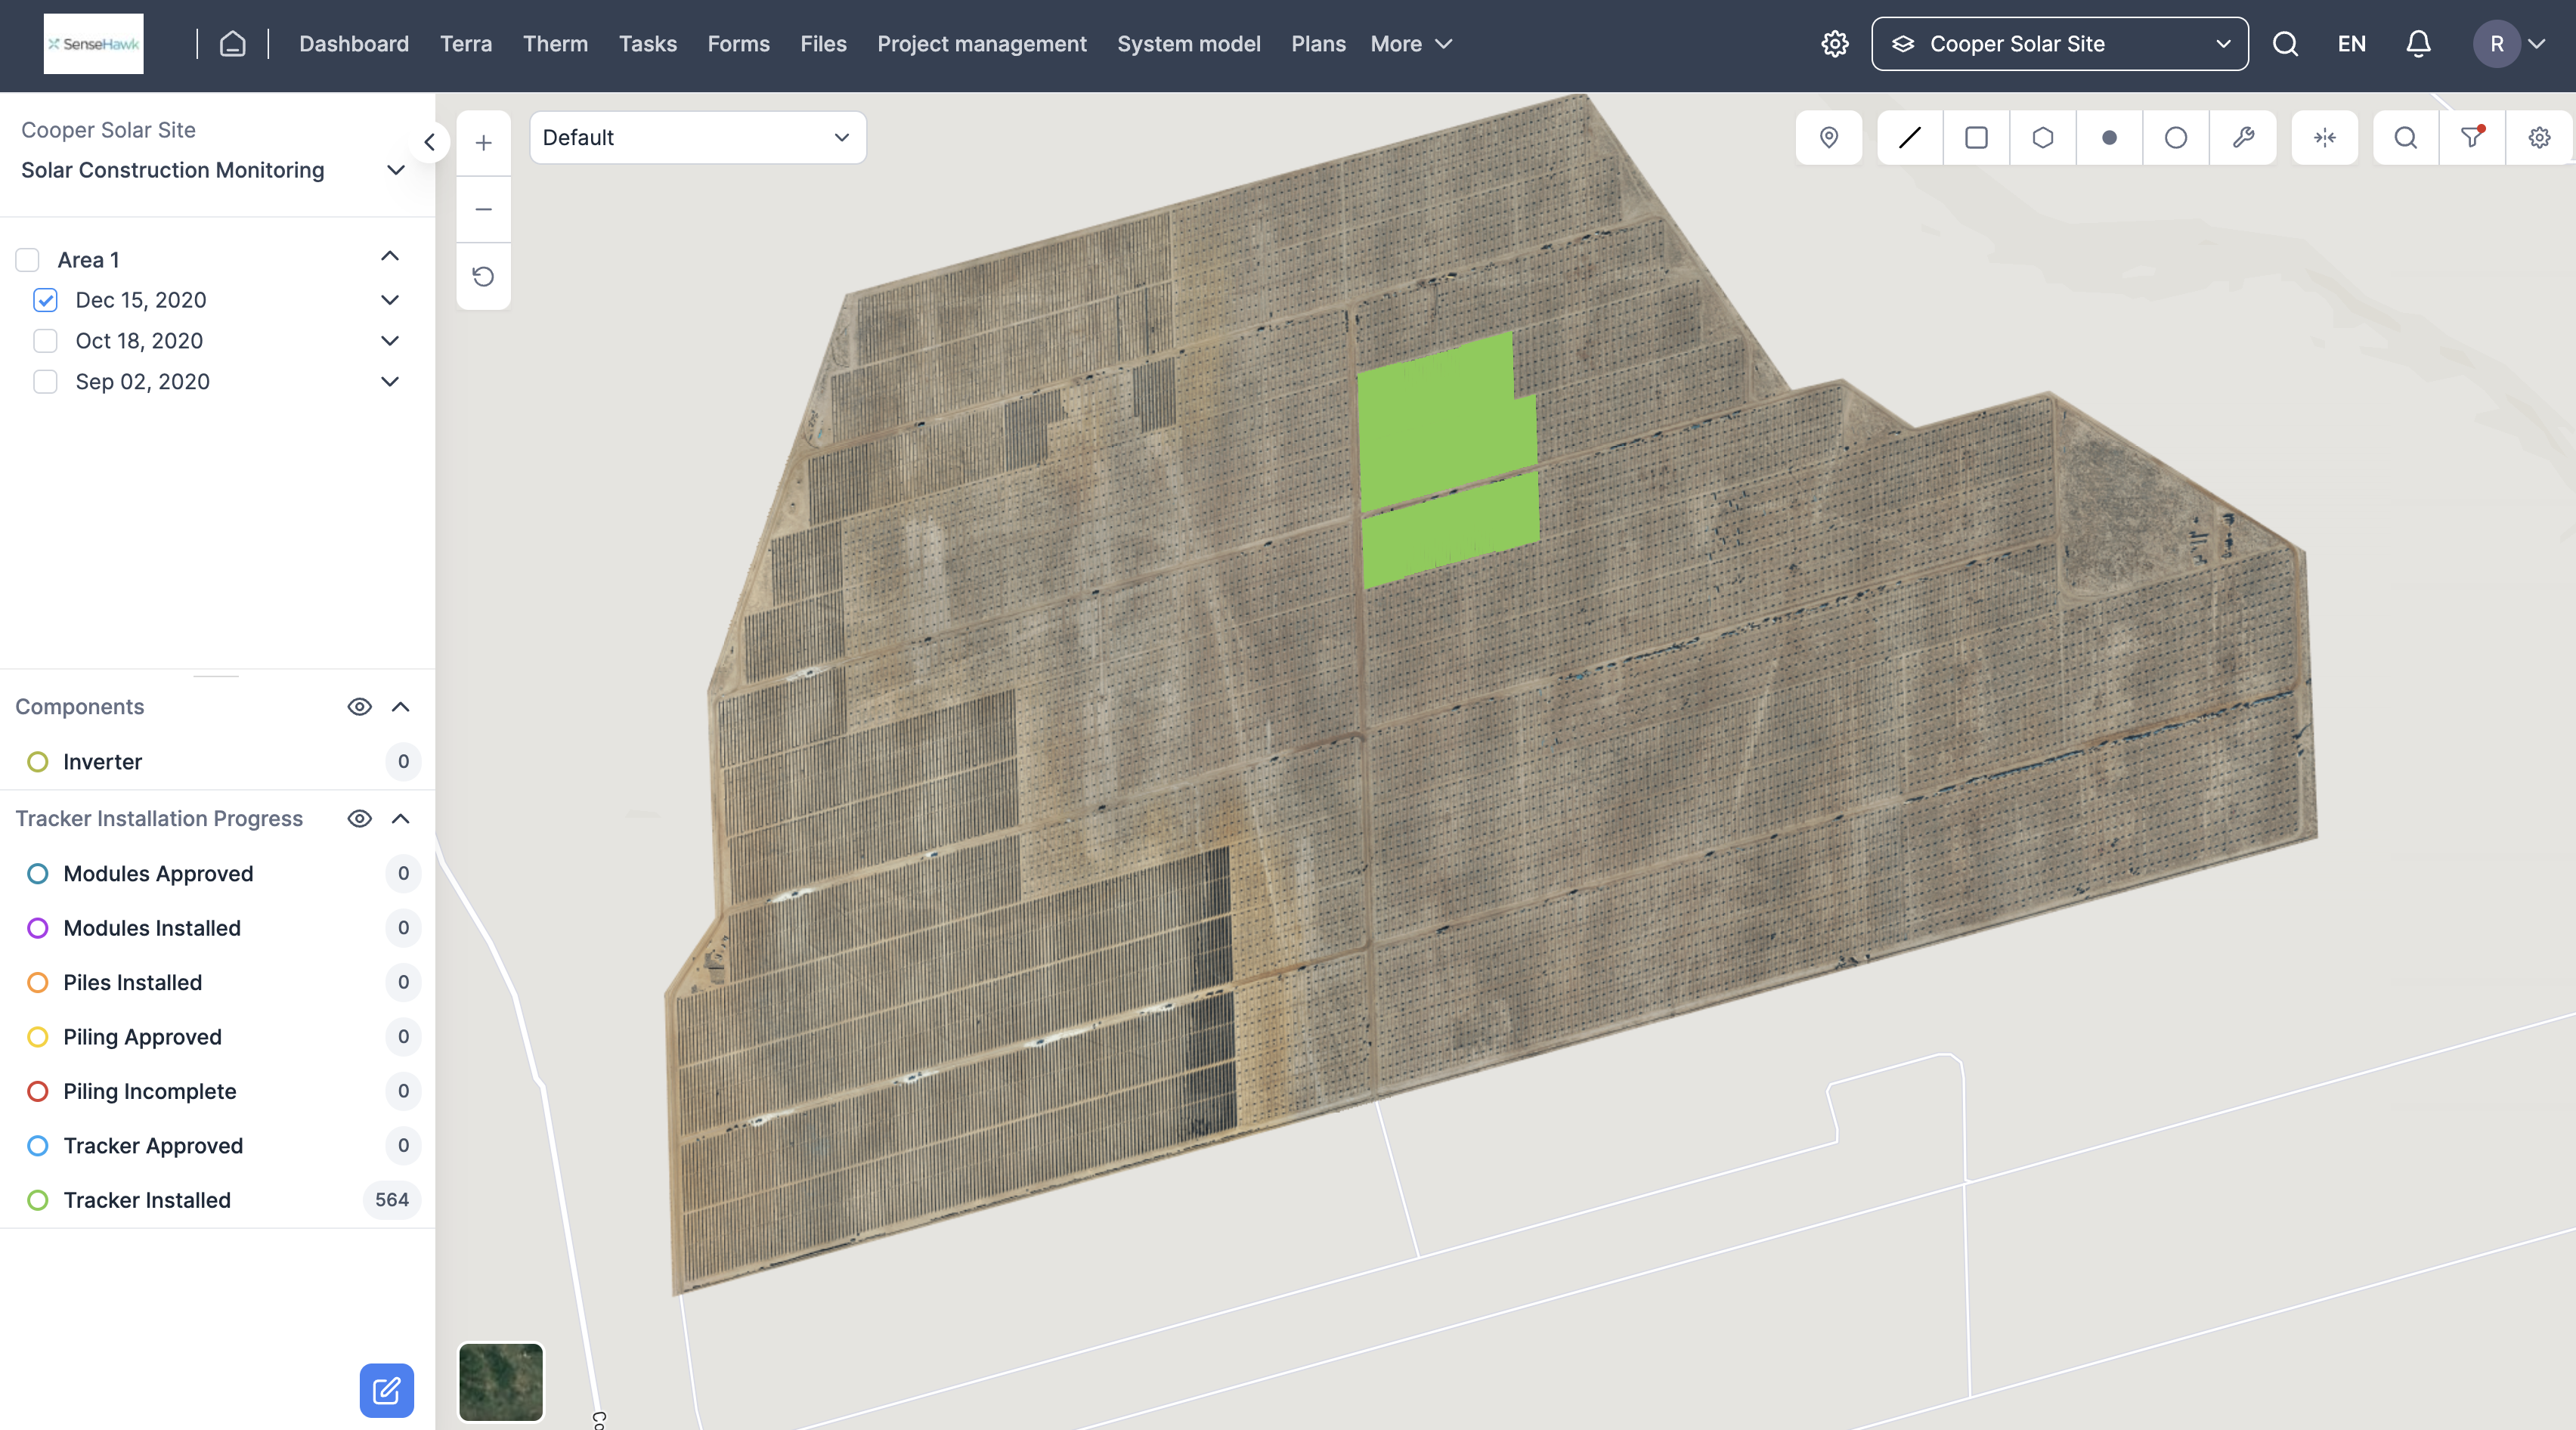
The filtered view on the map is generated.
FIGURE 16: FEATURE FILTERS TO FILTER BY ROW, INVERTER, OR NAMED COMPONENTS ON THE MAP
Feature Types
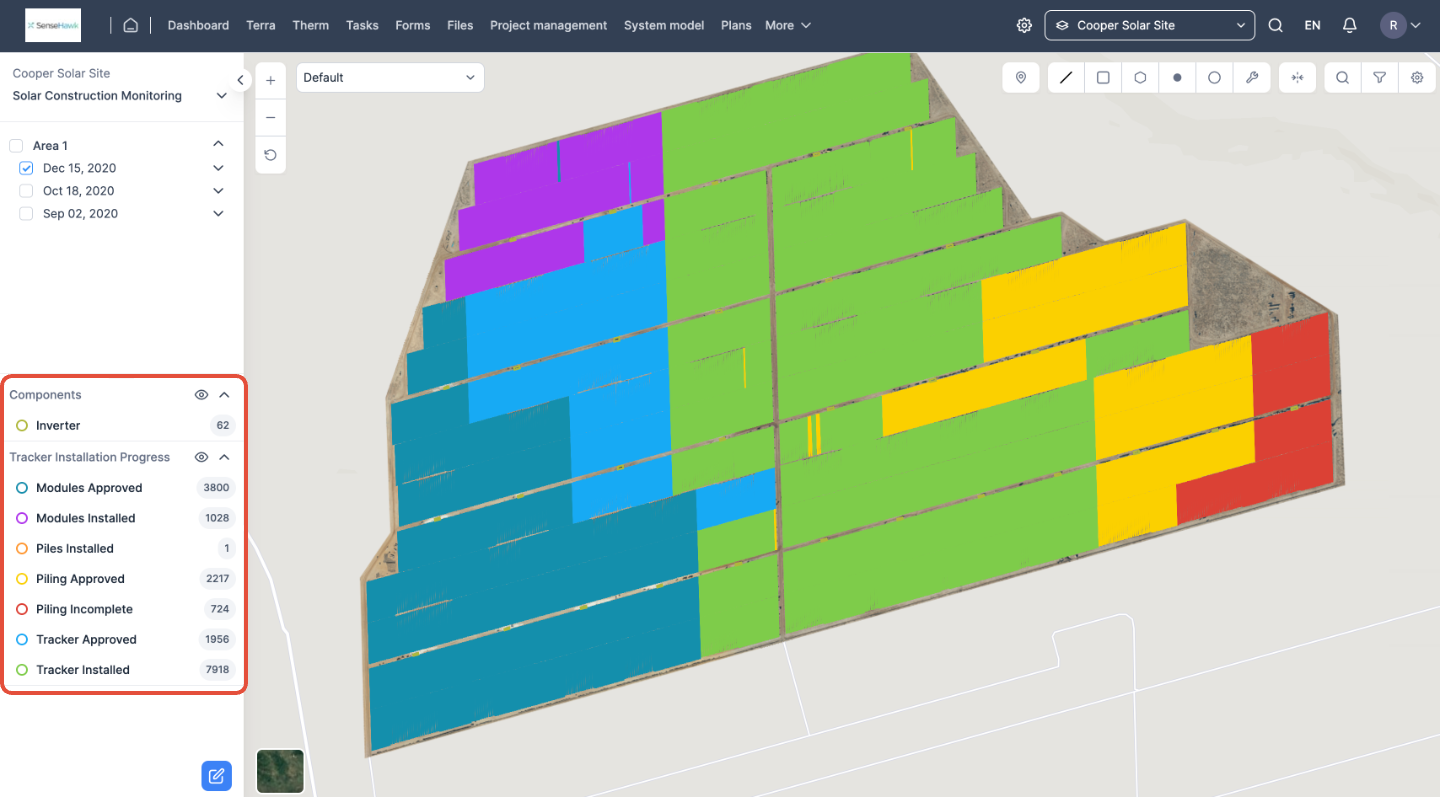
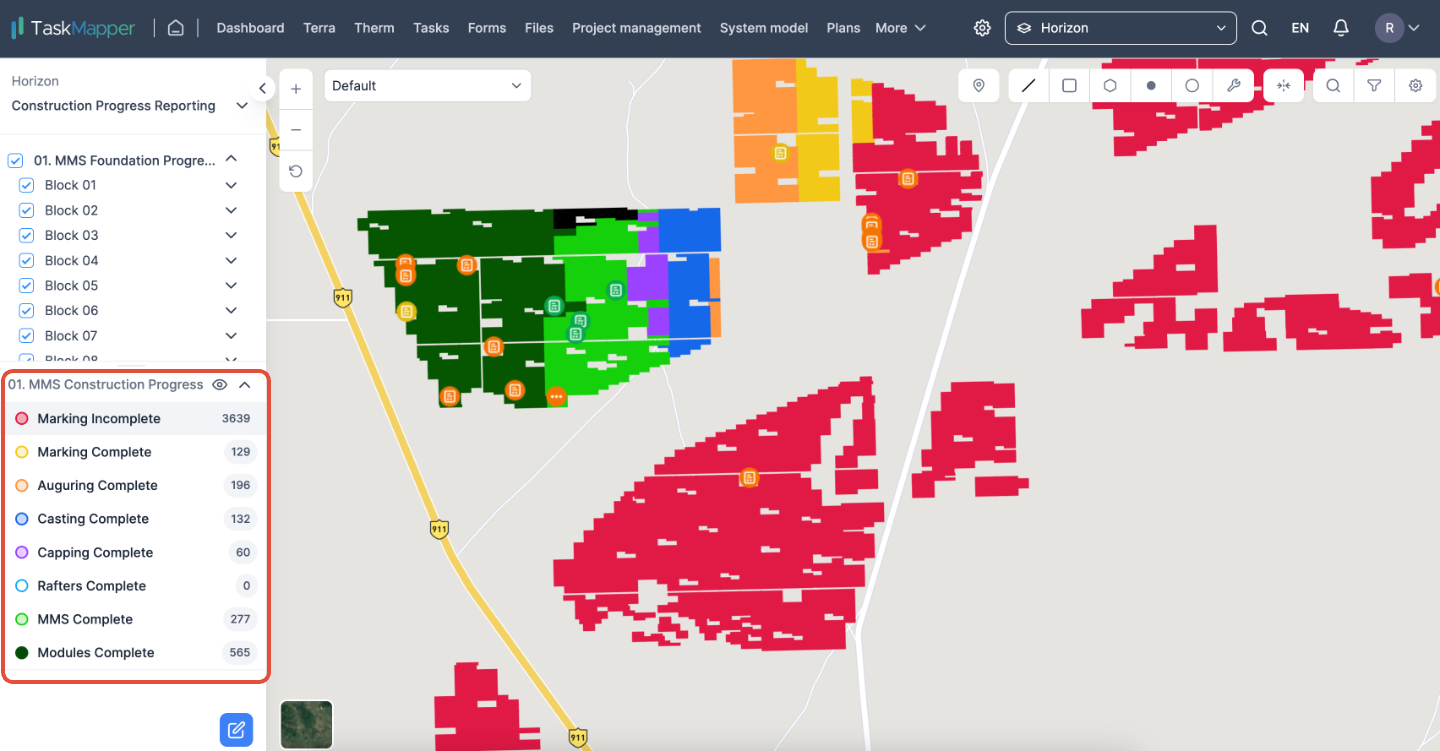
The feature types on the map are colour-coded and listed in the feature type section. The feature types on the maps can be filtered by selecting/deselecting.
FIGURE 17: SELECT/DESELECT FEATURES ON THE MAP
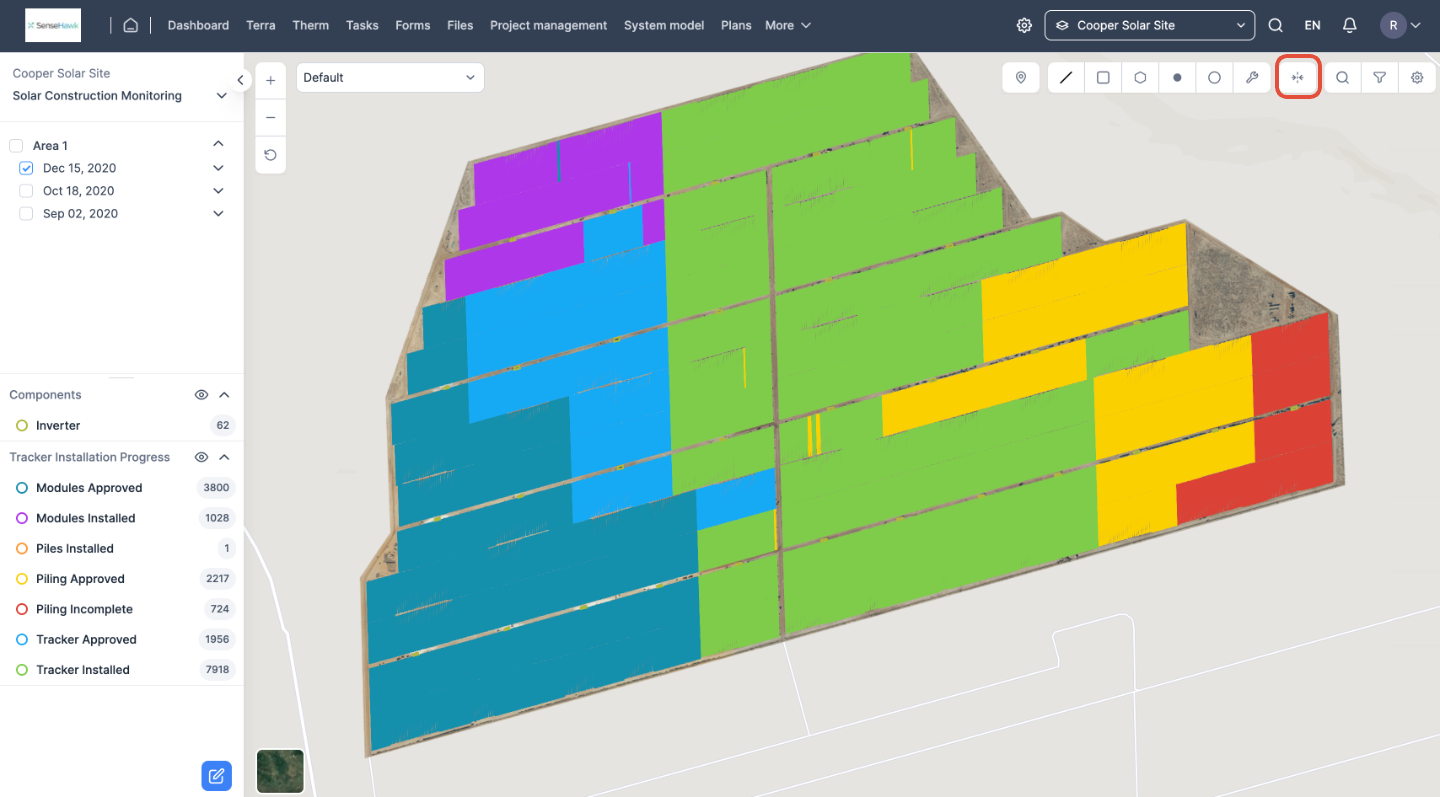
Compare
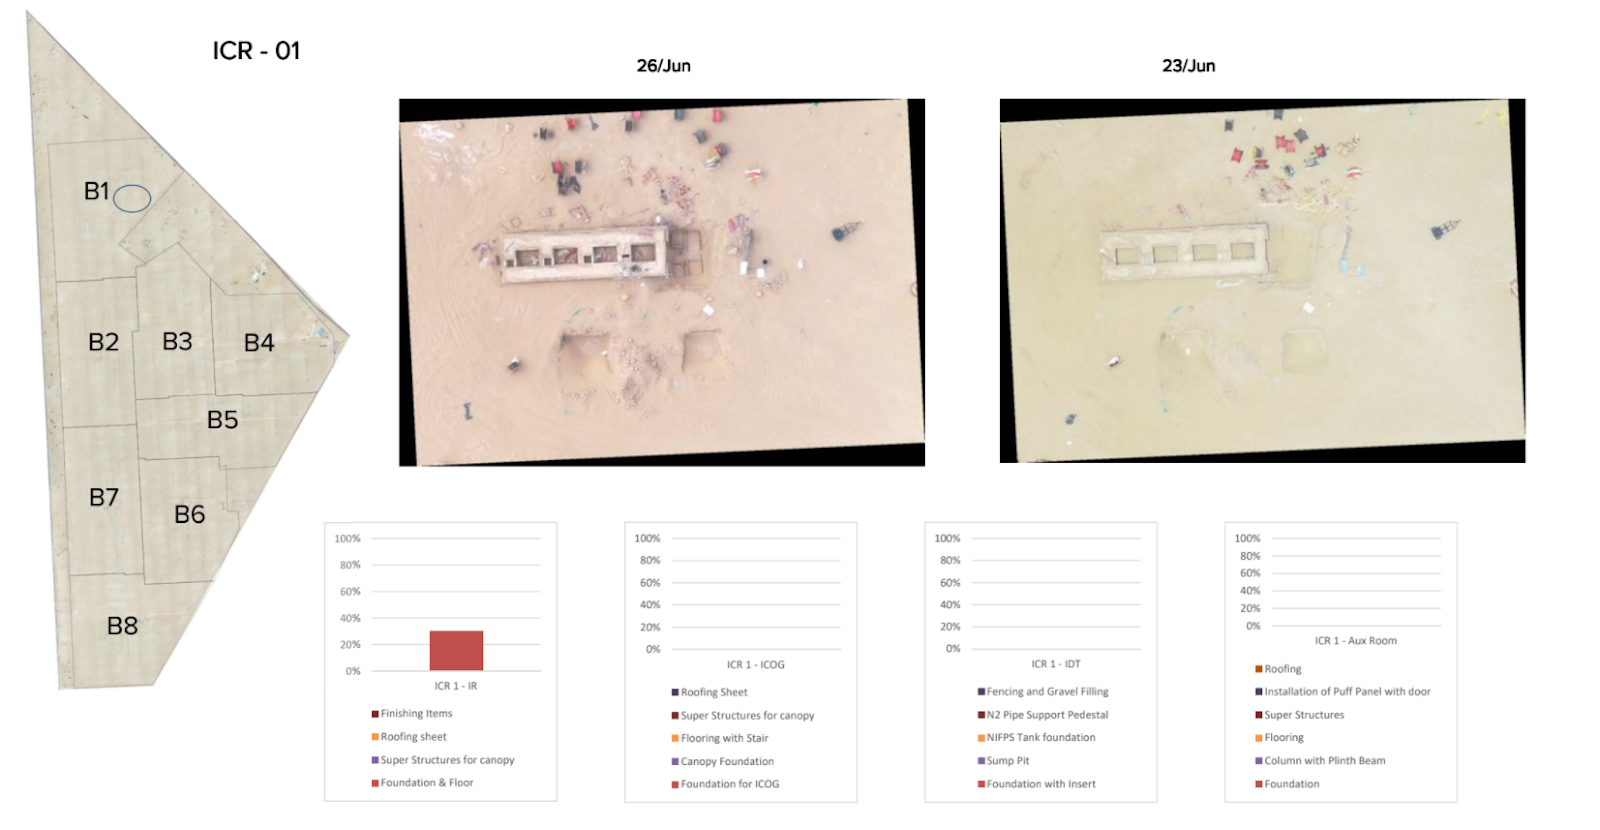
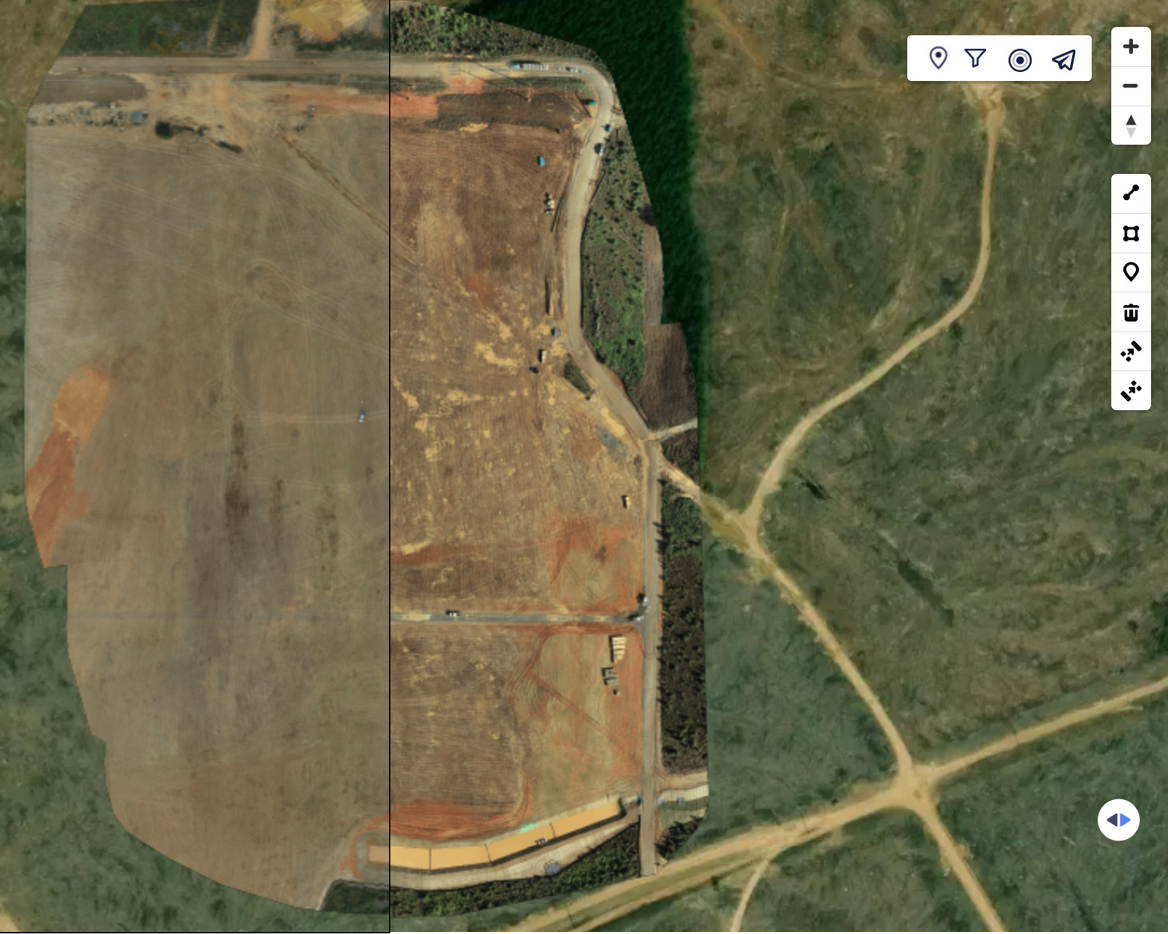
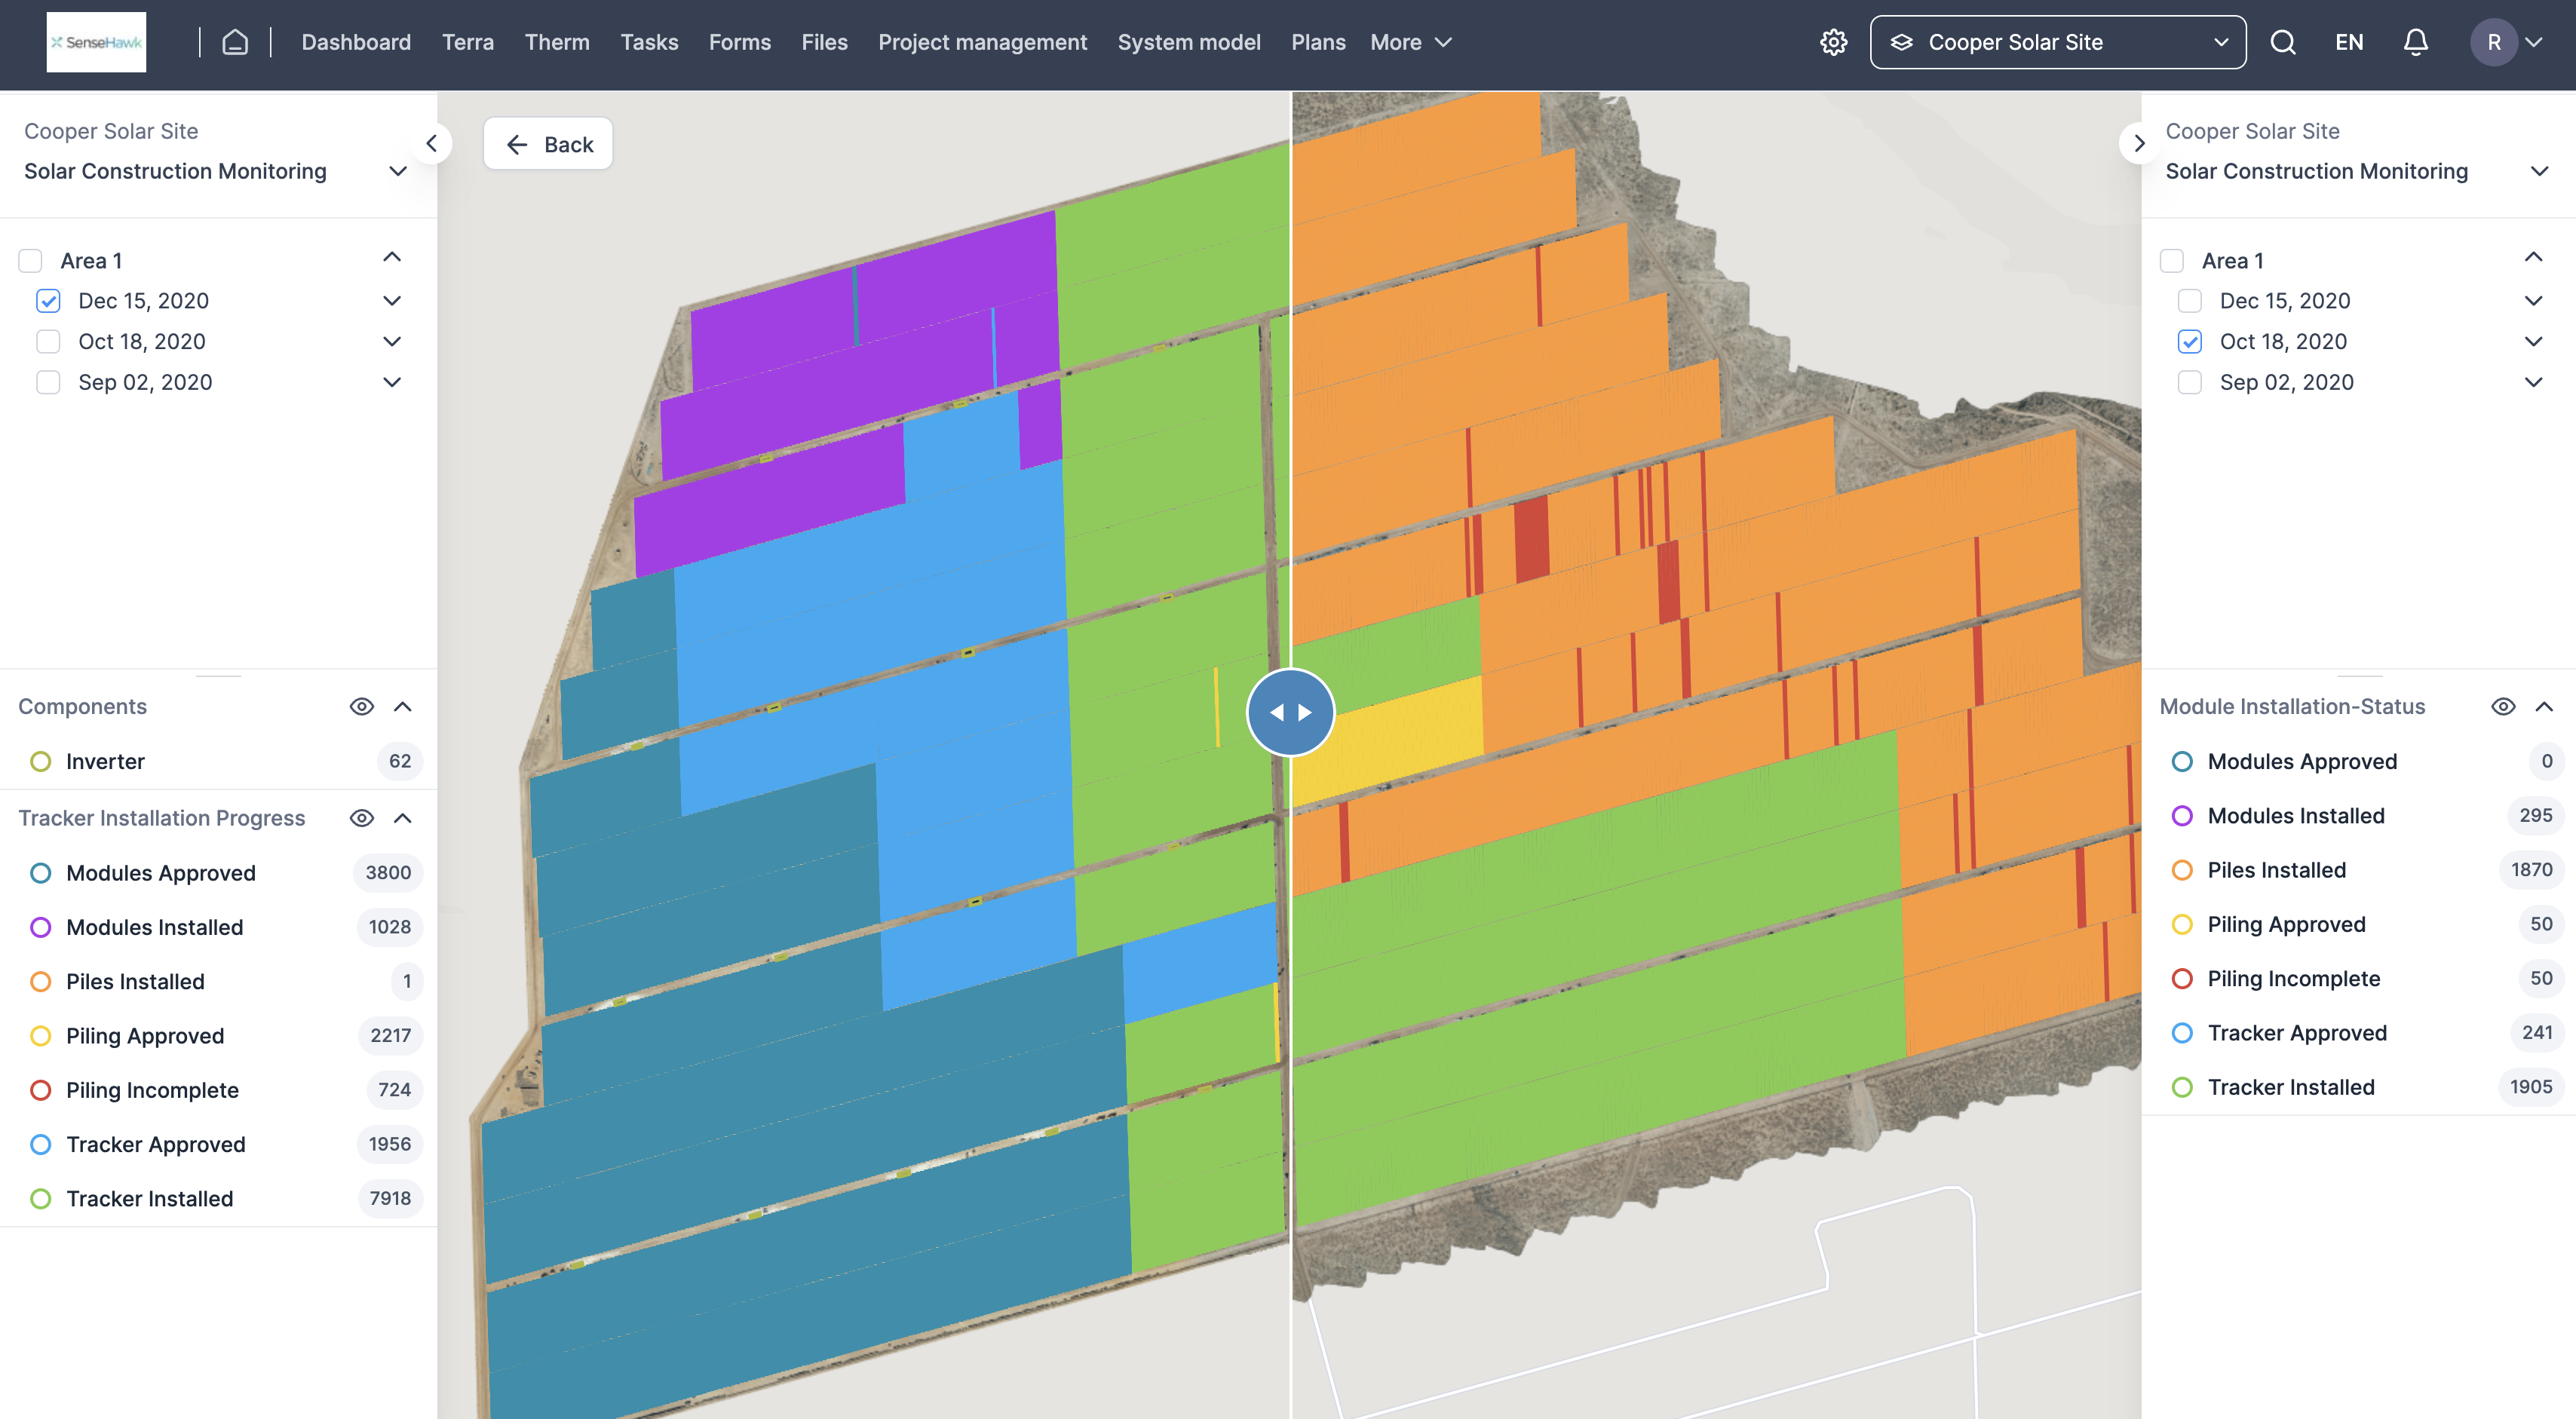
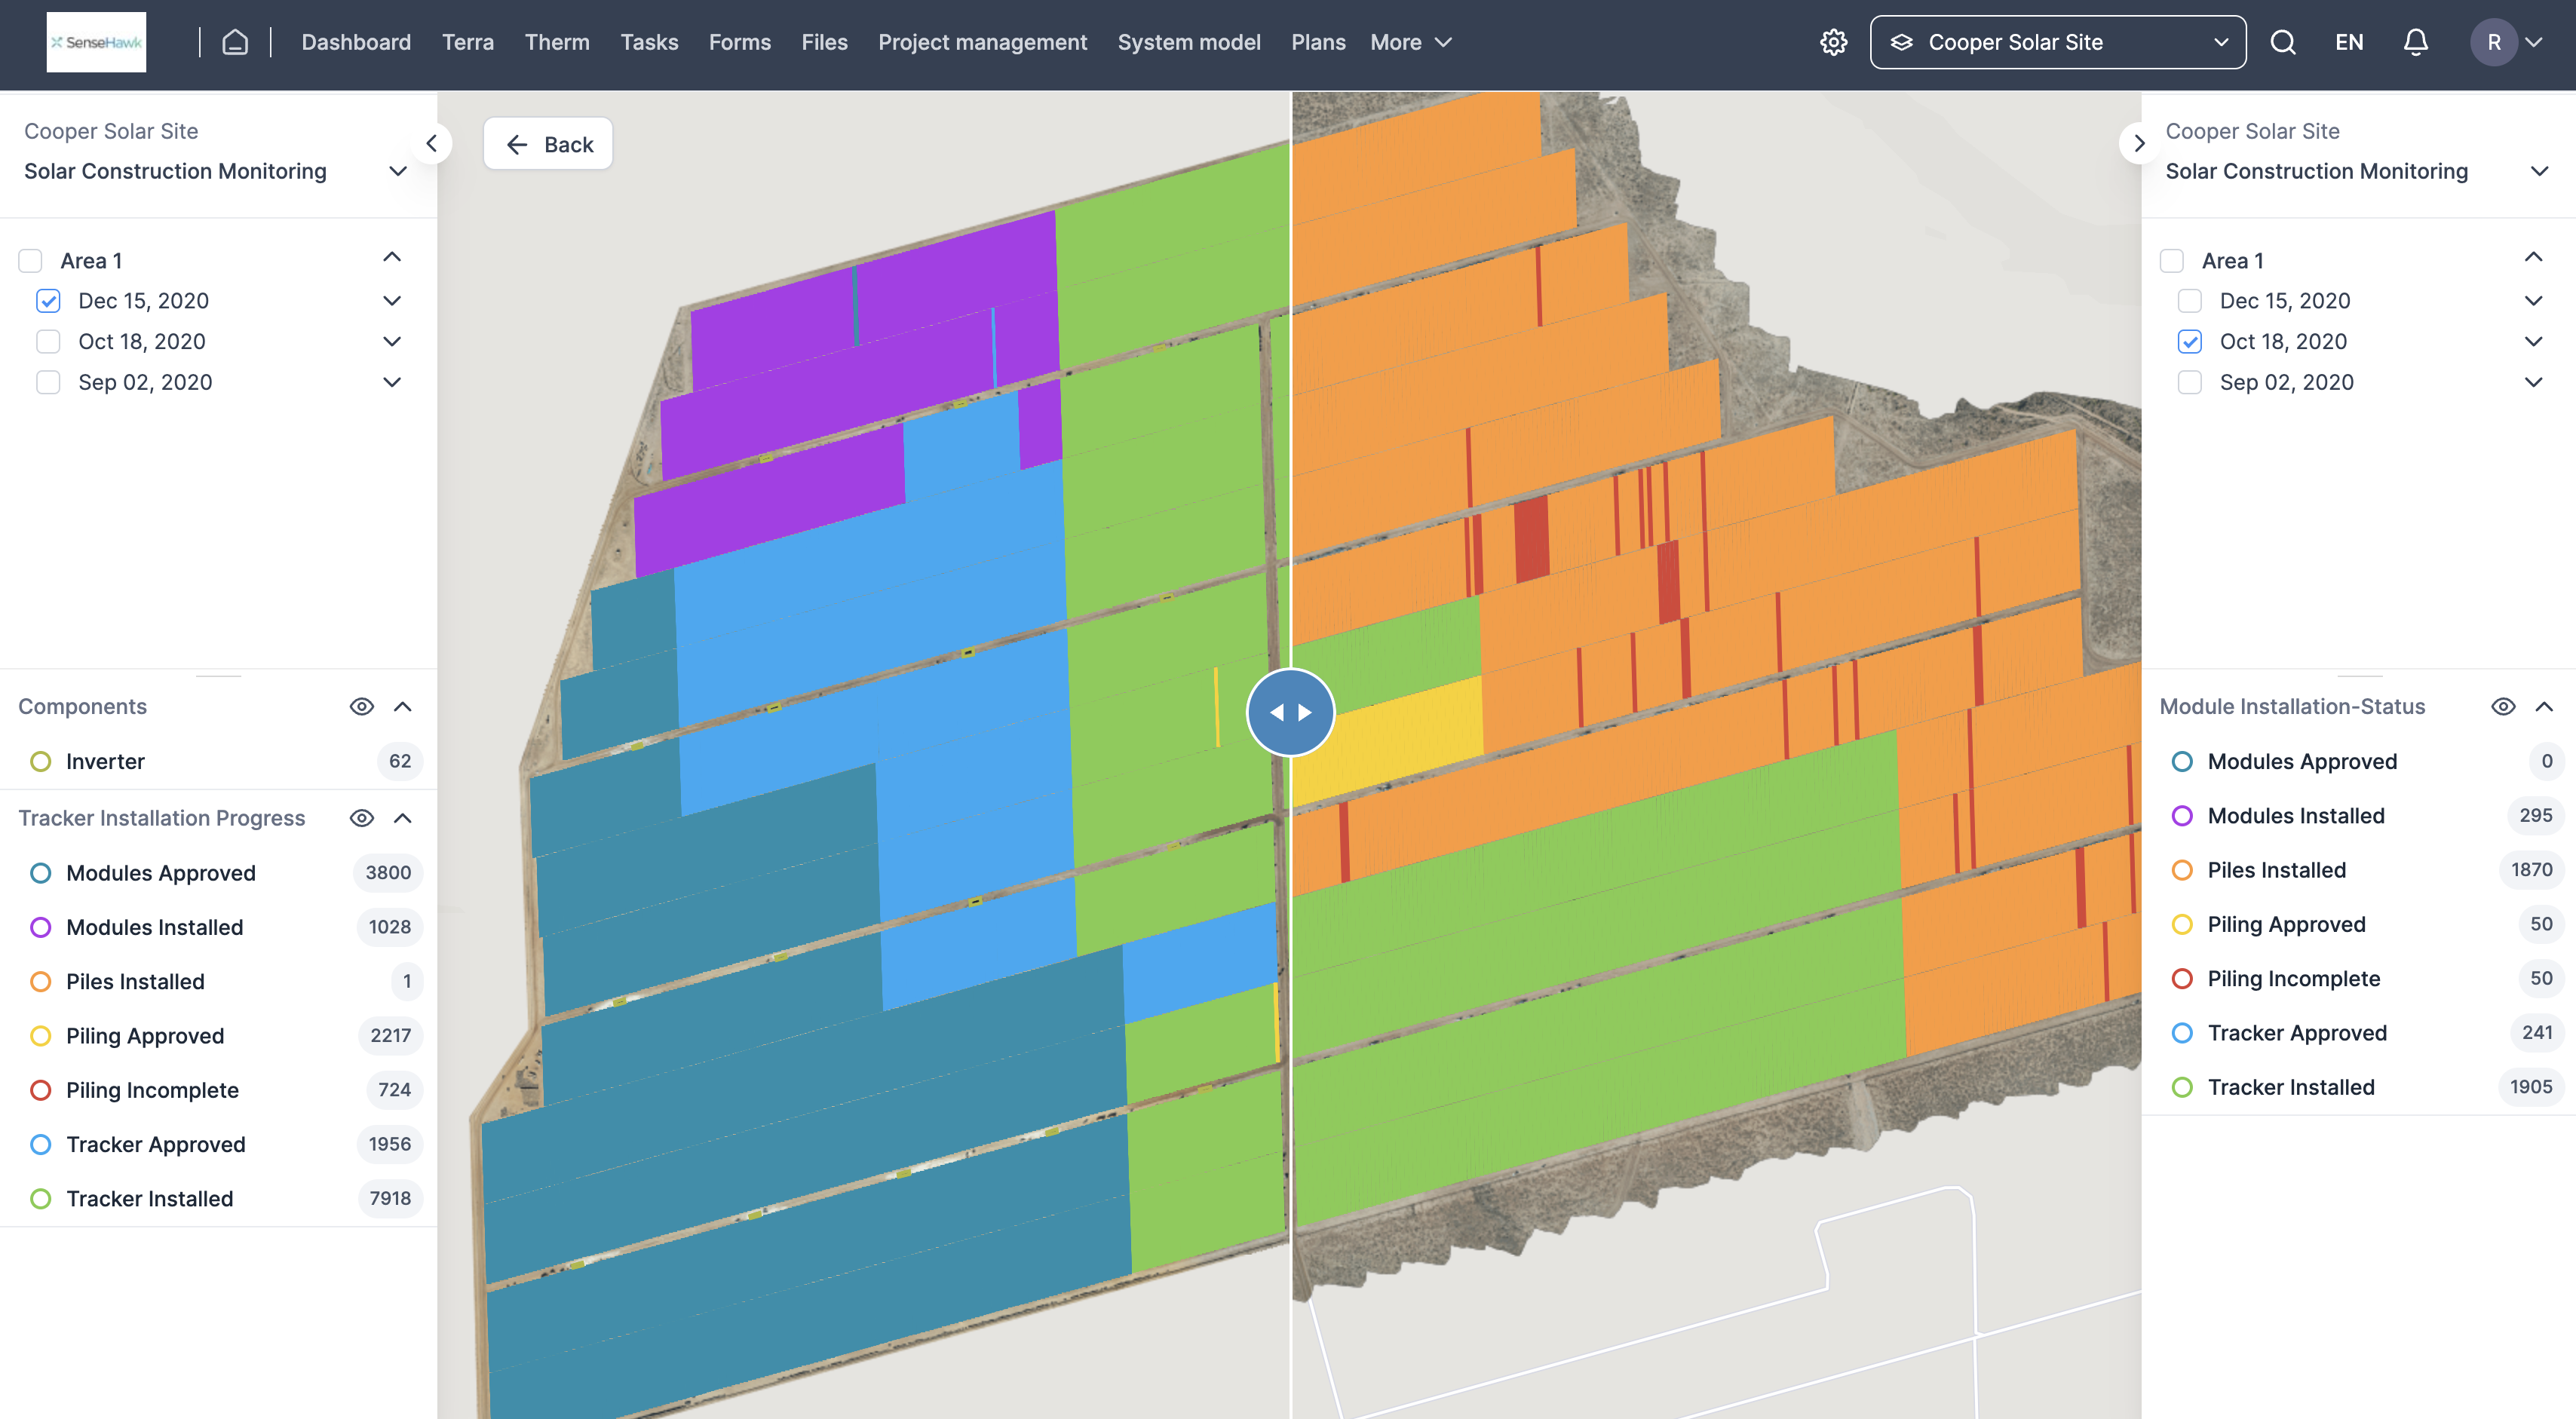
The Compare feature helps track progress between scans. Comparing two scan dates provides an easy visual understanding of the work progress between the selected dates based on the map's colour-coded feature types.
FIGURE 18: COMPARE
FIGURE 18(a): SCAN DATES SELECTION FOR COMPARISION
Reports
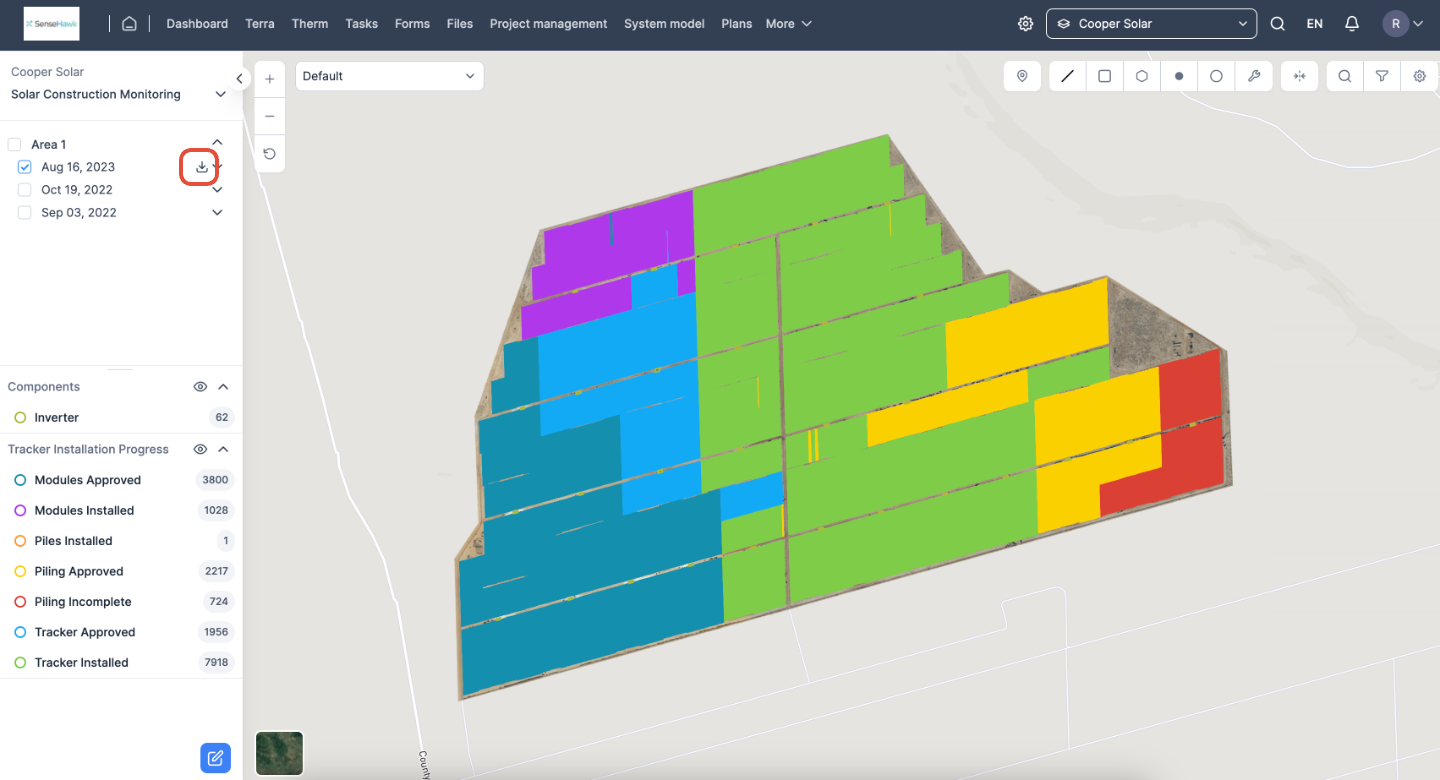
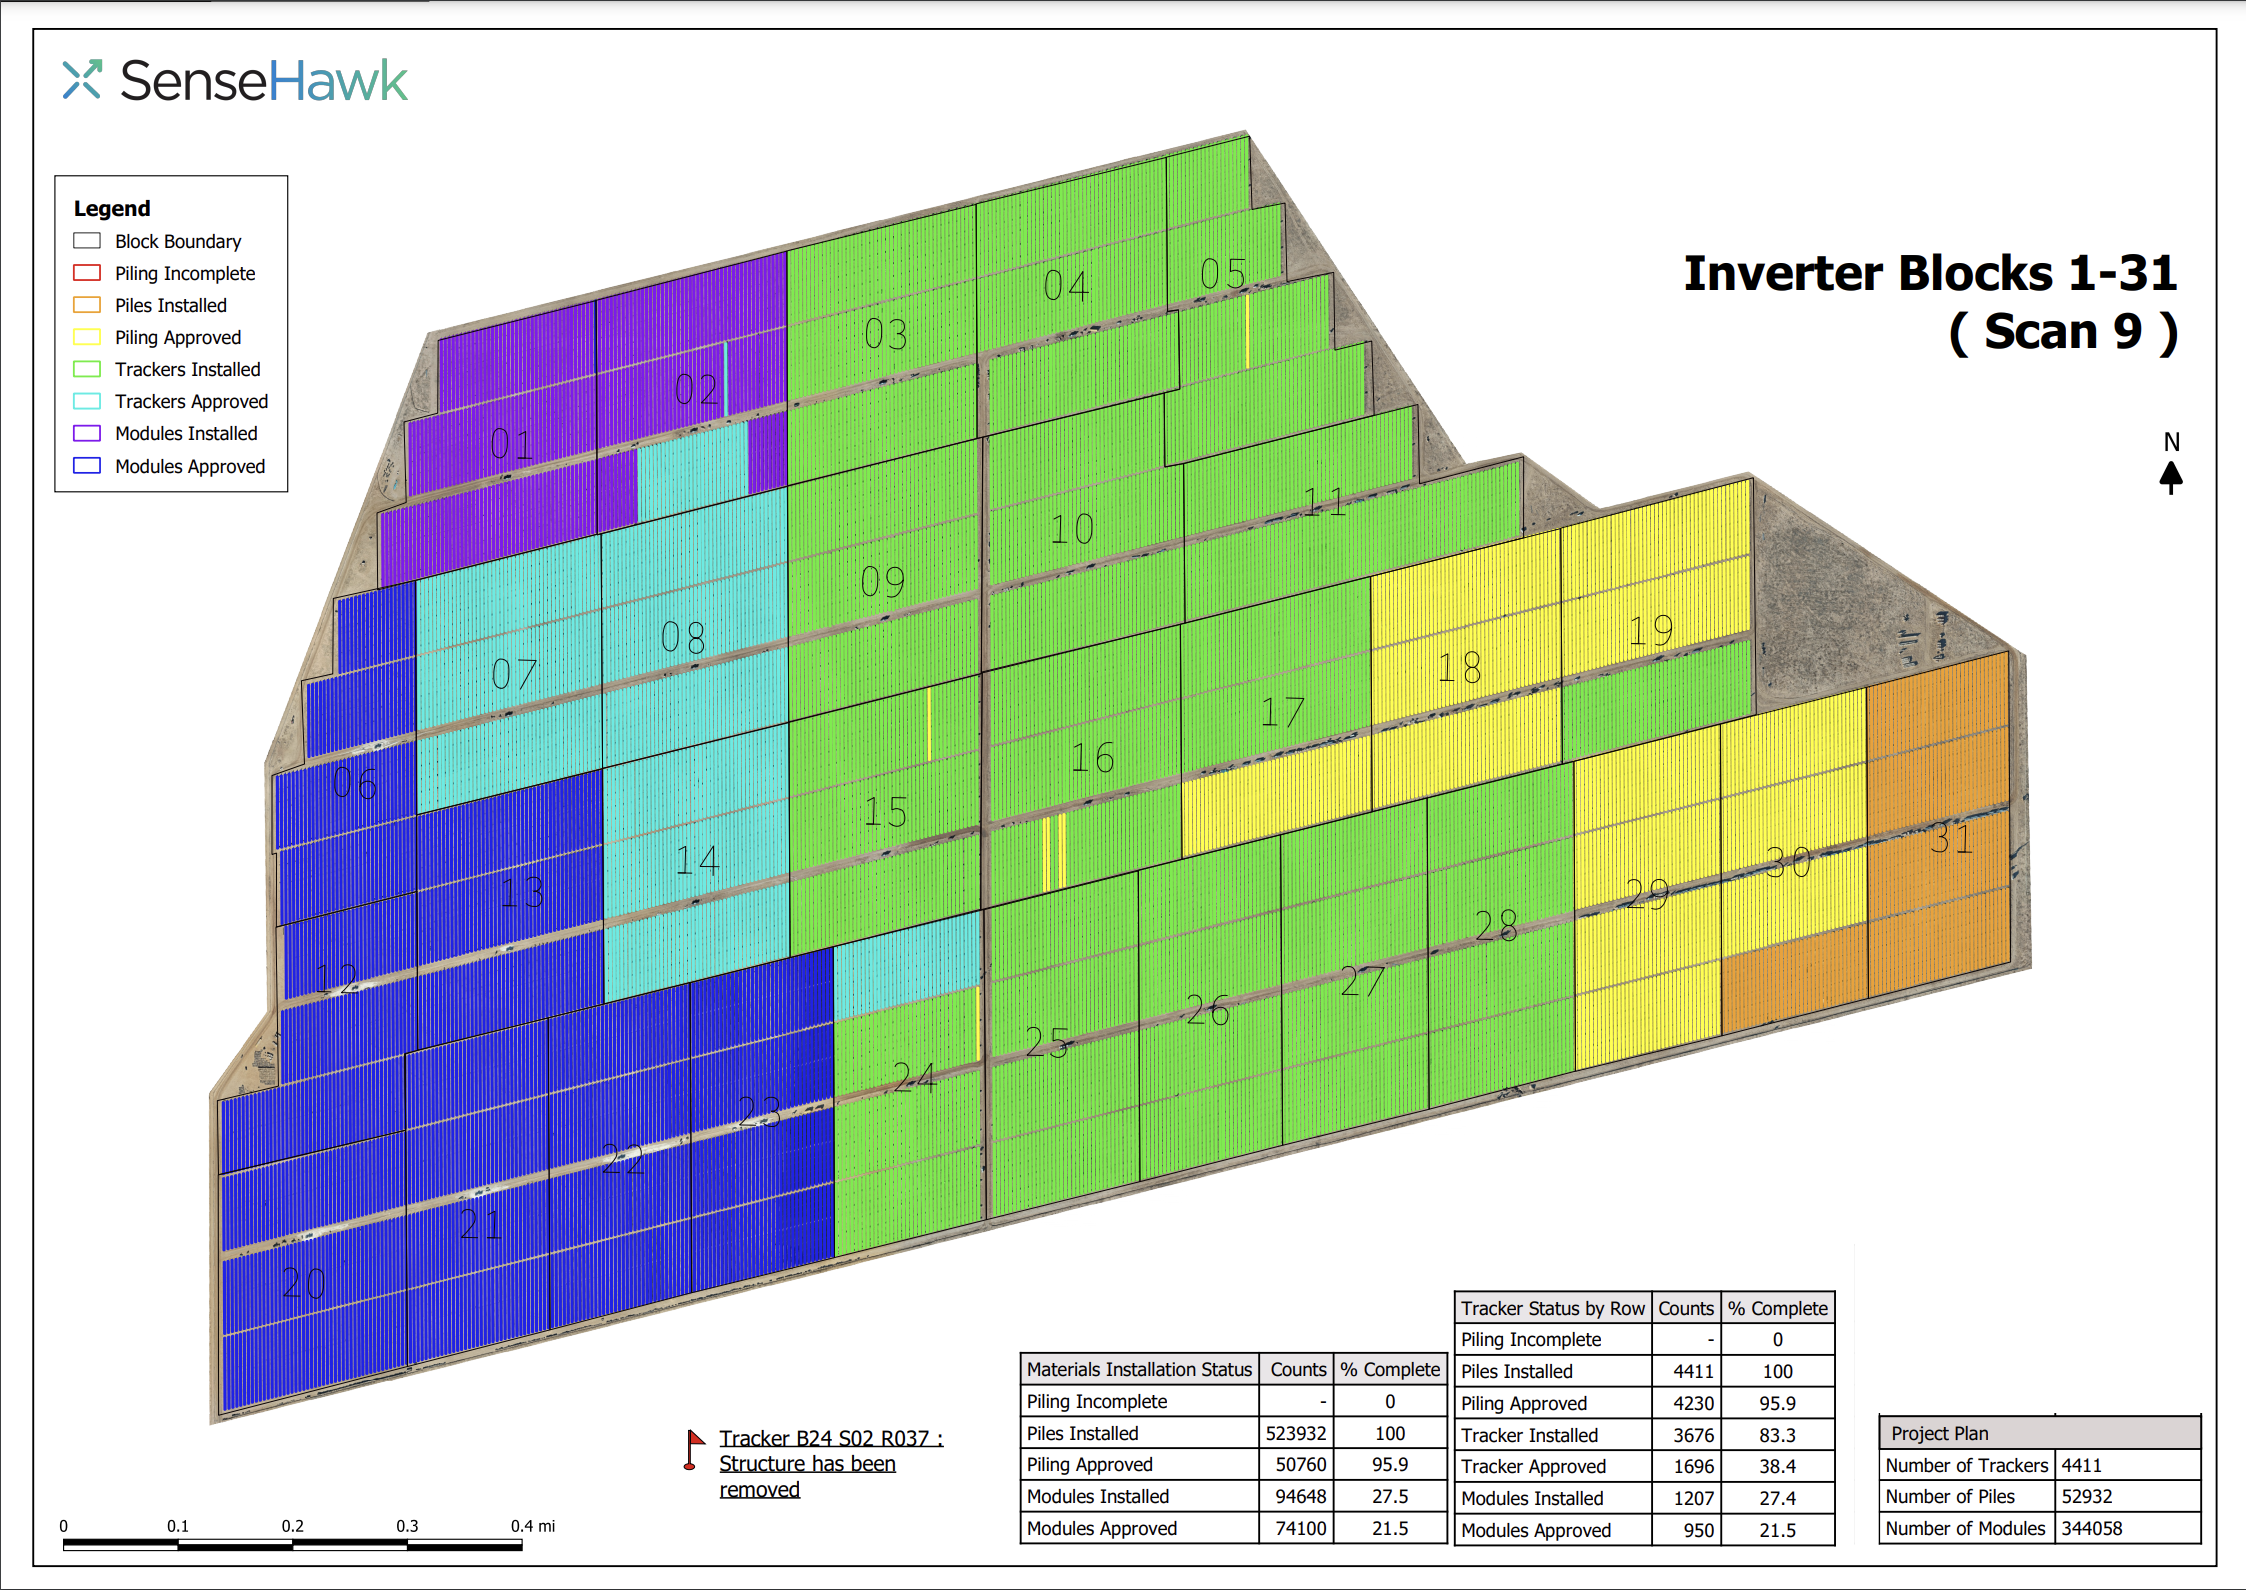
A PDF format can be downloaded by clicking the download icon next to the scan date. Get a detailed understanding of the progress of the construction with the report. Hover over the scan date to download the report.
FIGURE 19: REPORT DOWNLOAD
Sample Report:
FIGURE 19(a): SAMPLE REPORT
Construction Progress Reporting
Overview of Construction Progress Reporting
Guide: Construction Progress Reporting Overview
FIGURE 21: PROGRESS REPORTING ON DESKTOP APPLICATION
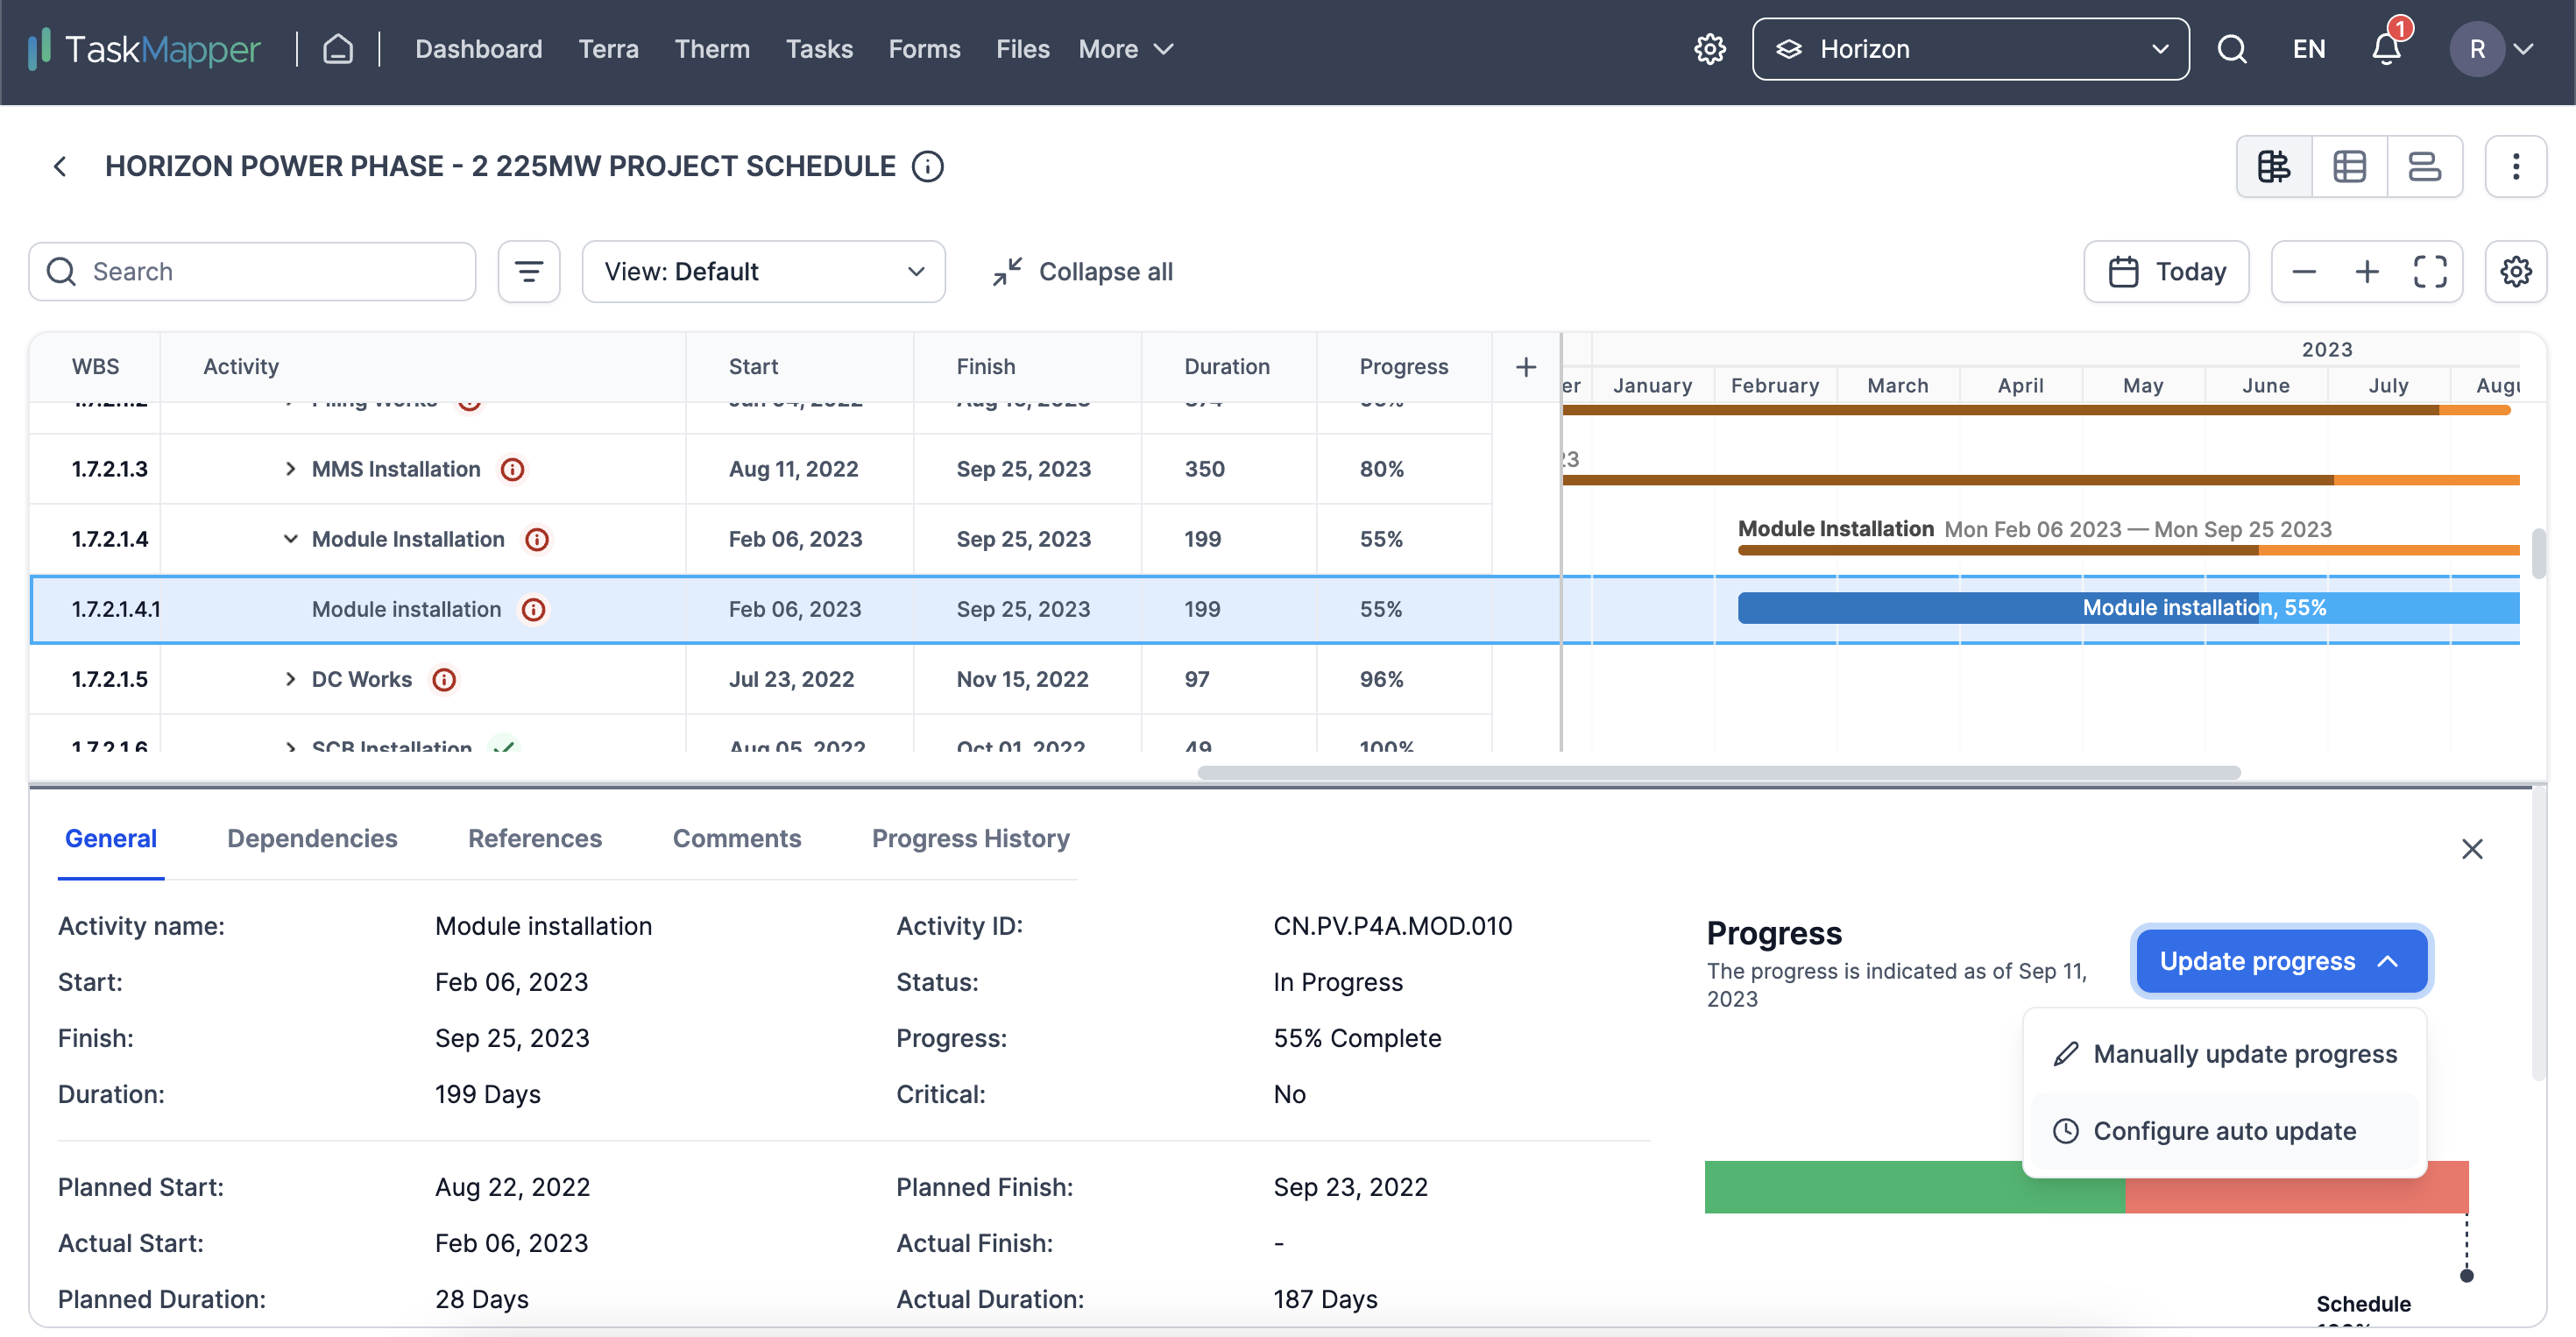
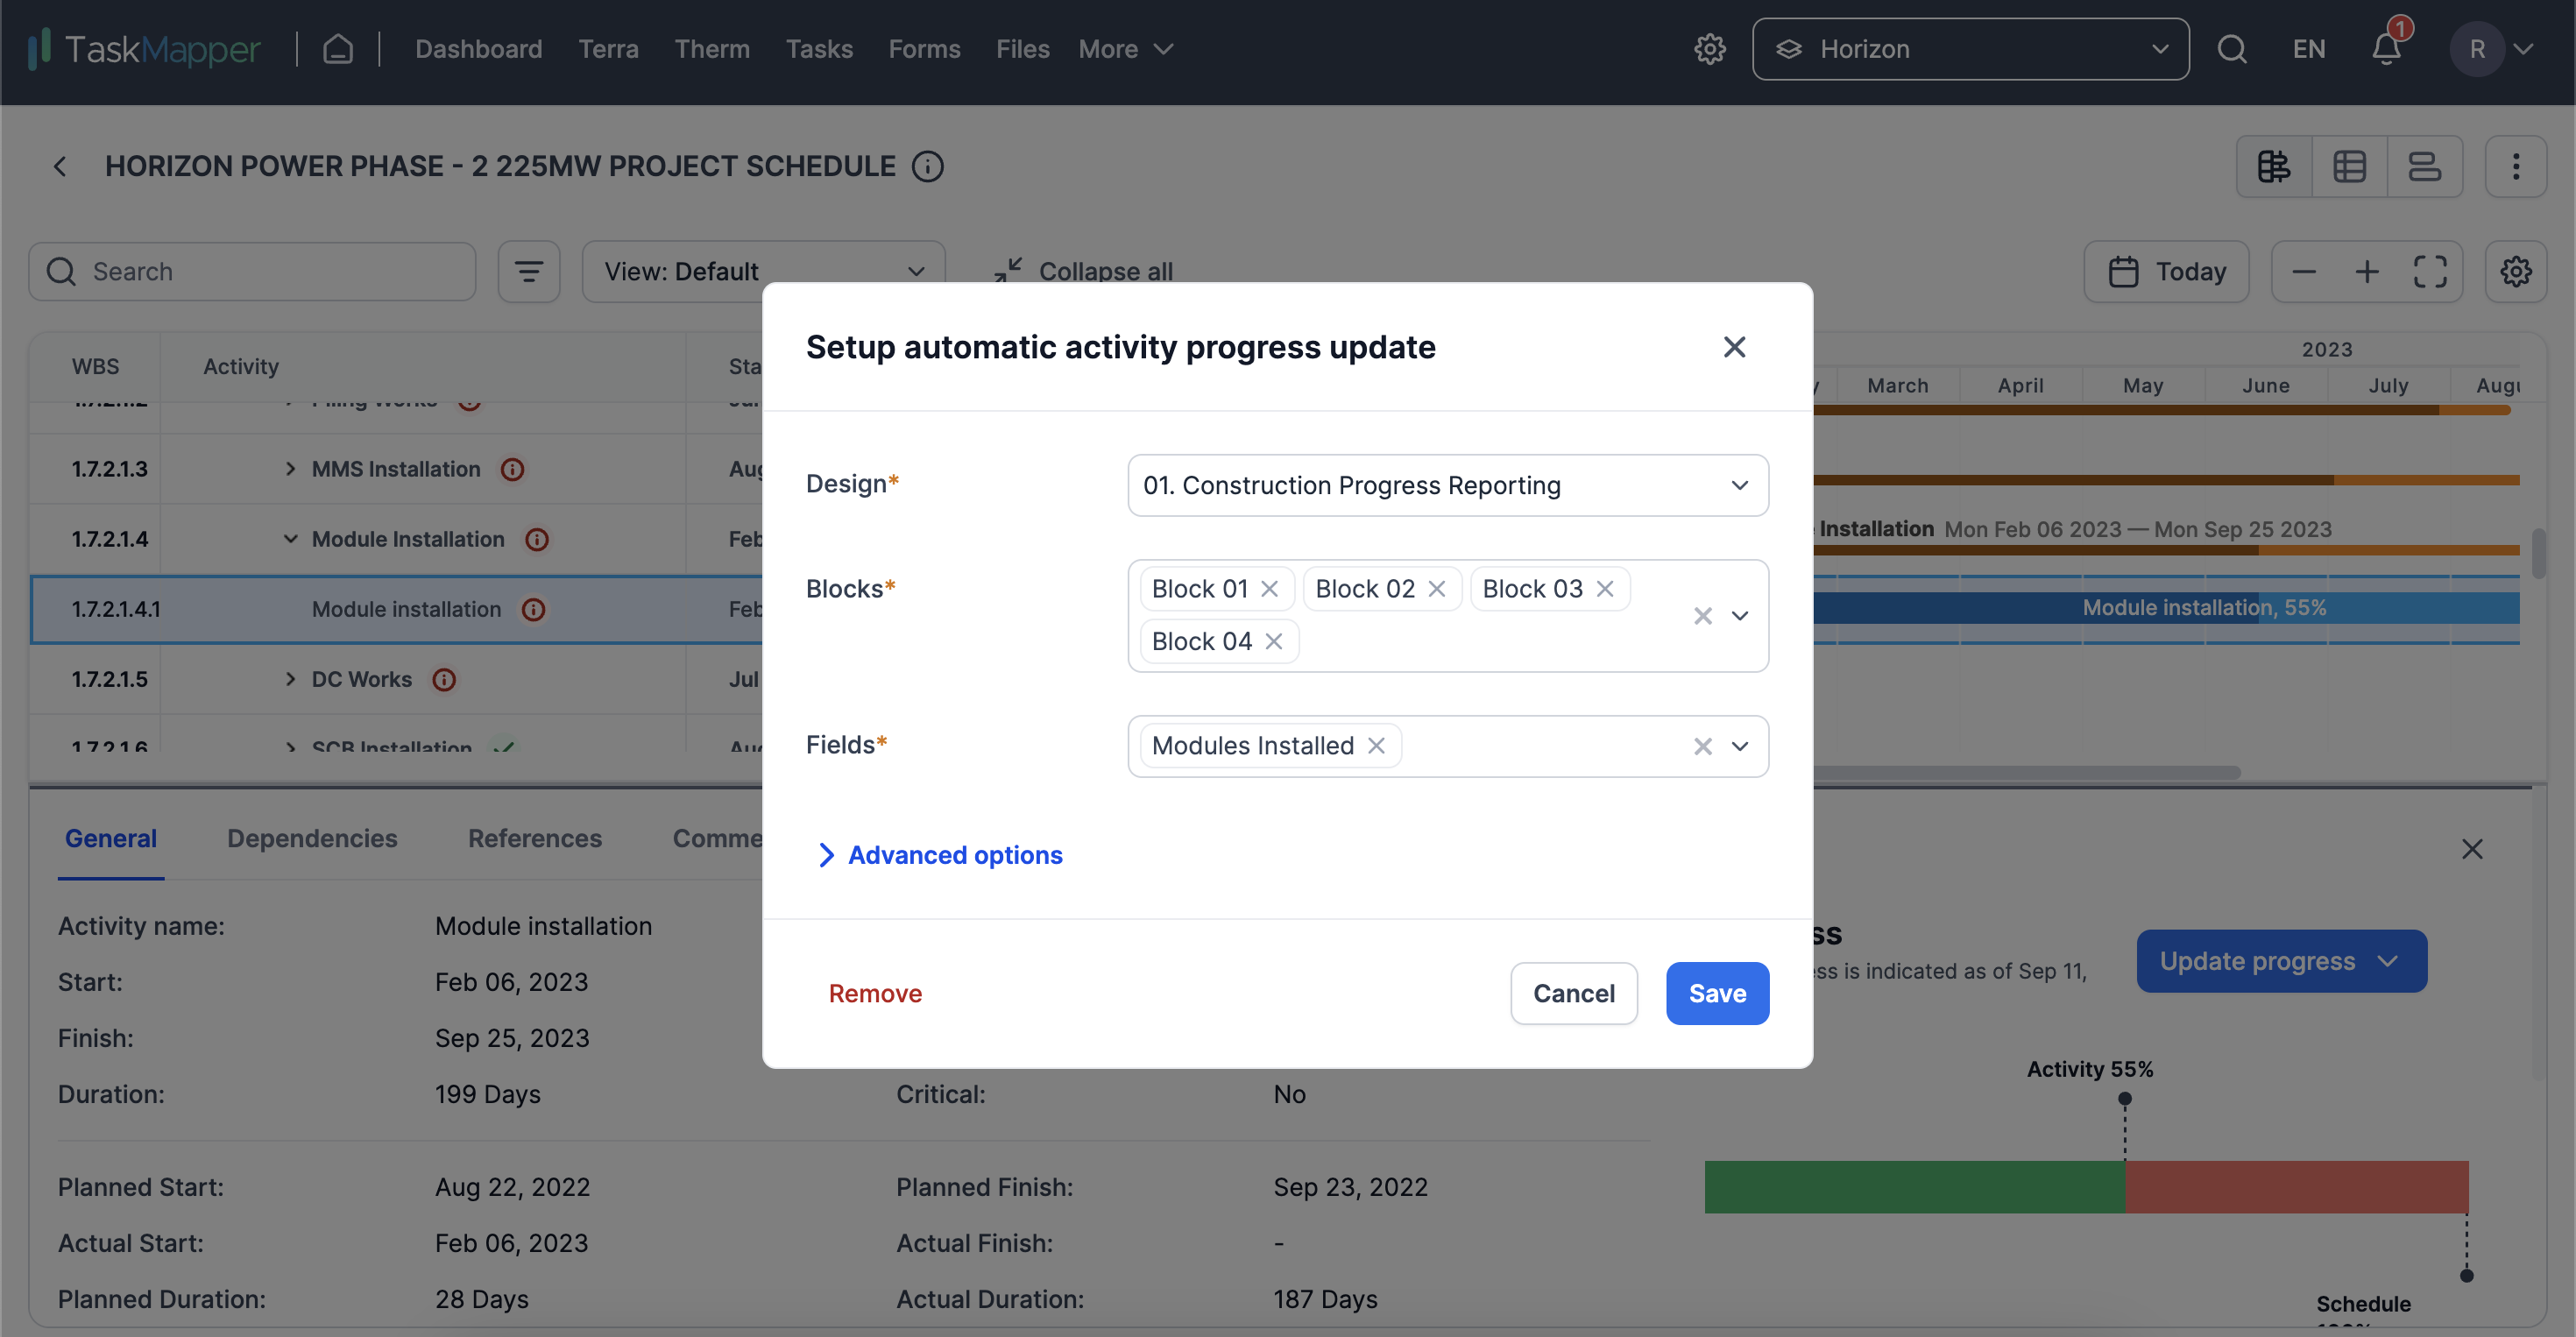
Project schedule and automated progress updates
The project plan is imported, and work is assigned from the WBS. Progress tracking can be automated or entered manually. Daily updates help track progress against the project plan. Both field and office teams can update progress. Tasks and Workflow can be used to assign work and verify quality or progress. The stages of each activity are fully configurable and can be customized based on required reports. The S-curves help visually track actual progress against plans on both costs and schedule.
FIGURE 22: Auto progress configuration in schedules
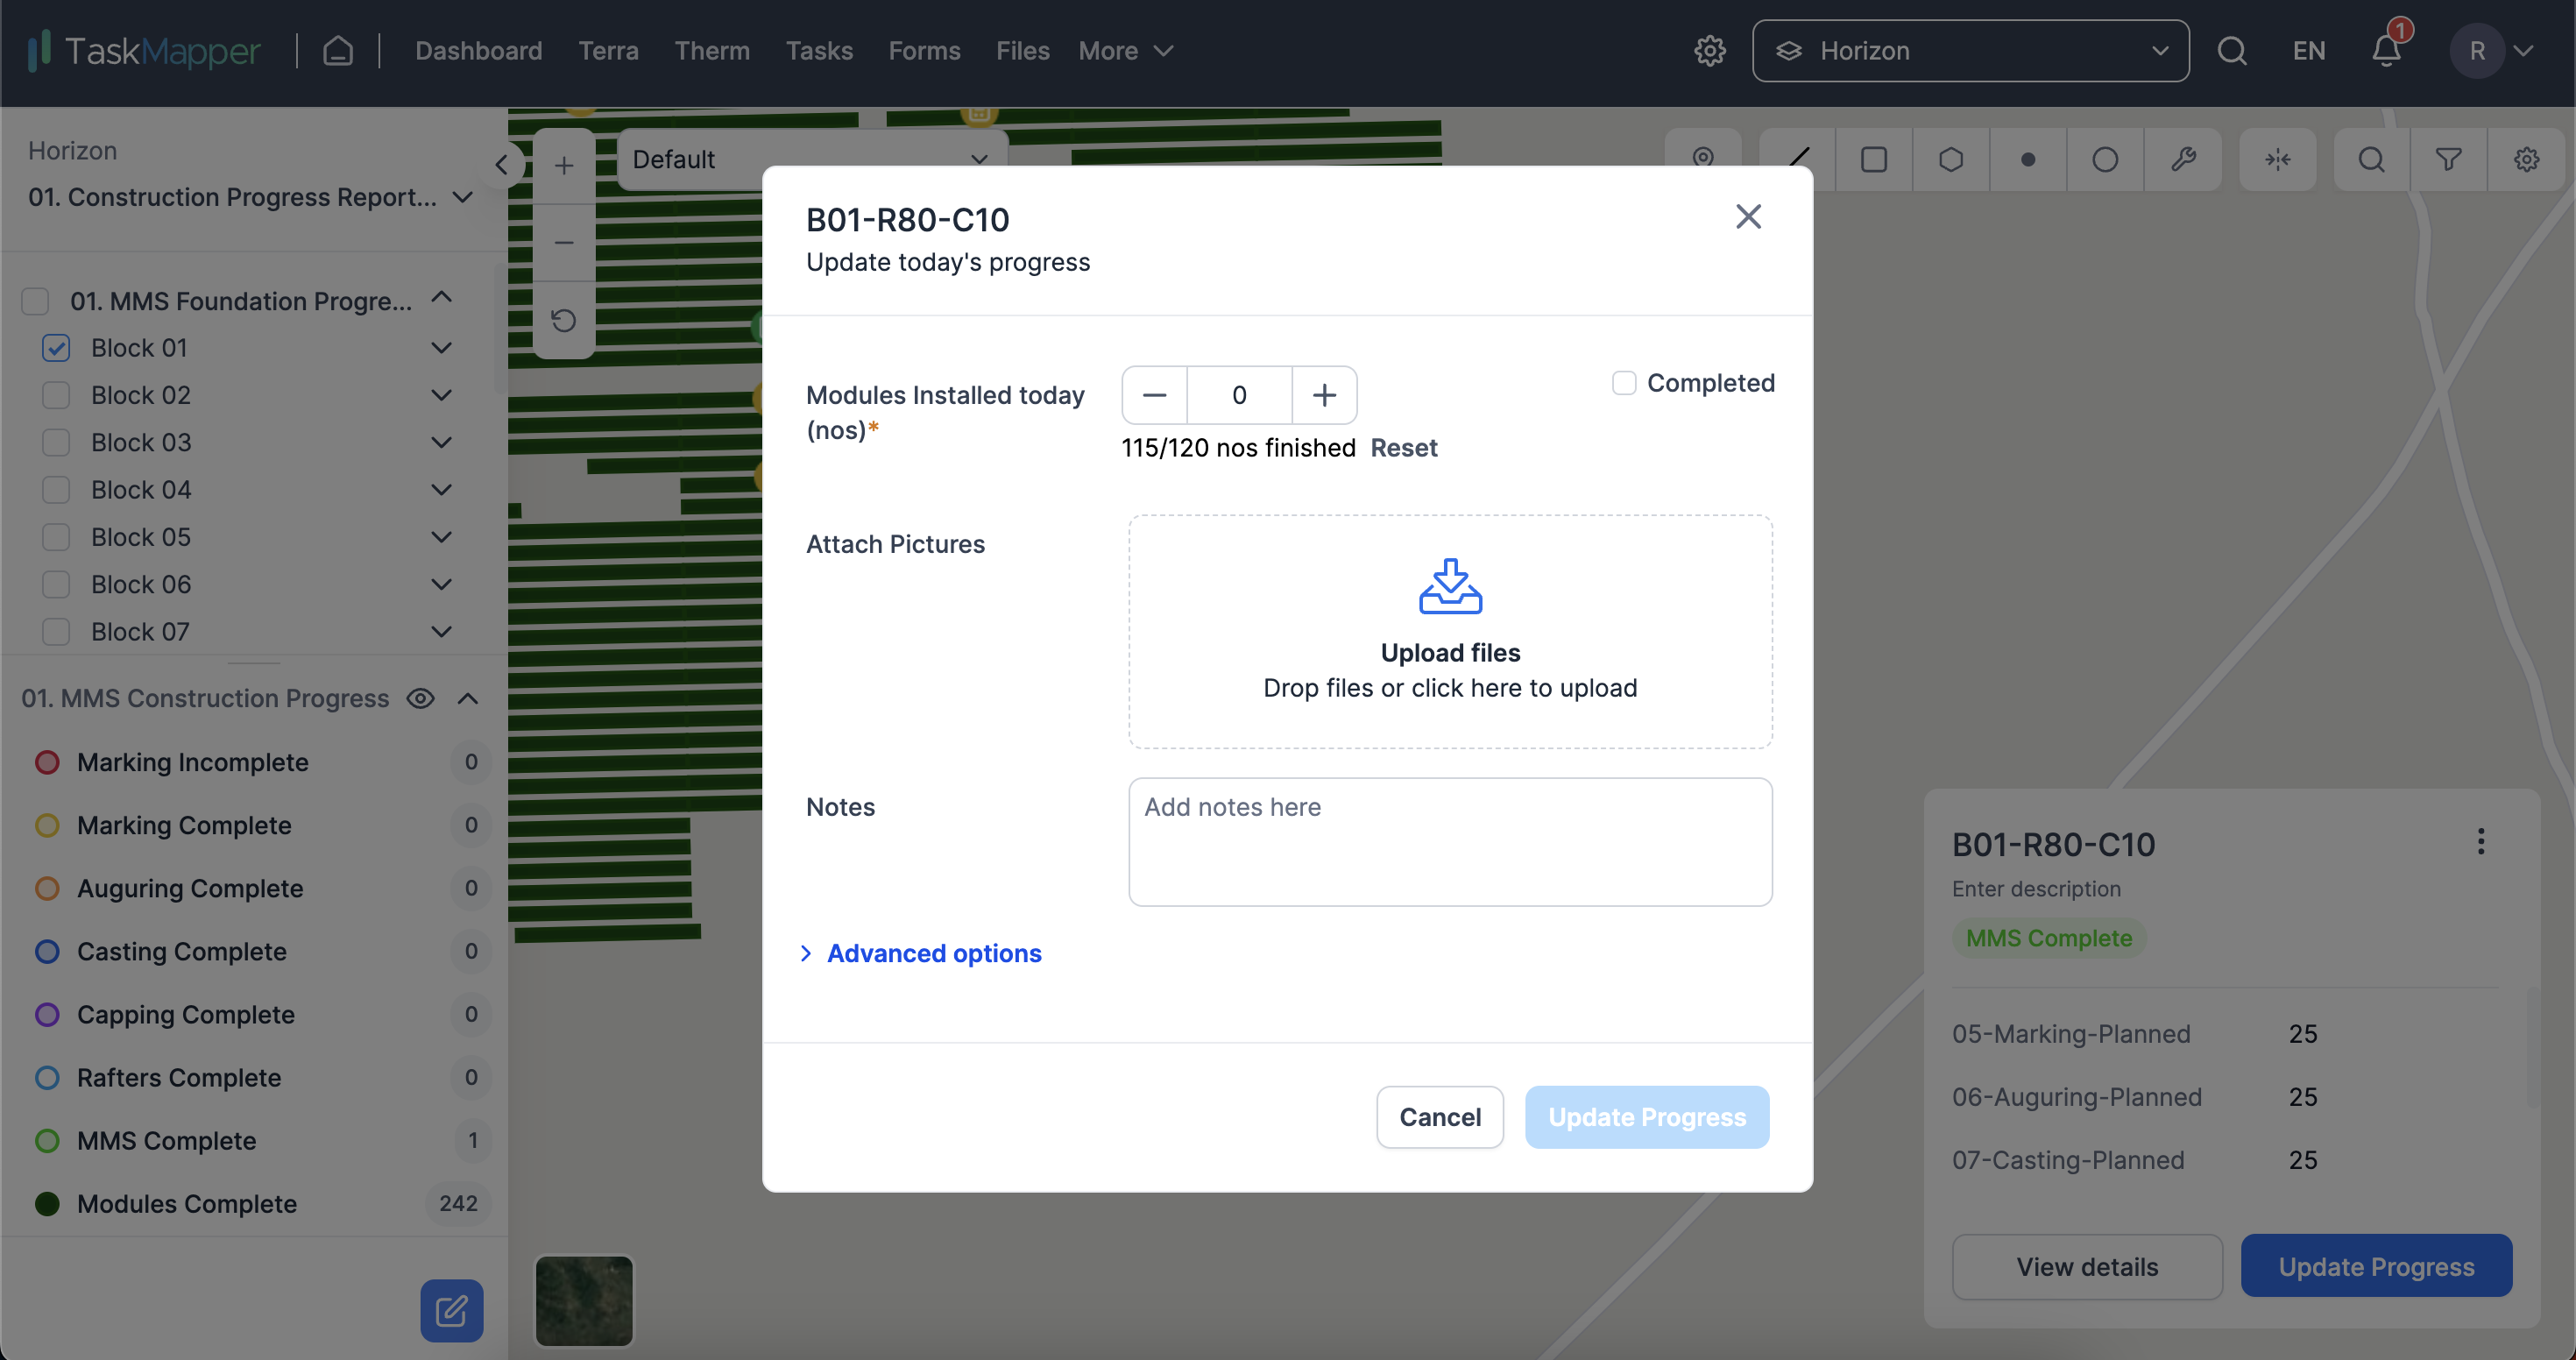
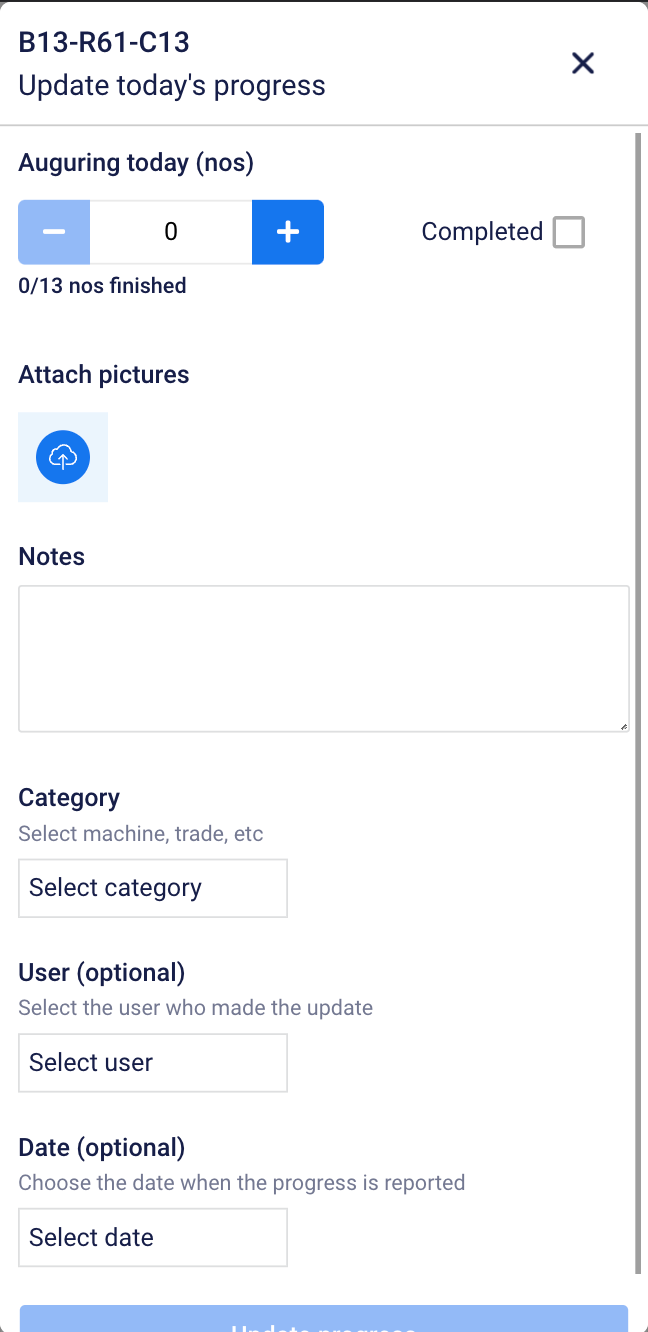
The activity's progress can be updated directly within the system using the Update progress button. This can also be done using our mobile application
FIGURE 23: Update progress in maps which will automatically update the progress in schedules
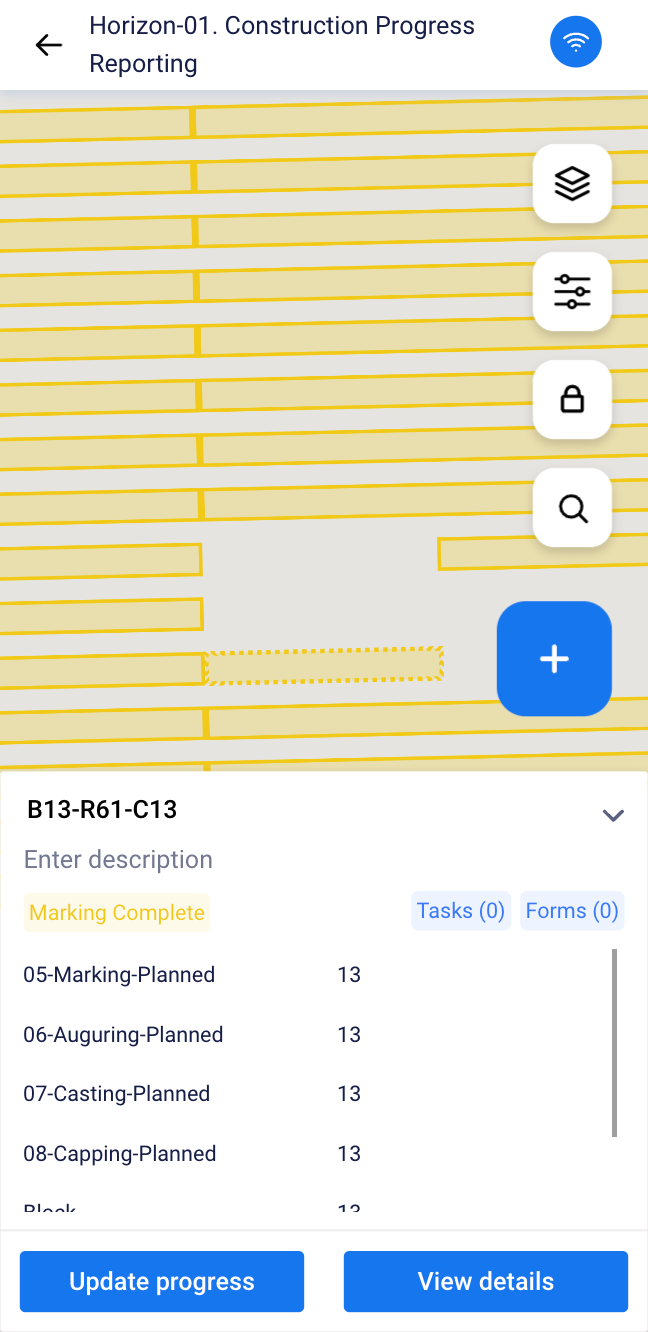
FIGURE 24: PROGRESS REPORTING ON MOBILE APPLICATION
The activity's progress is automatically rolled up to the corresponding WBS, updating all its ancestor's progress. By default, the progress weightages are considered equally distributed while rolling up. We support custom weightages for different activities at different levels as well.
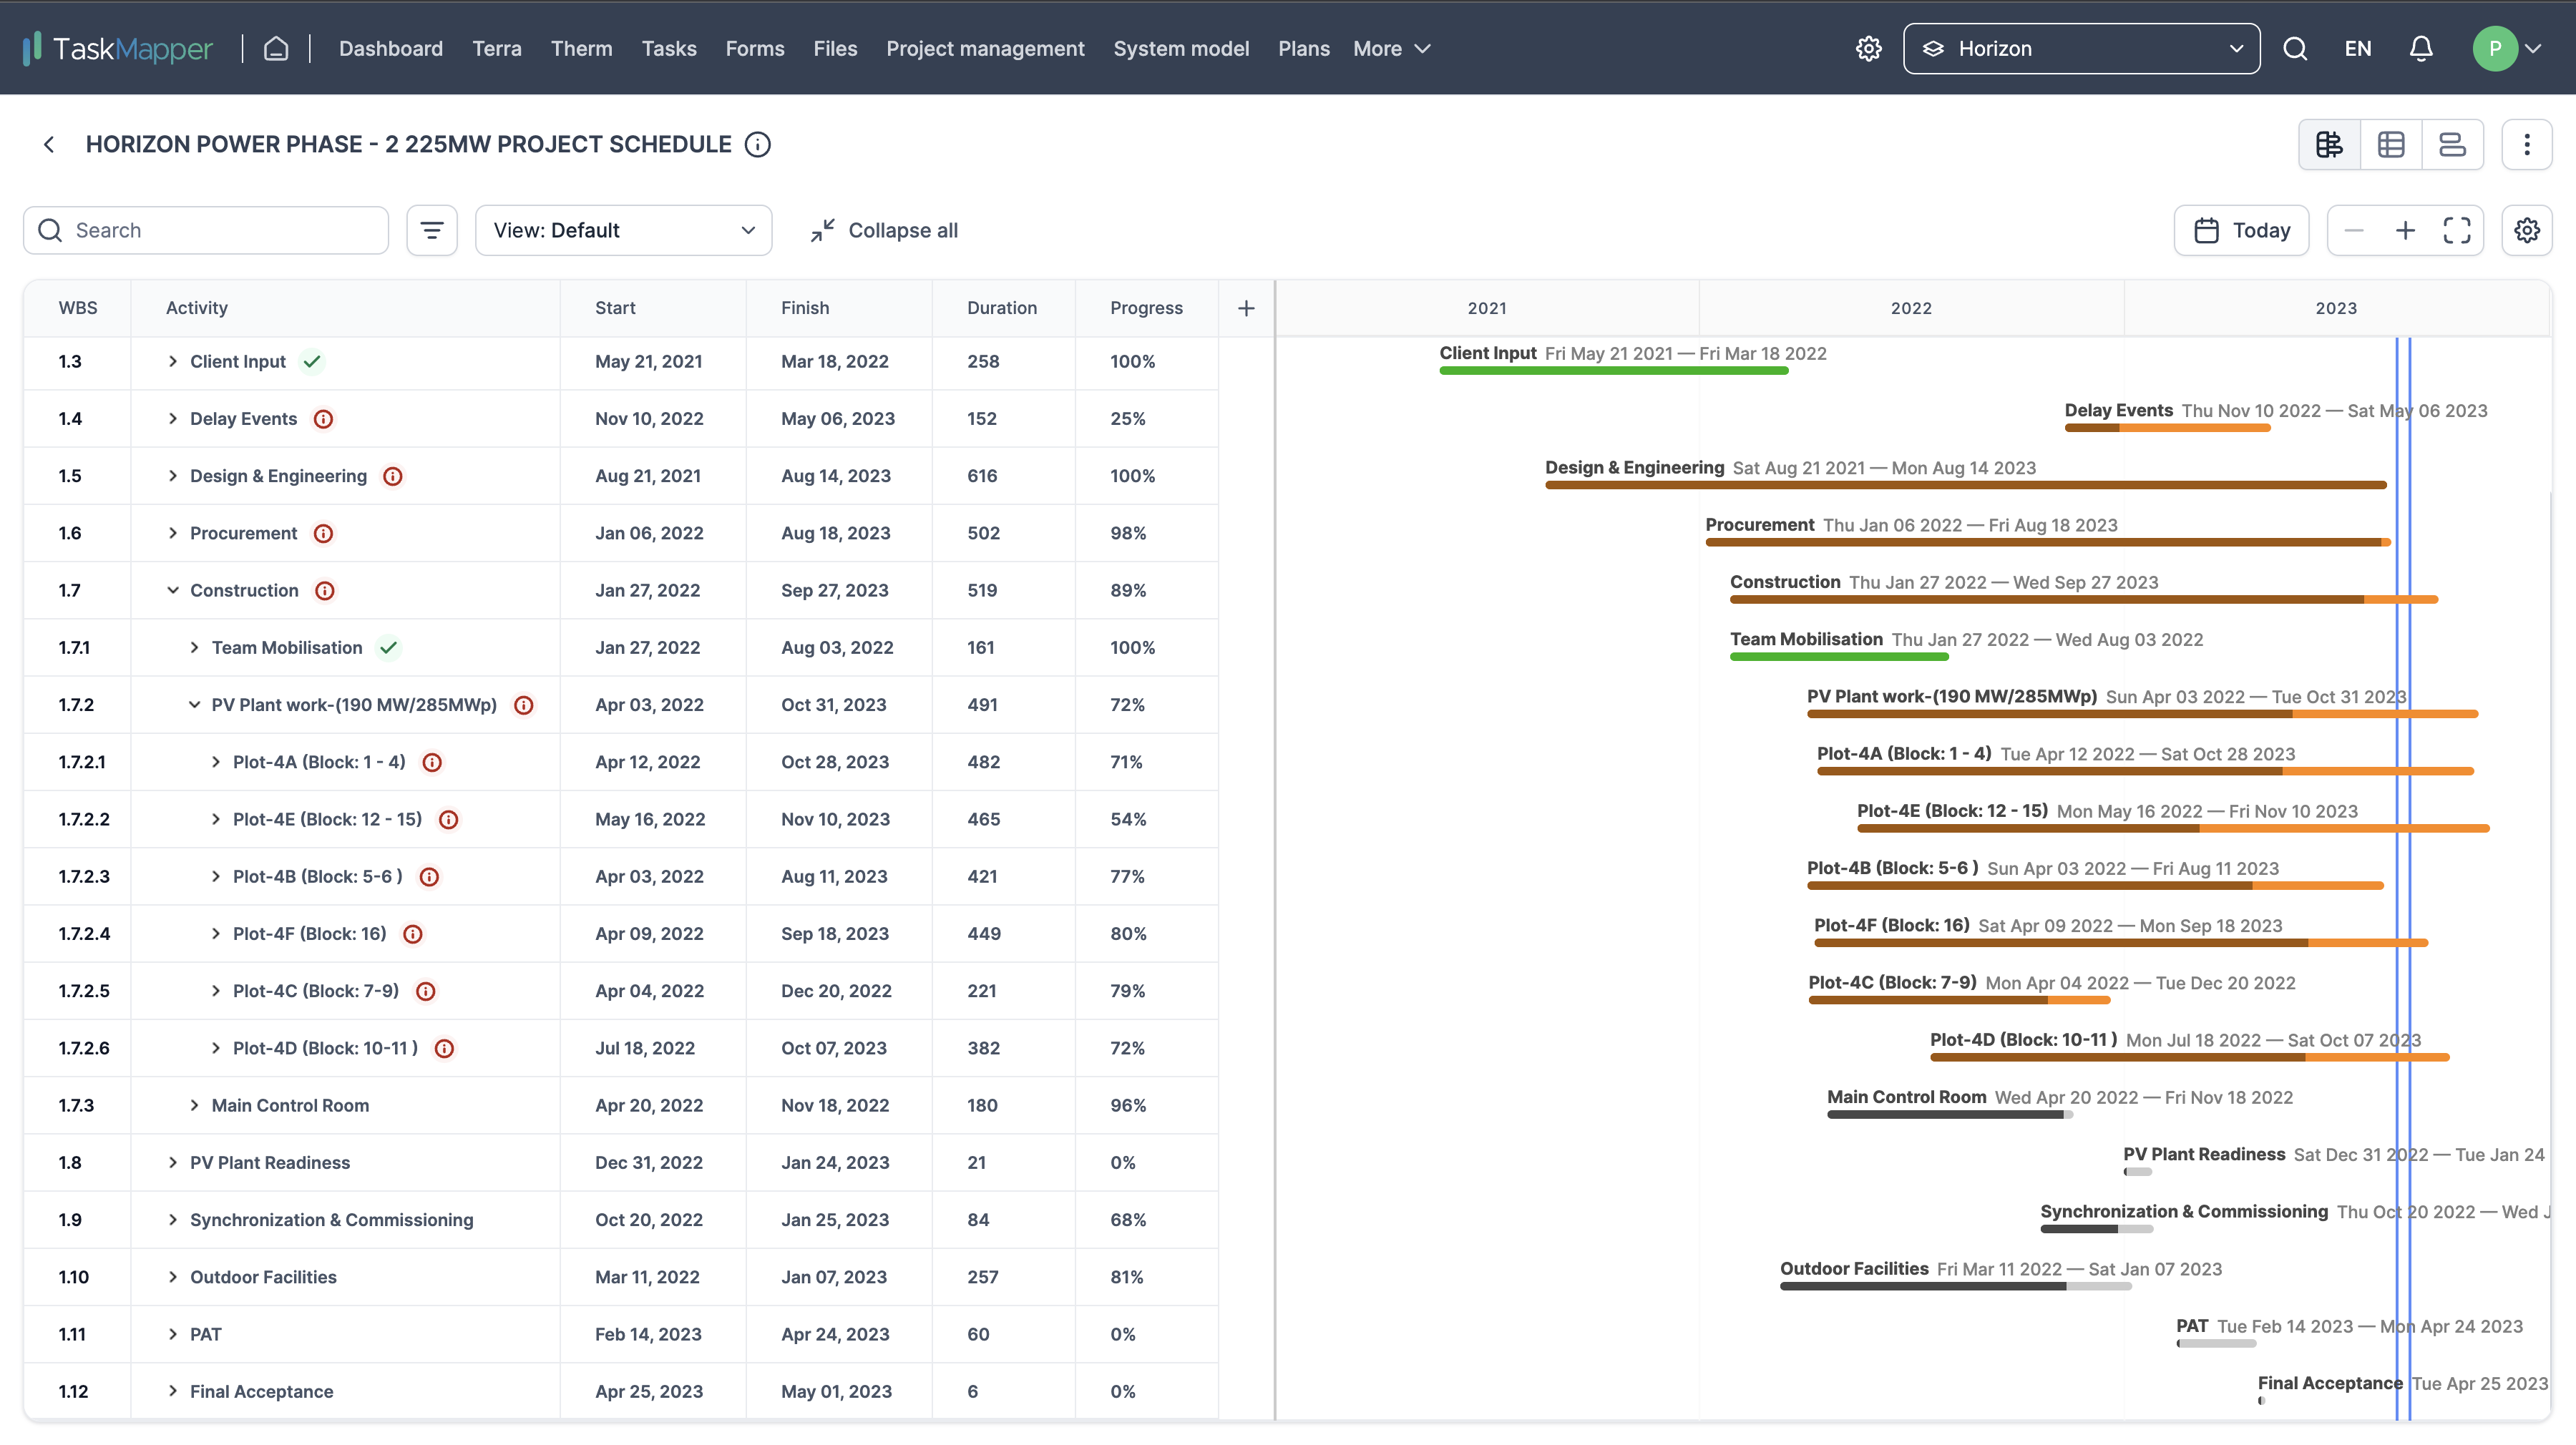
Import your project schedule and link individual components to the associated work packages on the component hierarchy.
FIGURE 25: PROJECT SCHEDULE
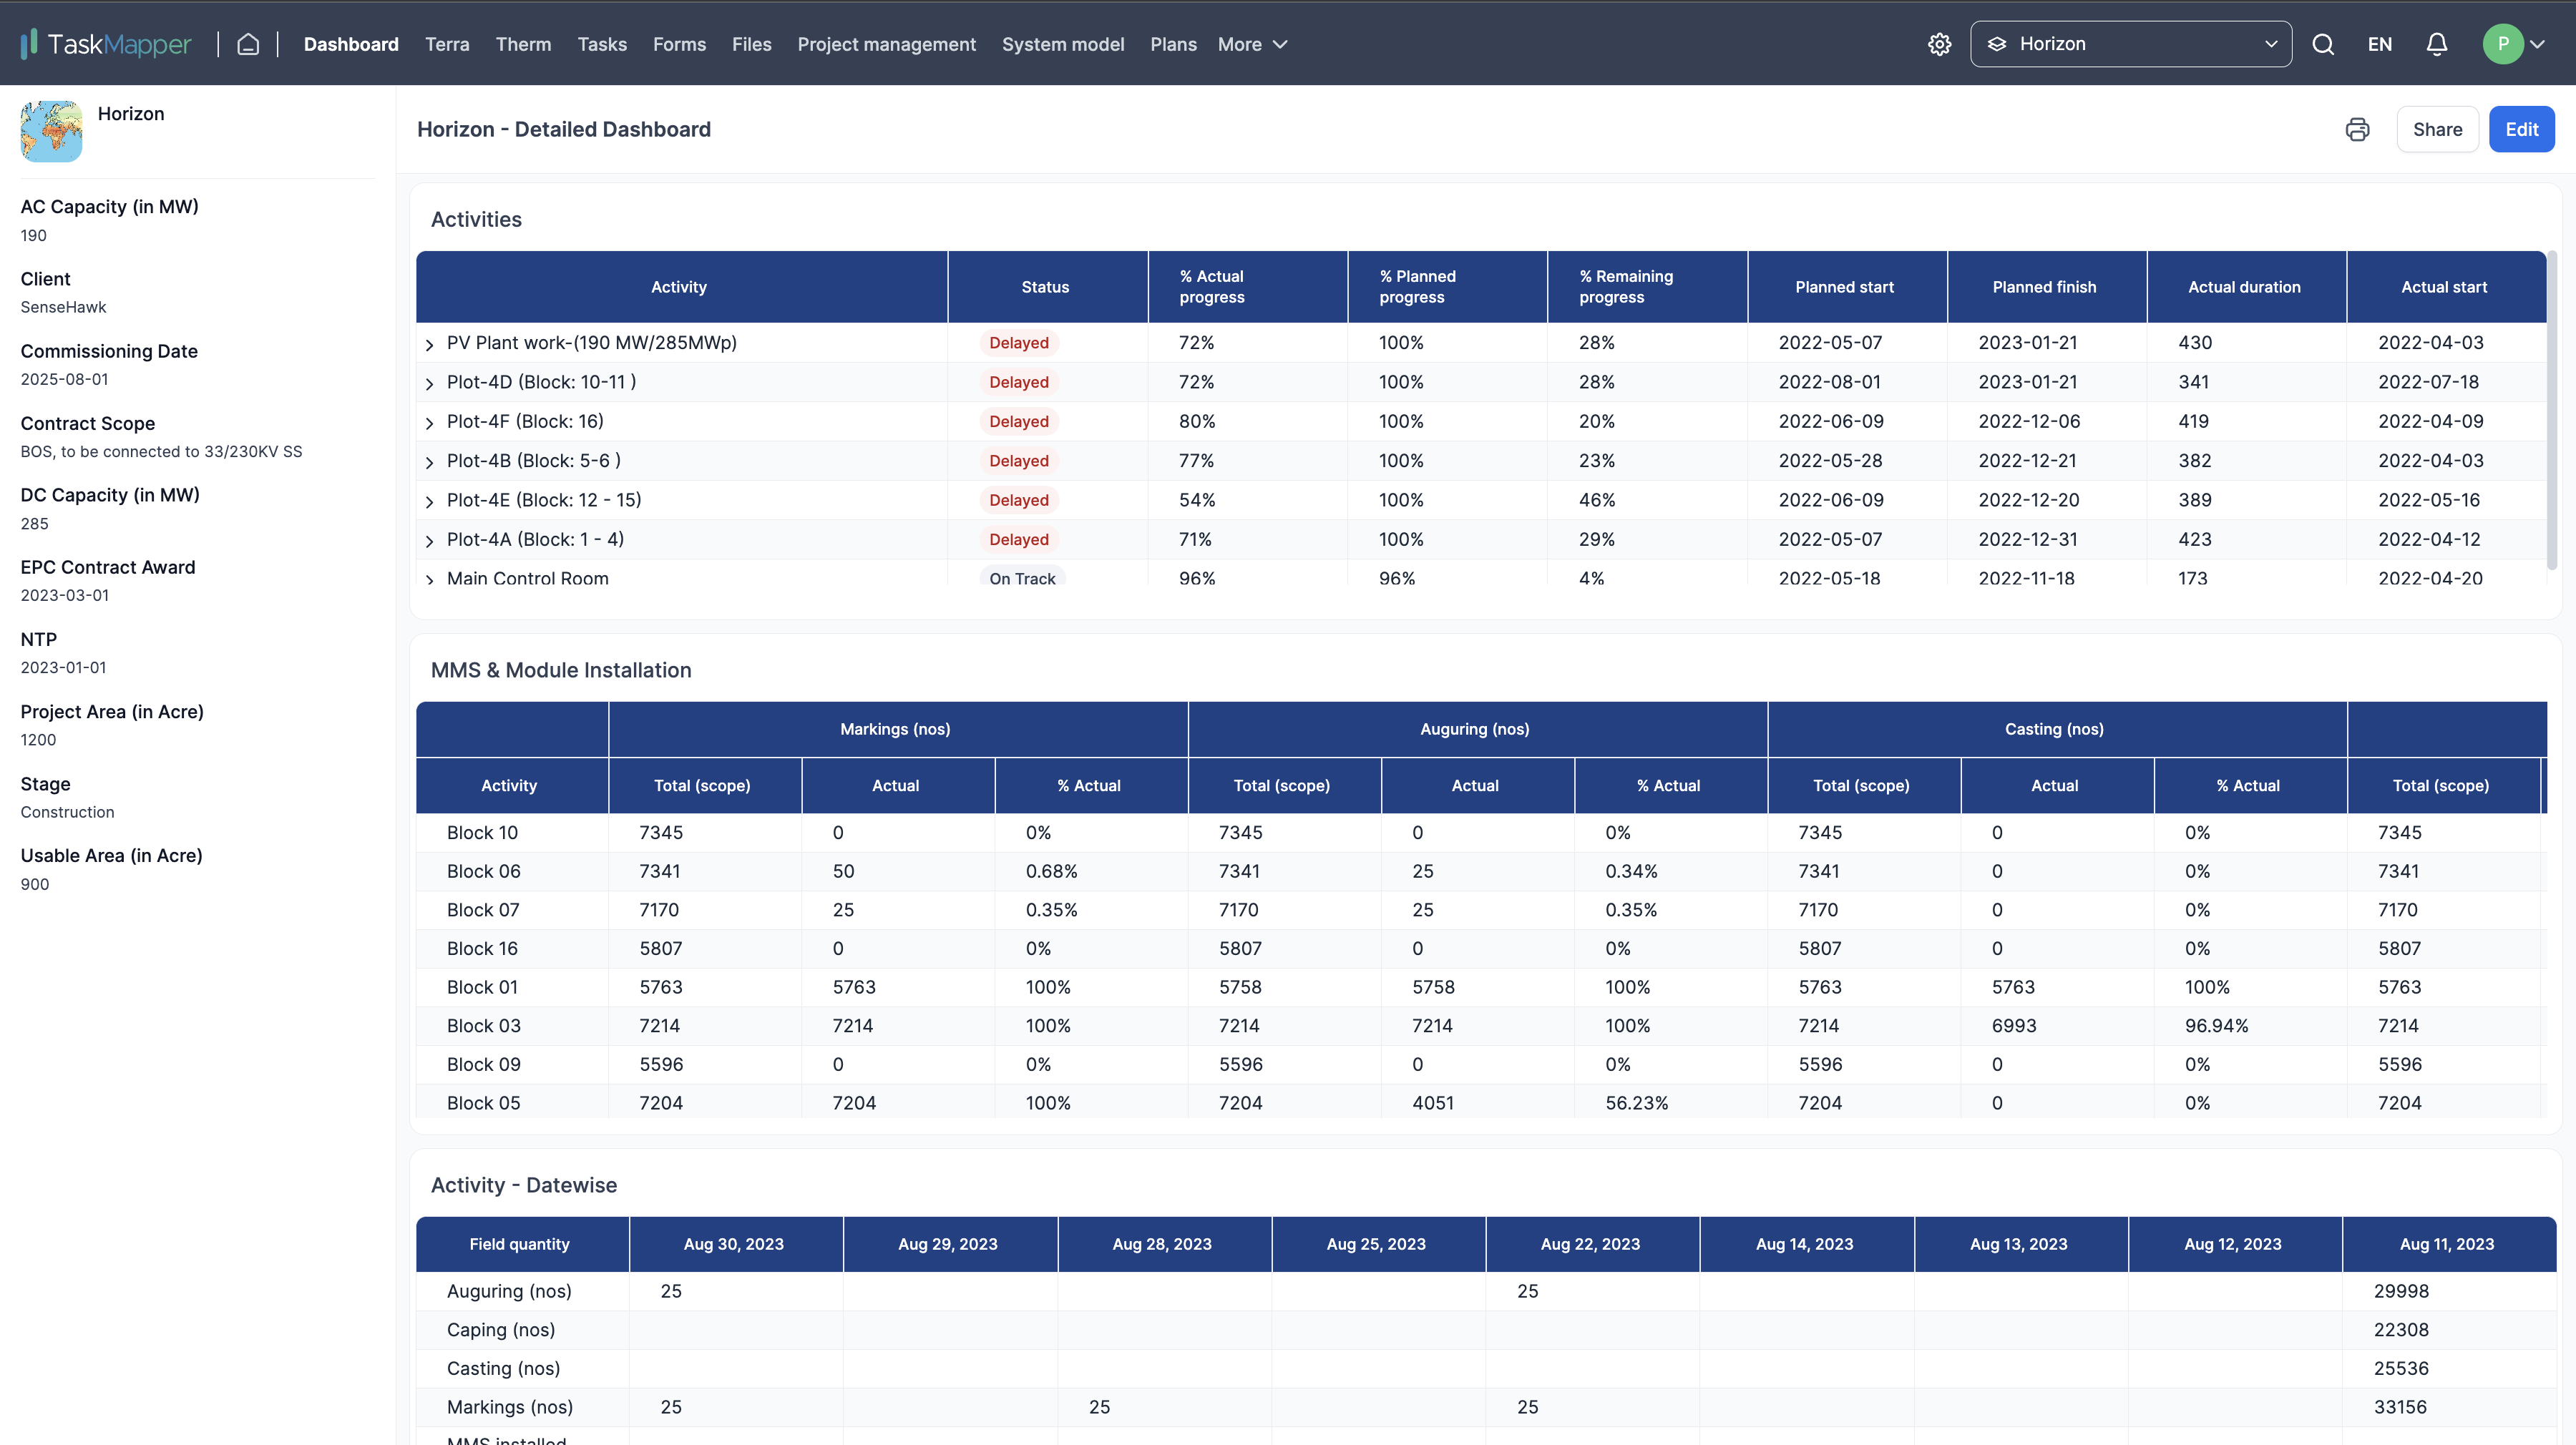
Use this to compare progress against the plan based on the project schedule.
FIGURE 26: DASHBOARD TO TRACK PROJECT PROGRESS
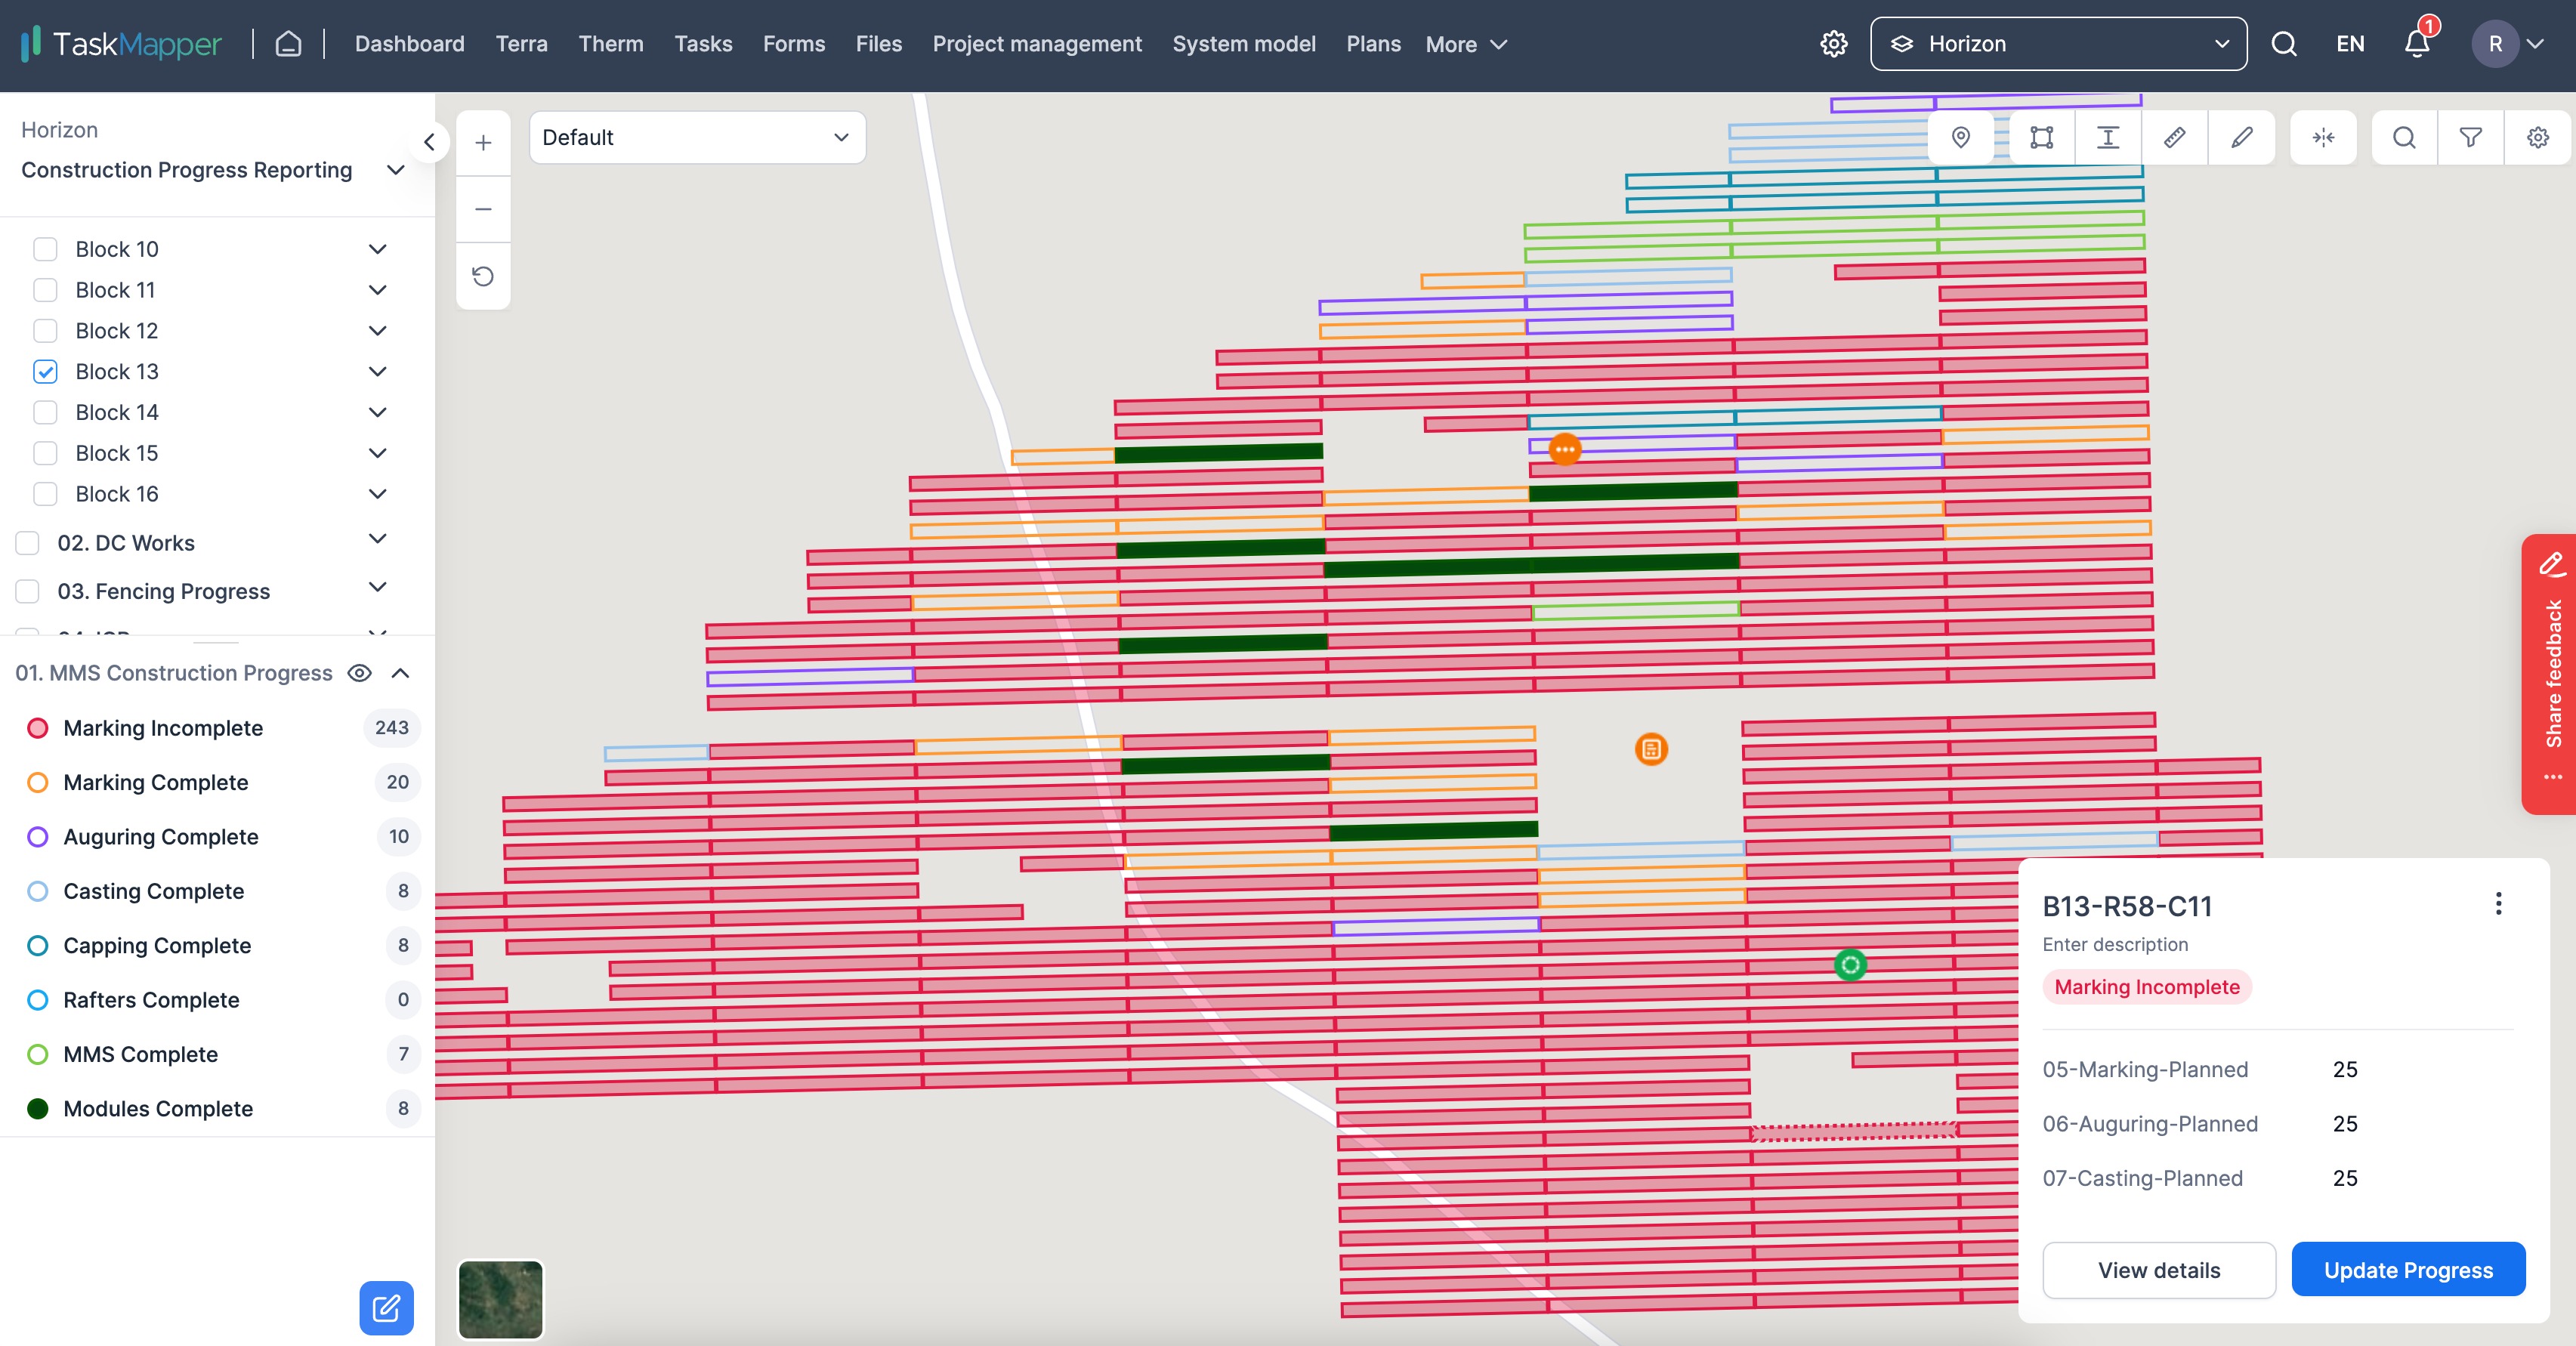
Monitor and track construction progress
Import and fuse data from periodic drone scans, field inspection reports, and more. Compare construction progress against your schedule.
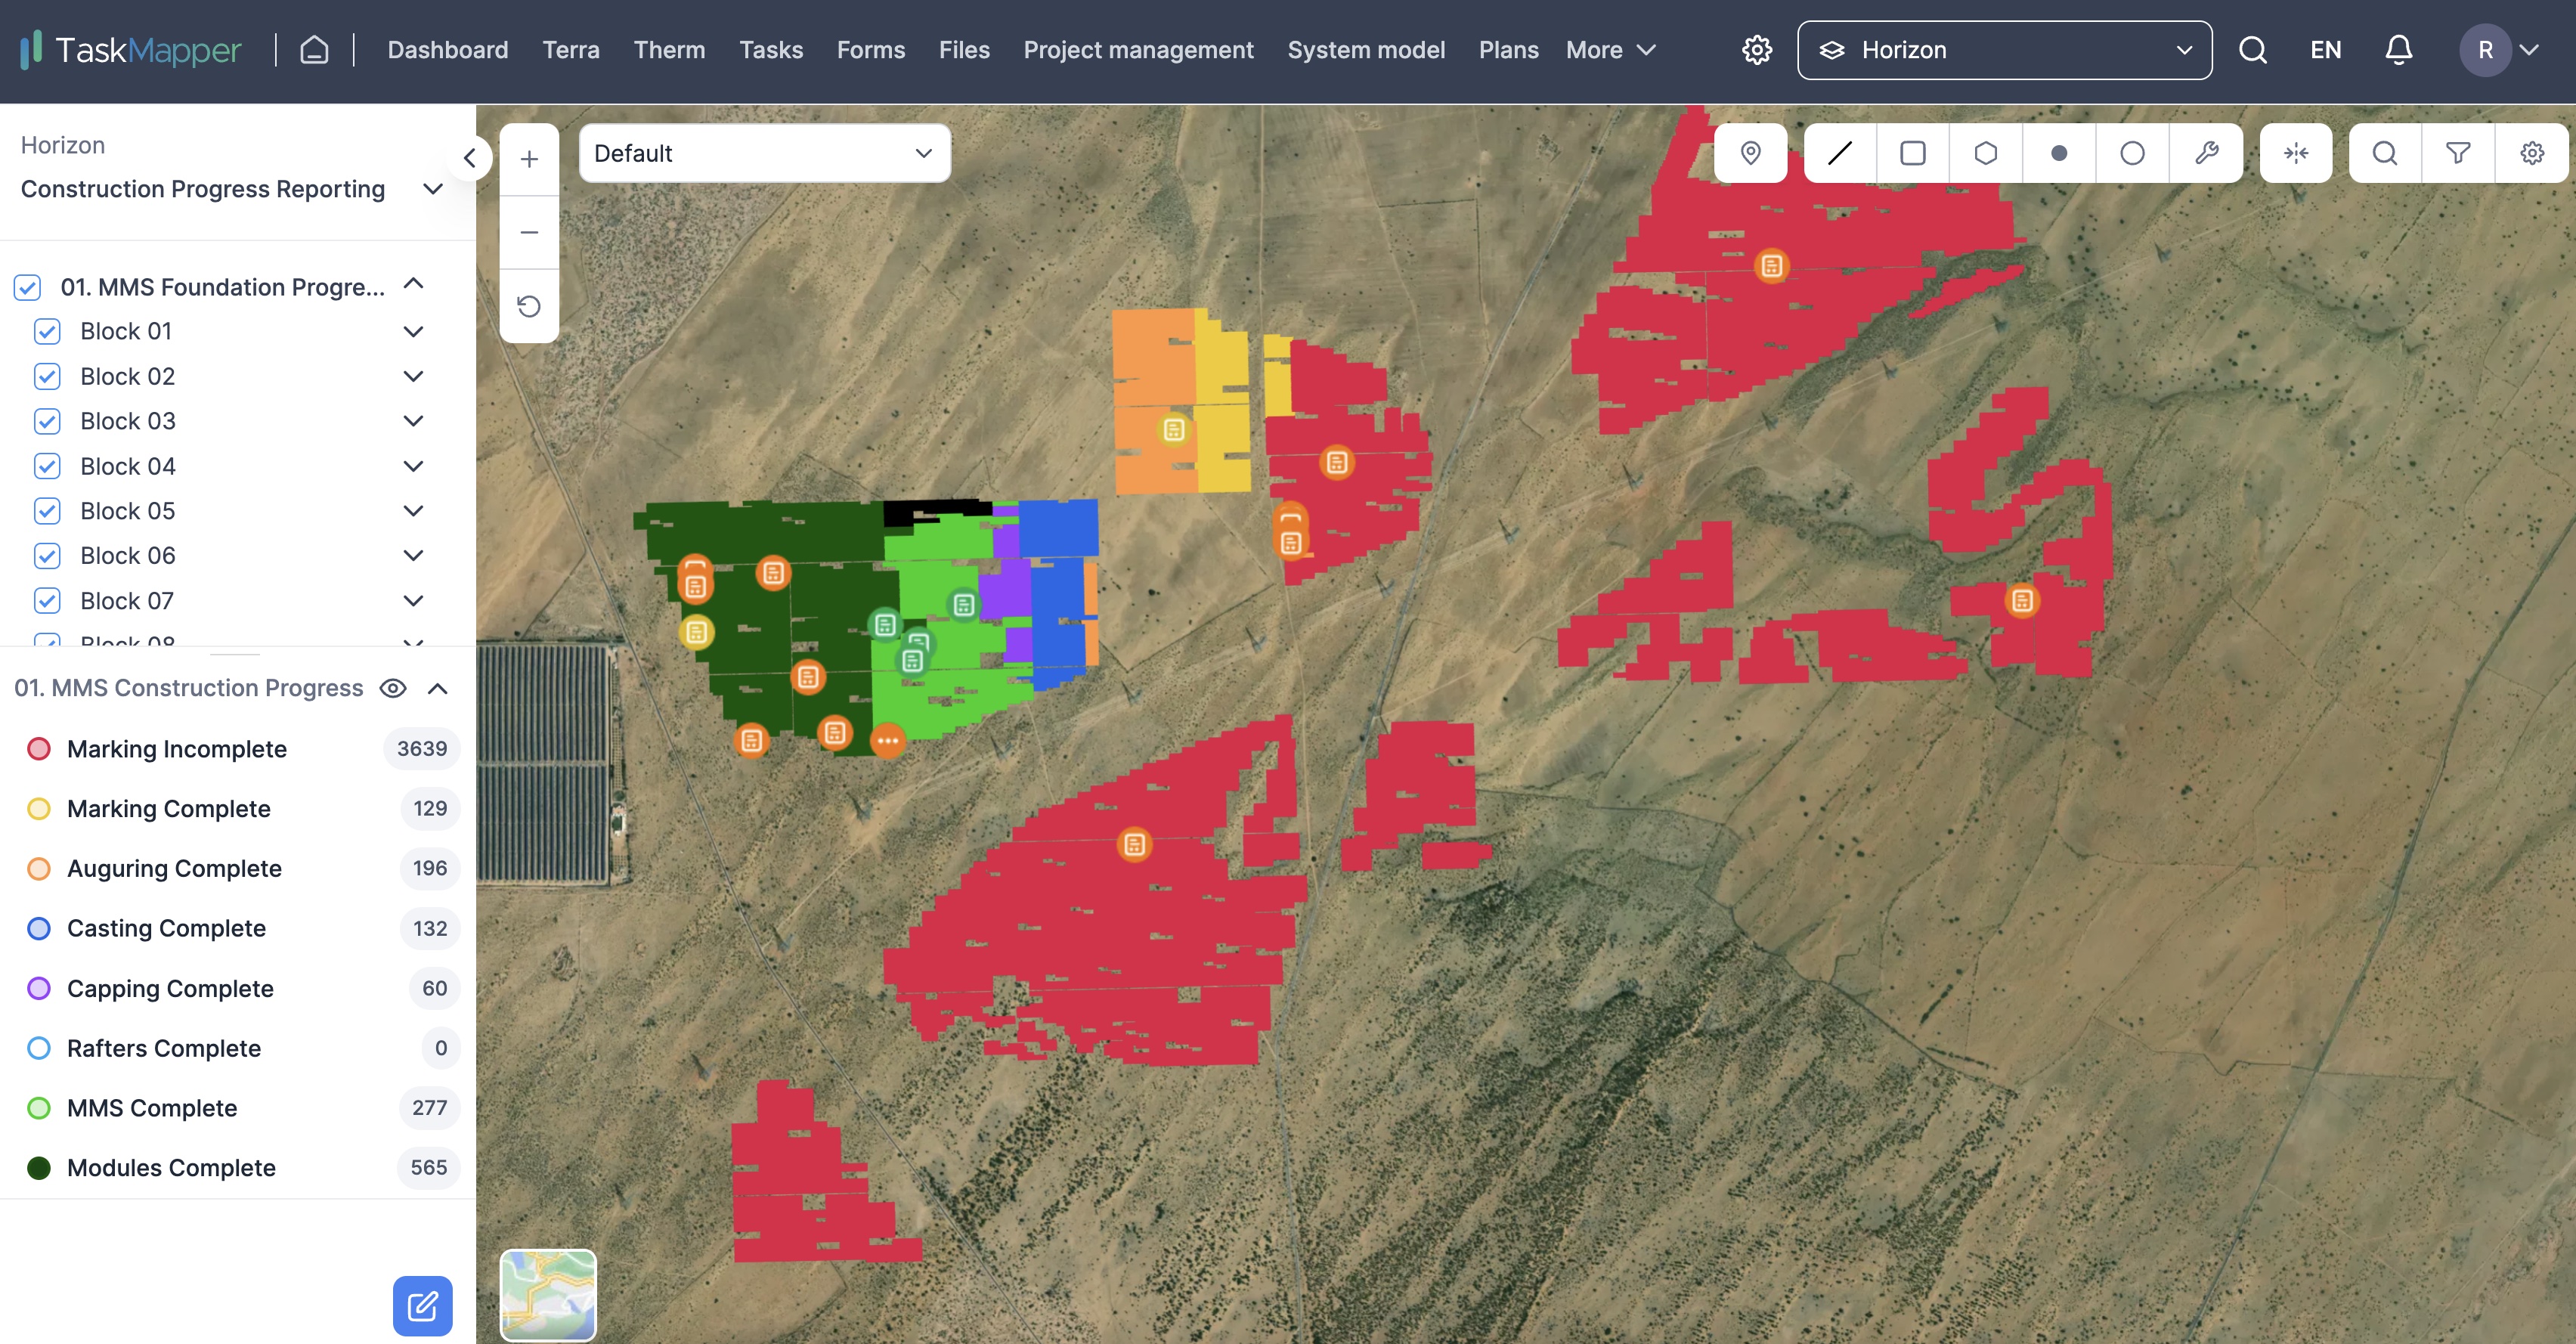
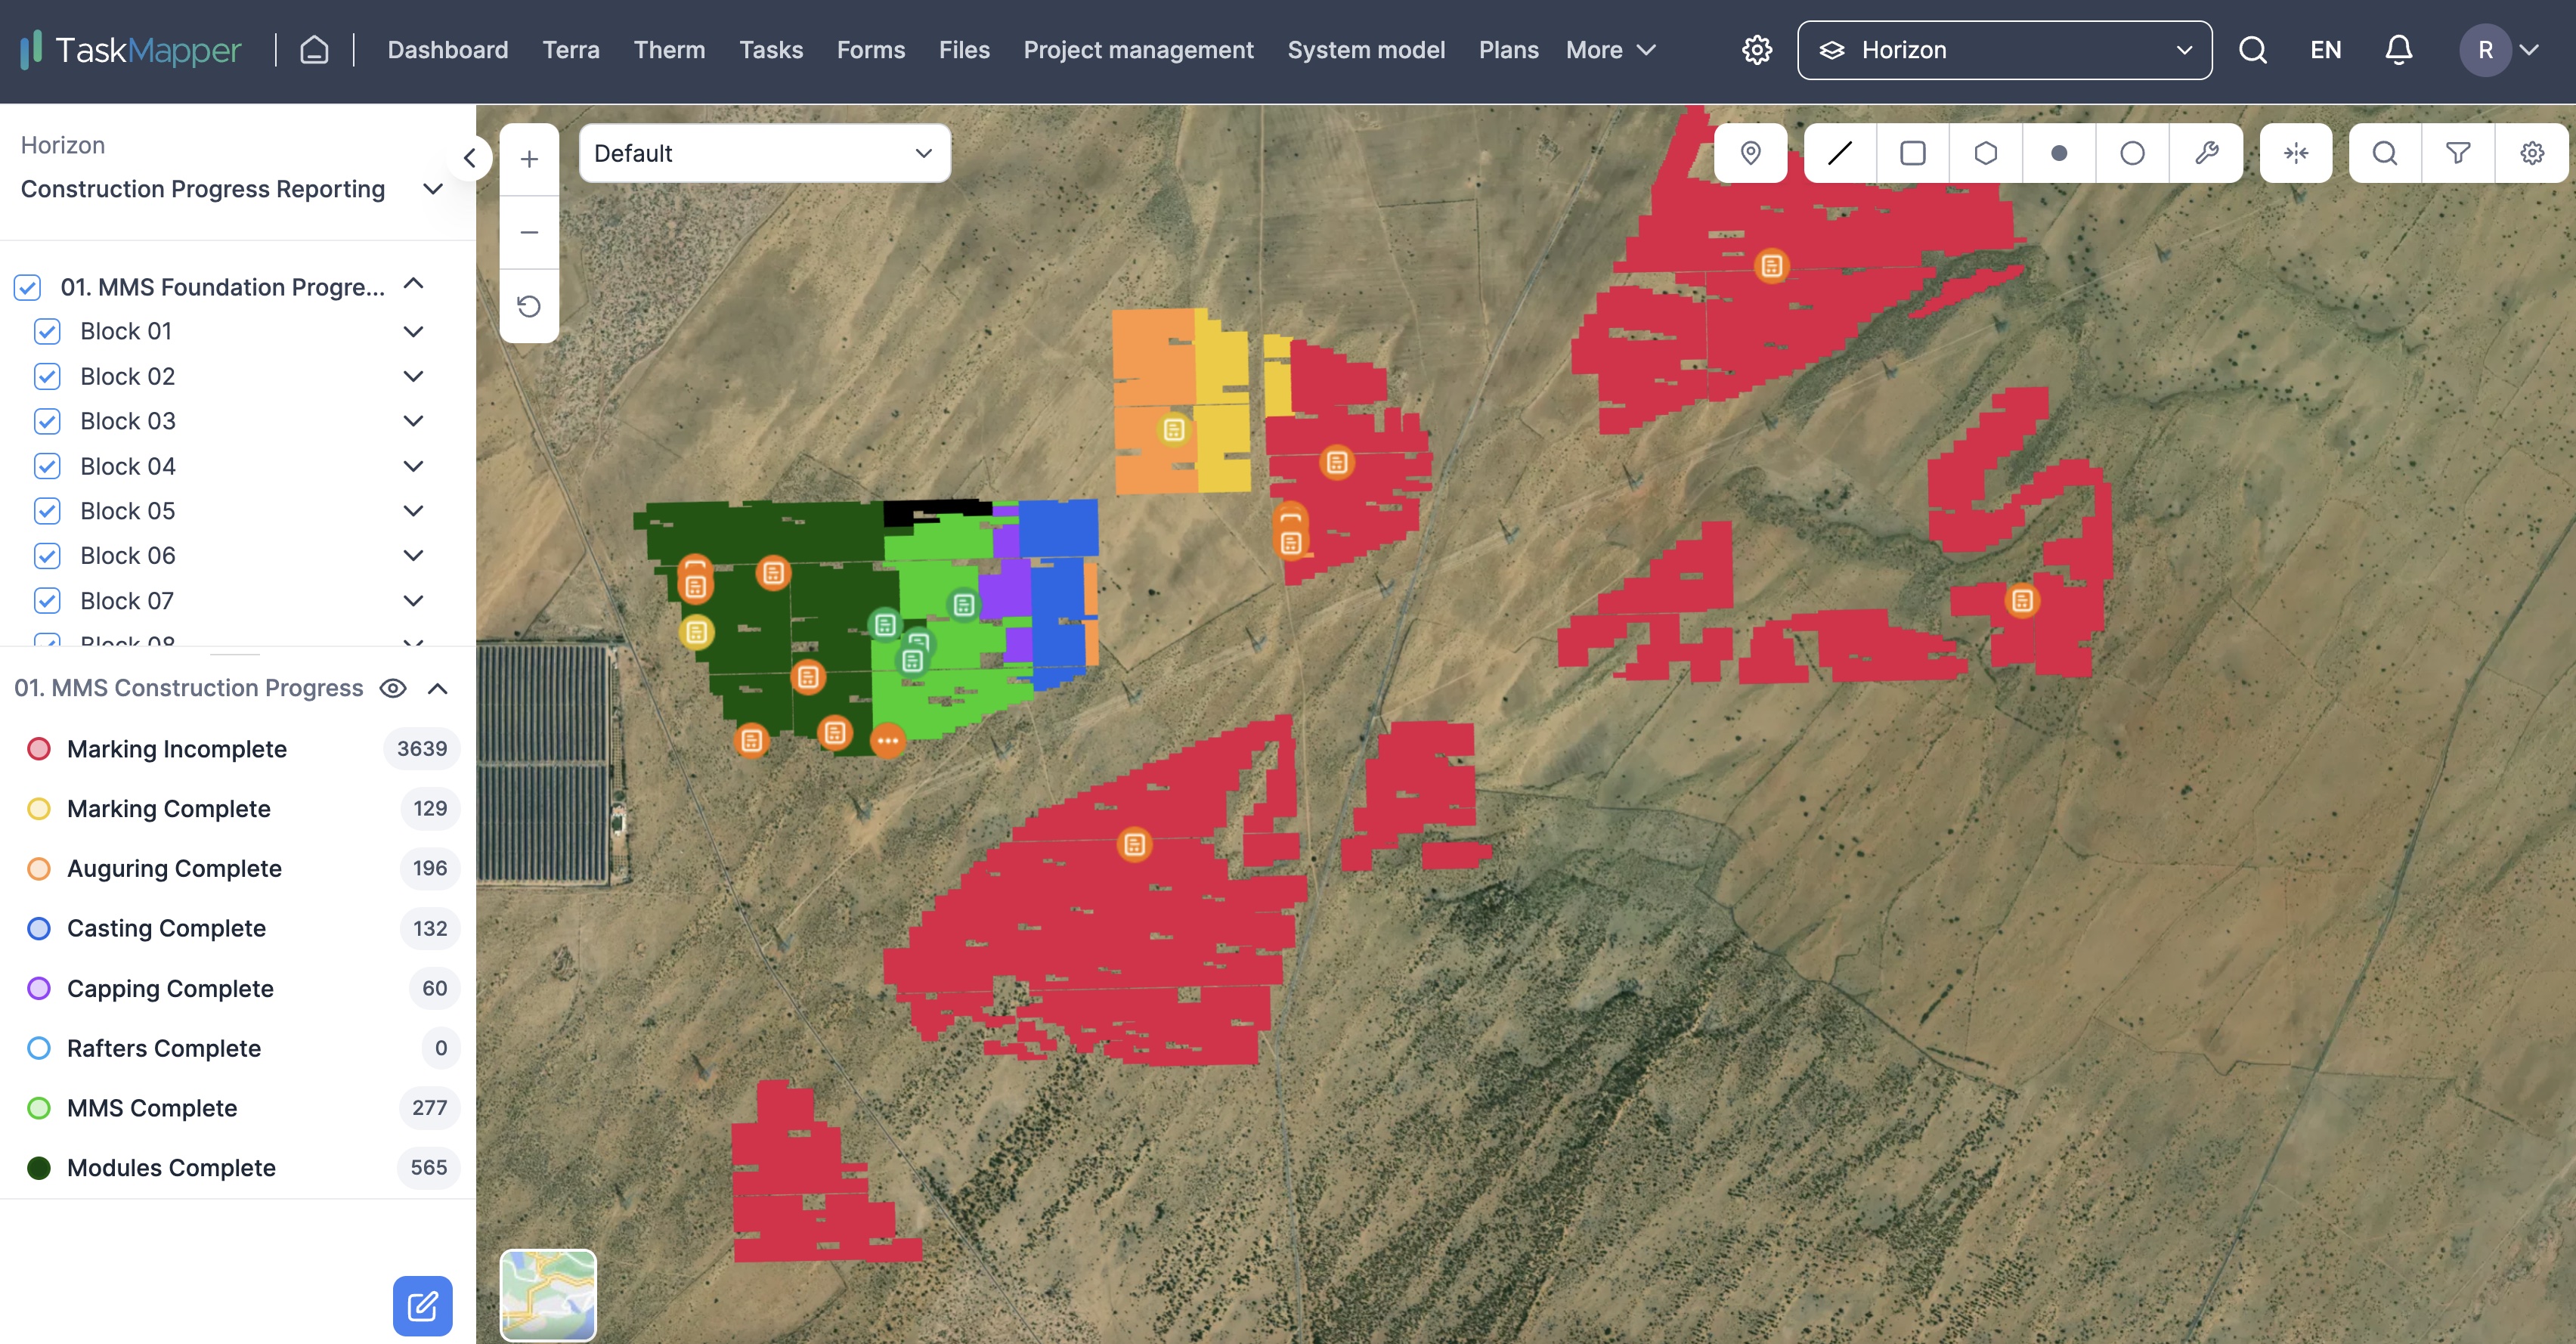
Get a quick visual update of progress with colour coding for each activity stage.
FIGURE 25: Visual map of progress progress
Contact support@taskmapper.com for a demo on Construction Progress Reporting.
Charts & AnalyticsCharts is an analytics tool designed to monitor and manage the progress of construction projects. The intelligence integrated into Charts offers valuable insights about ongoing projects, including overall progress and the pace at which the project is advancing.
Below are some analytics in charts
Progress monitoring
View the overall progress of vectors on the map with a simple colour-coded interface based on the workflow setup. The progress can be monitored by percentage of completion, status or work rate.
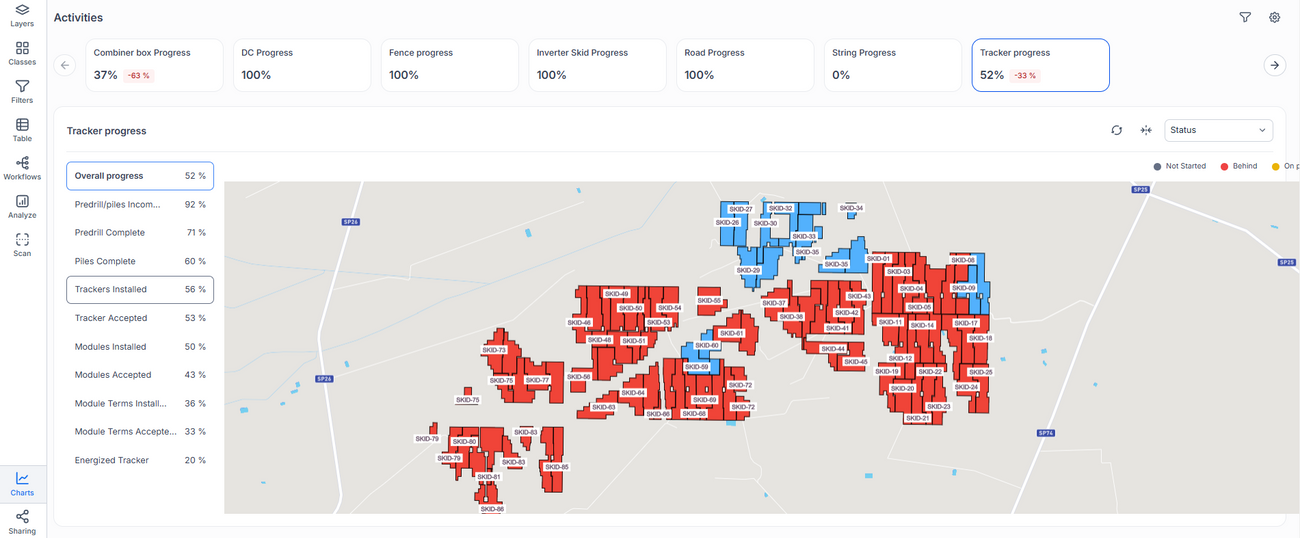
FIGURE 26: Progress monitoring in Chats
Progress analytics
The system analyzes schedules and monitors actual progress to provide analytics. The schedule tracker gathers information from the project schedule. However, if no schedule is available, we have a manual method for updating the schedule tracker (see Figure 28). This allows the system to assess the data and deliver the necessary analytics.
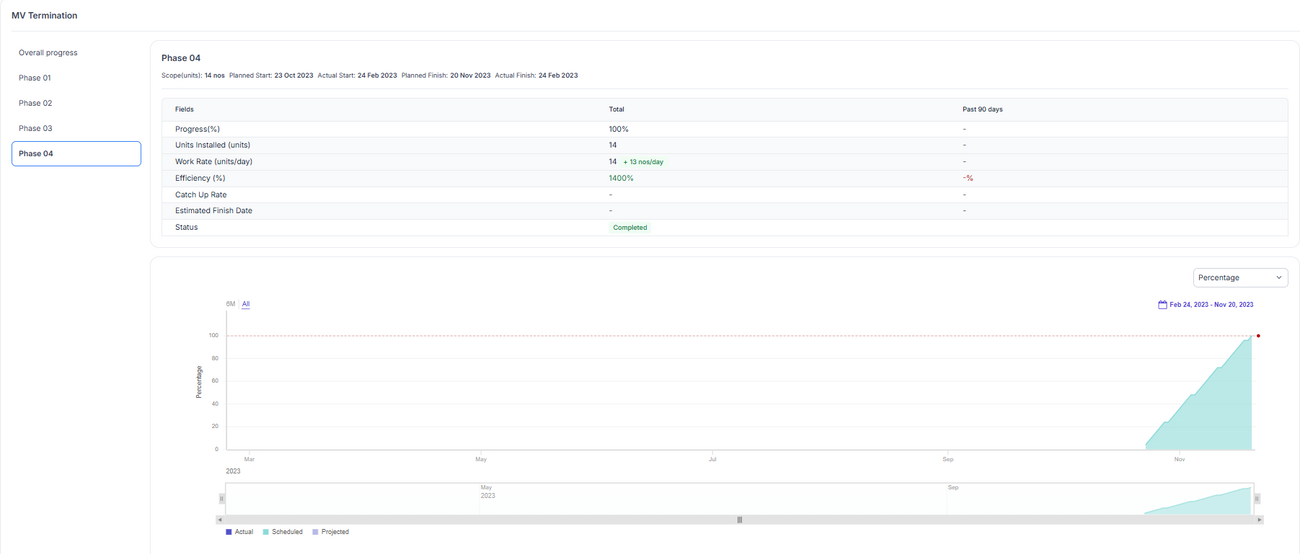
FIGURE 27: Progress analytics
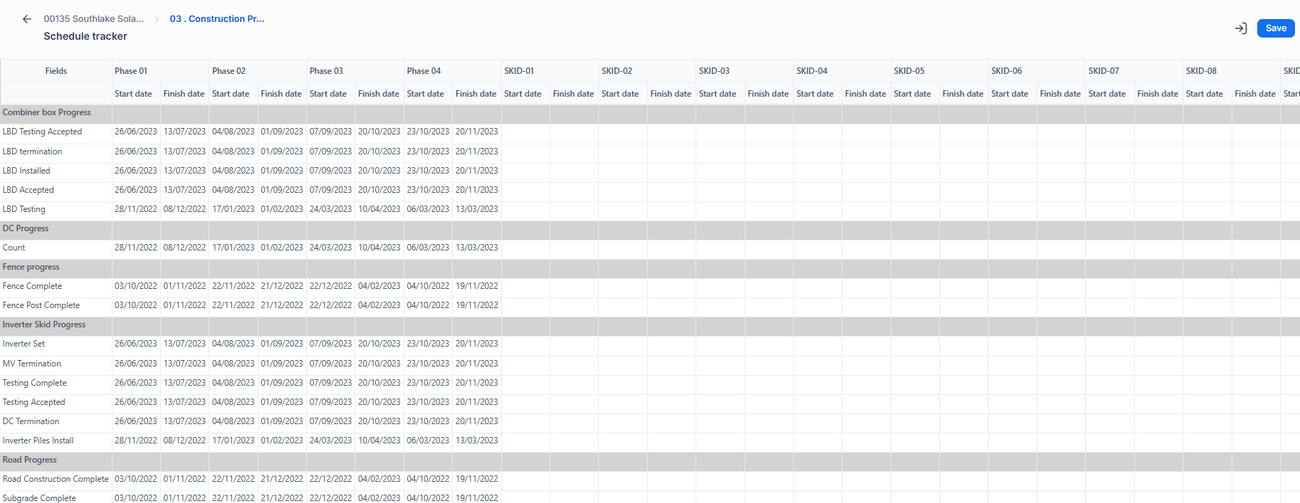
FIGURE 28: Schedule tracker
Maps FAQ
How to perform volume calculations?
Volume calculations give accurate results for an area's volume. The area of cutting and filling is found for each section using the polygon or net area calculation method. The volume is determined by multiplying the average area with the distance between sections.
1. To begin calculating an area's volume, select the polygon tool from the toolbox and draw the area on the map.
FIGURE 1: POLYGON MARKER TOOL
2. Click on the area and select 'Elevation Profile' from the toolbox. In the dialogue box, select the method parameter as 'Base Height' and the layer as 'DSM.'
FIGURE 2: STEPS FOR VOLUME CALCULATION
3. Click on 'Calculate Volume' and view the result.
FIGURE 2(a): STEPS FOR VOLUME CALCULATION
How to perform elevation calculations?
Measuring Elevation Profile
An elevation profile is the description of a two-dimensional, cross-sectional landscape view. It provides a side view of a terrain elevation along a line drawn between locations on the map.
FIGURE 3: LINE STRING TOOL
2. Click on the line drawn and select 'Elevation Profile' from the toolbox.
FIGURE 4: ELEVATION PROFILE
3. In the elevation profile dialogue box, set the parameters. Choose the method as 'Line' and the interval as '1m' or lower. Set the layer as 'DSM' and click on 'Calculate Elevation'.
FIGURE 5: STEPS TO MEASURE ELEVATION PROFILE
Measuring Spot Elevation
Spot elevation, or a point on a map or chart, indicates points higher than their surroundings. Spot elevation displays the actual elevation of a selected point and the top and/or bottom elevation of elements with a thickness.
1. To check spot elevation, select the marker tool from the toolbox and place it on the desired point on the map. Then select 'Elevation Profile' from the toolbox.
FIGURE 6: SPOT ELEVATION MARKER
2. In the Elevation Profile dialogue box, select the method parameter as 'Point' and layer as 'DSM'.
FIGURE 7: ELEVATION PROFILE
3. Click 'Calculate Elevation' to get the spot elevation results.
FIGURE 8: STEPS TO MEASURE SPOT ELEVATION
How to add tasks or forms to the map?
You can add a task or form to an individual component on the map or select multiple components and add them in bulk. Below are the steps to add a task on the map or associate it with a component on the map
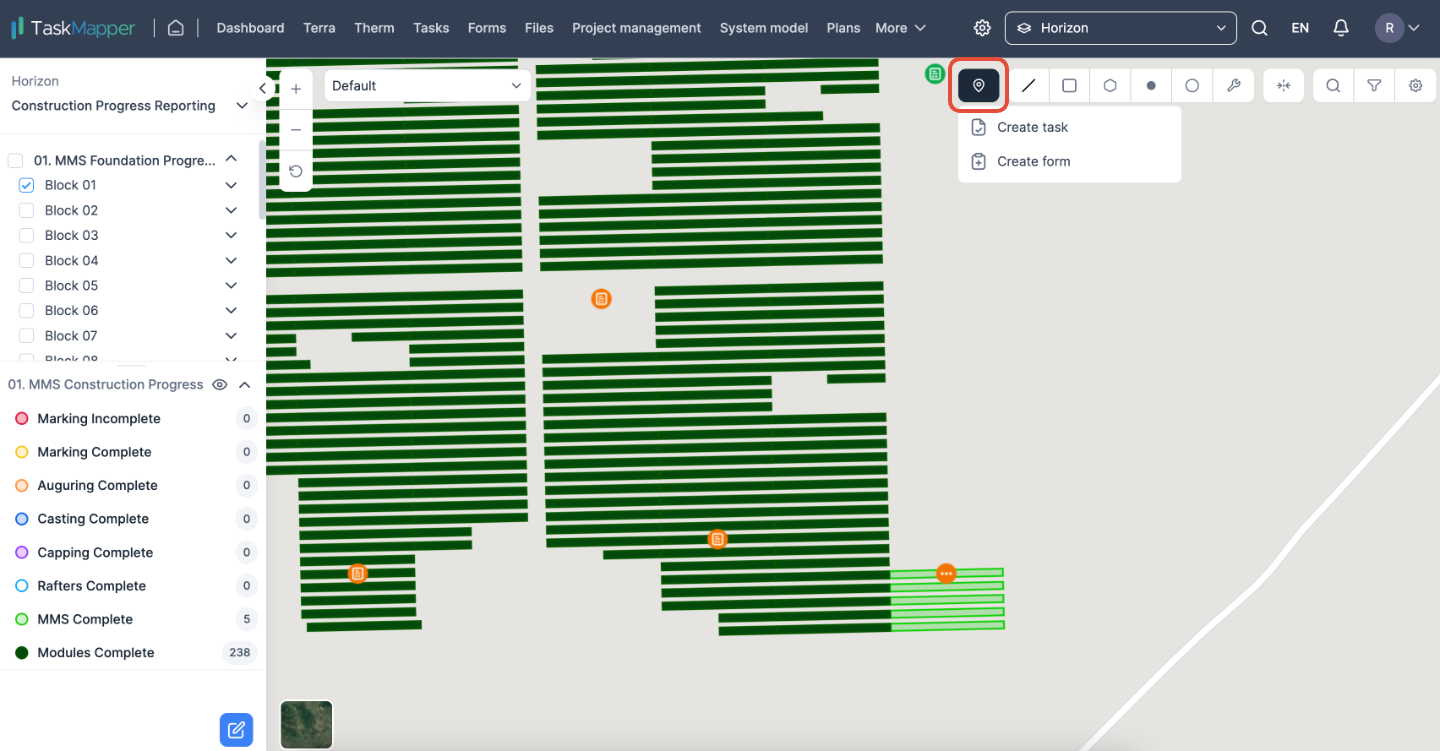
1) Click on the GPS icon on select the options to create a task or a form
FIGURE 9: CREATE TASK/FROM
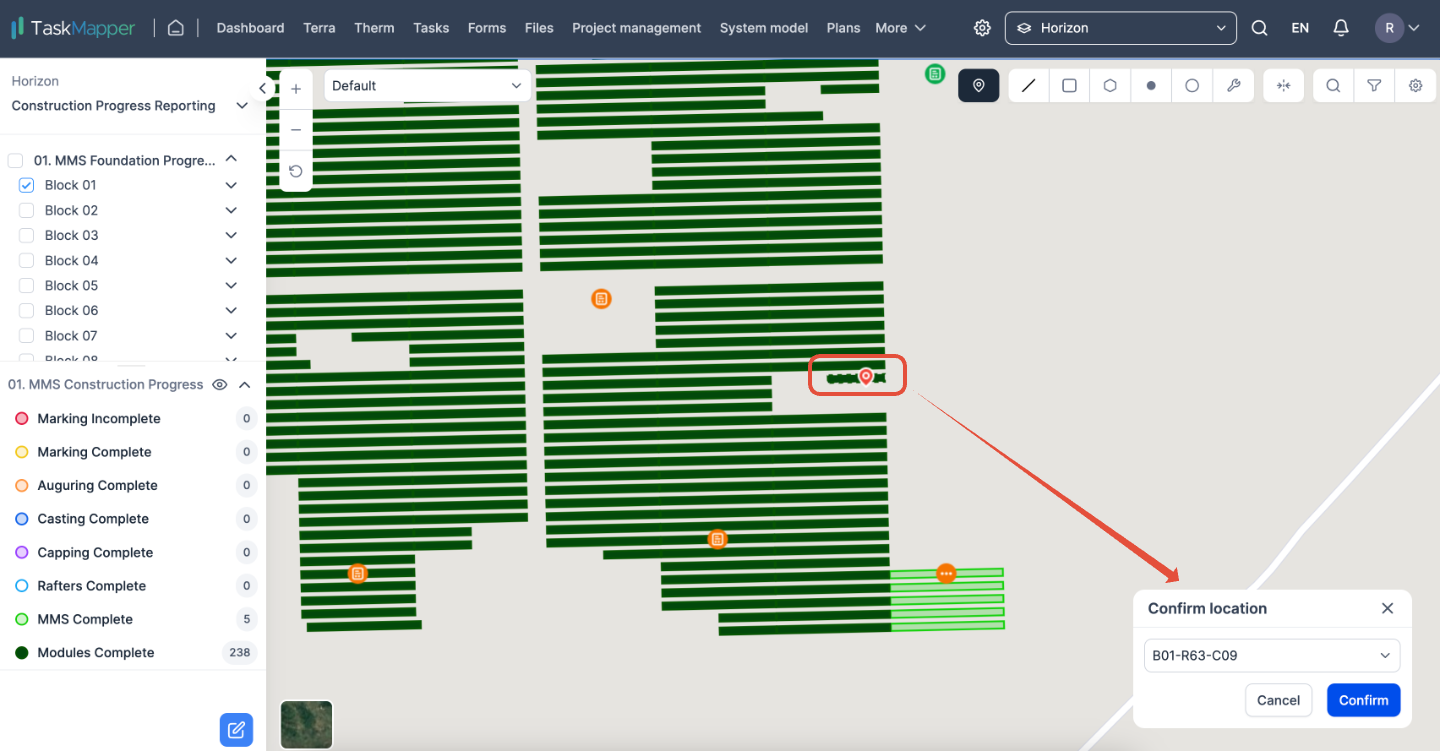
2) Click anywhere on the map or click on the component on the map to confirm the task's location. Click on confirm to add the task.
FIGURE 10: LOCATION CONFIRMATION FOR TASK/FORM
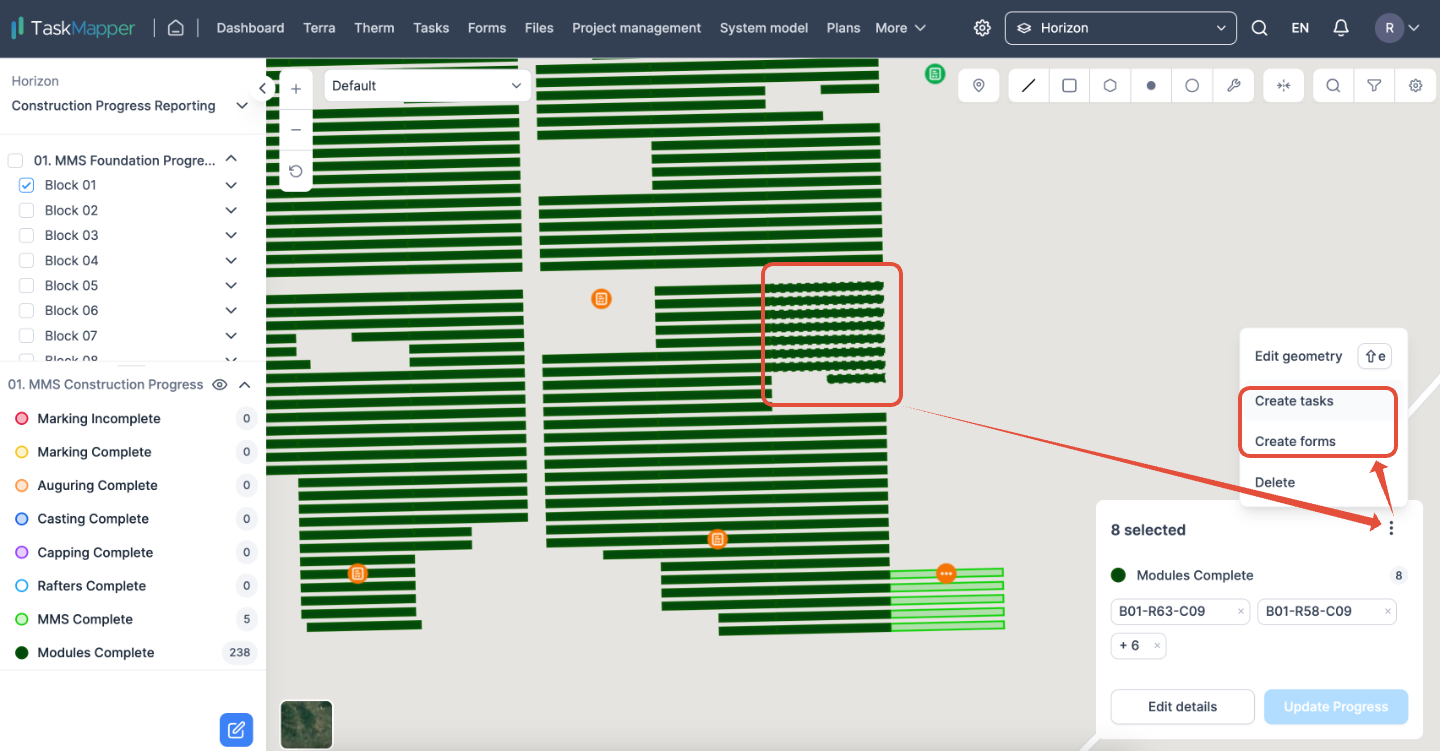
3) If you want to add a task to multiple components on the map or associate a task with several components simultaneously, hold down the shift key on your keyboard and select the desired components using your mouse or trackpad.
FIGURE 11: BULK ADDITION OF TASK/FORM
How to enable or disable zooming into the new map when switching between maps (toggle fly)?
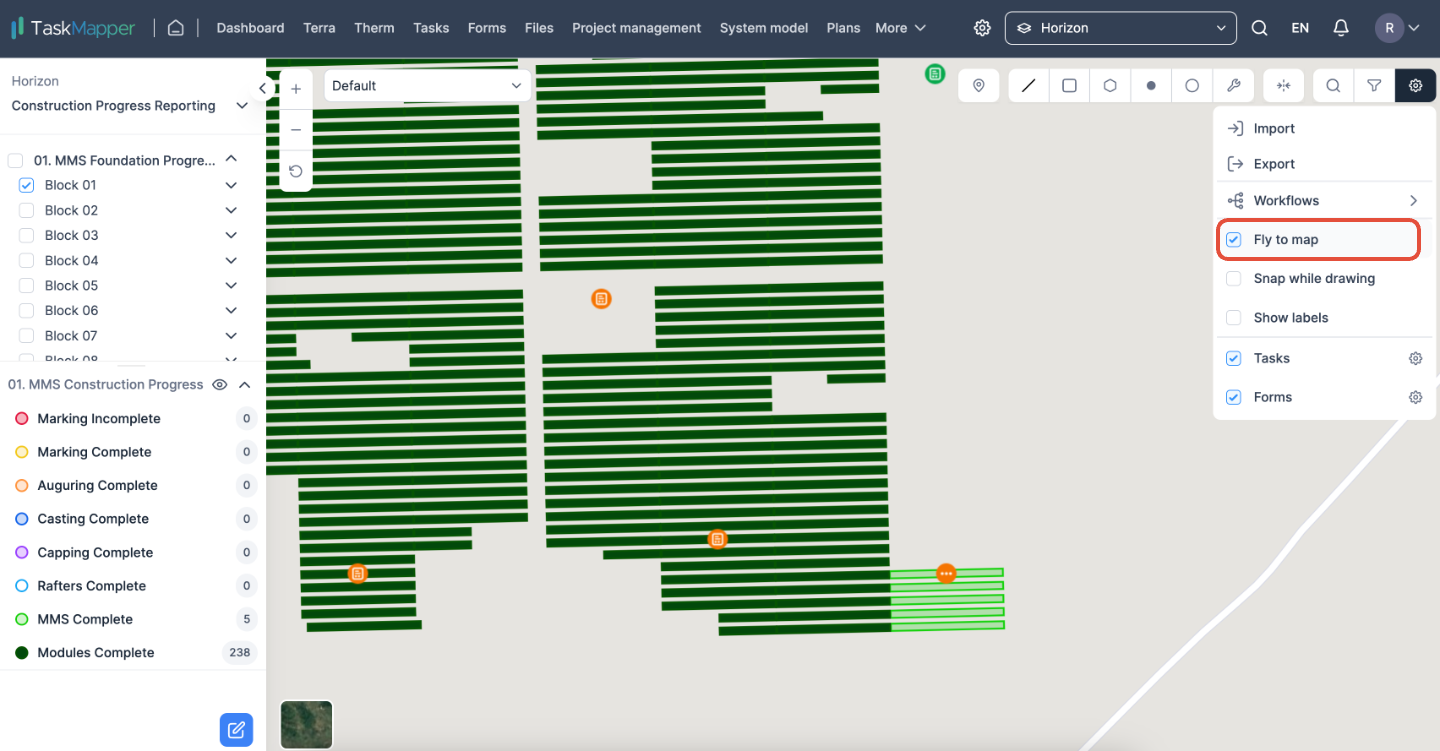
In the map view, click on the gear icon and click on the option ' Fly to map' to enable or disable the zooming when switching between maps.
FIGURE 12: FLY TO MAP
How to enable or disable labels?
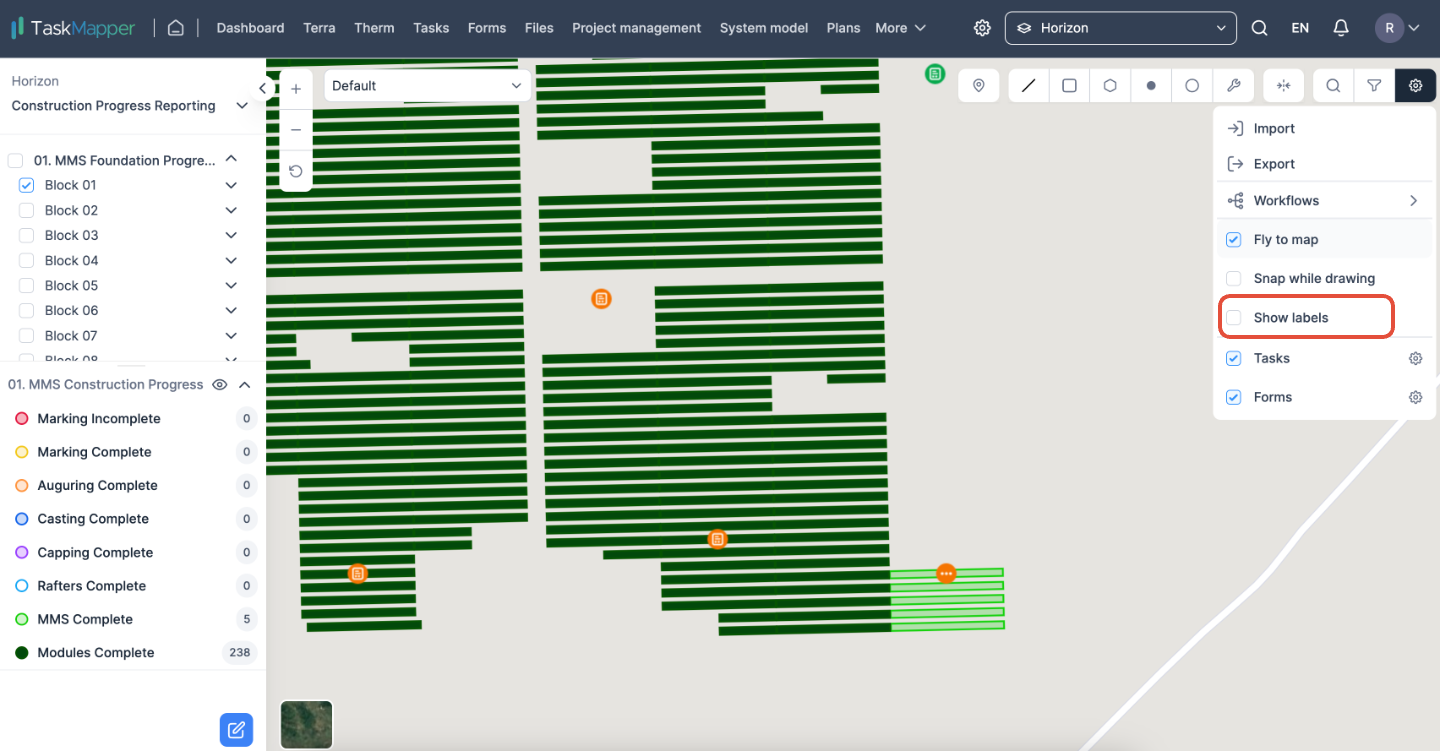
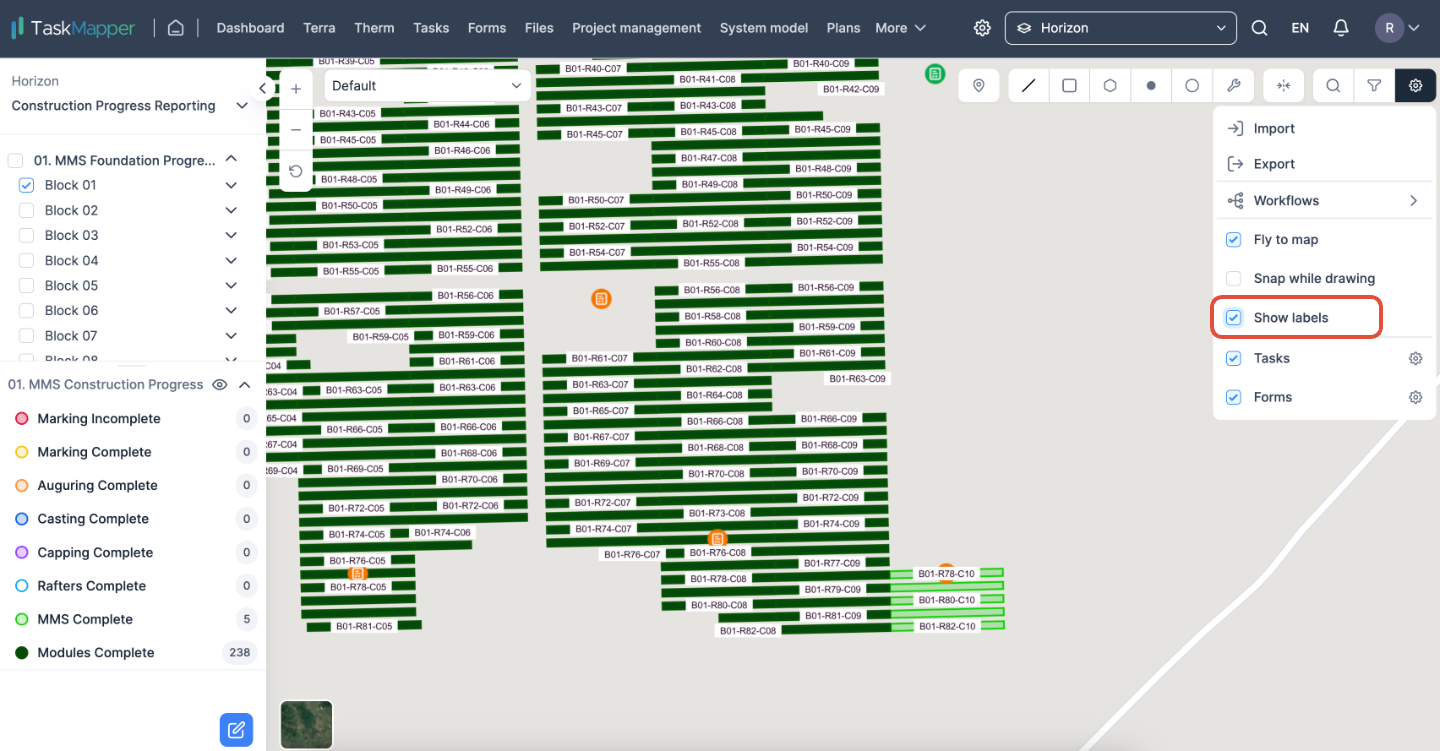
To view the component labels on the map, click on the option 'Show labels' in the map view.
FIGURE 13(a): SHOW LABELS
When enabled
FIGURE 13(b): SHOW LABELS
How to toggle visibility of tasks/ forms on the map?
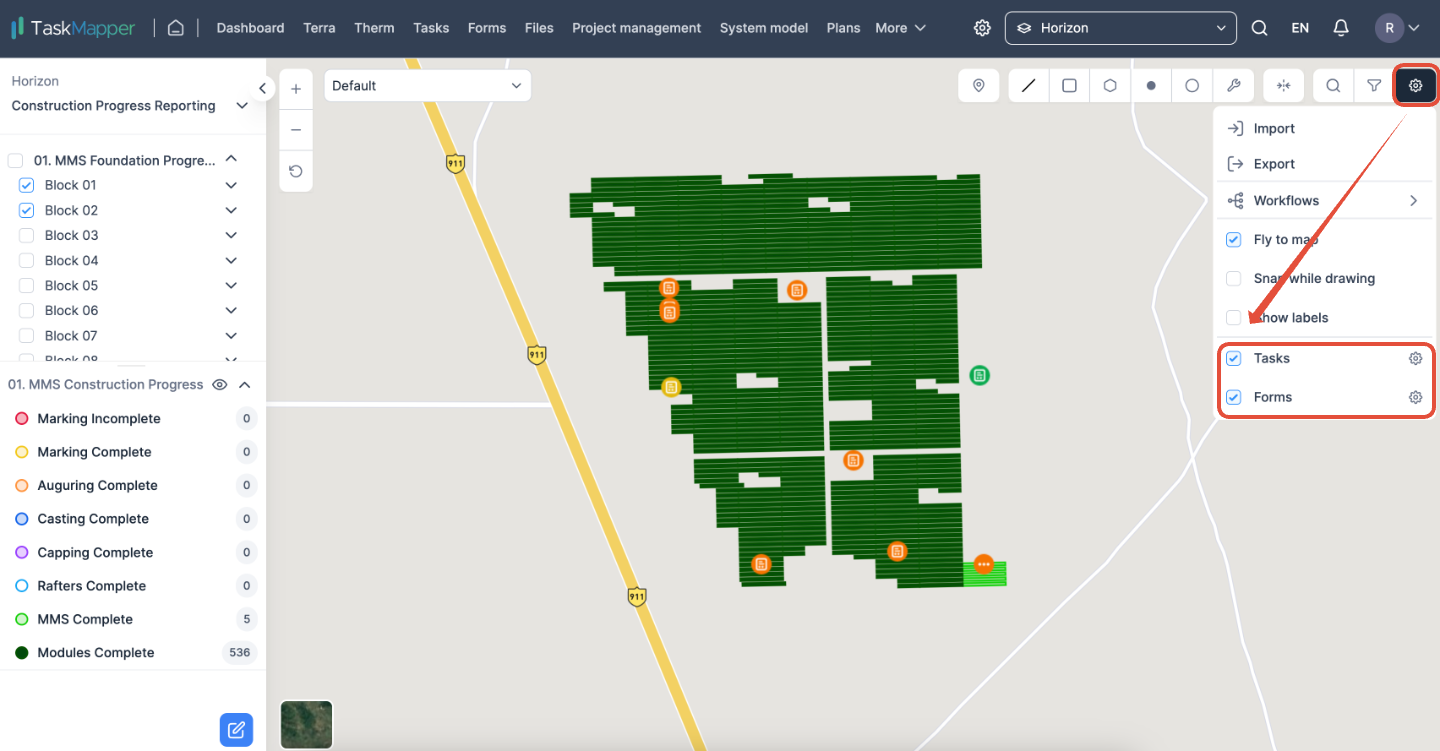
To toggle the visibility of tasks/forms on the map, check or uncheck for tasks/forms.
FIGURE 14: TOGGLE VISIBILITY OF TASKS/FORMS
How to filter tasks/ forms that are visible on the map?
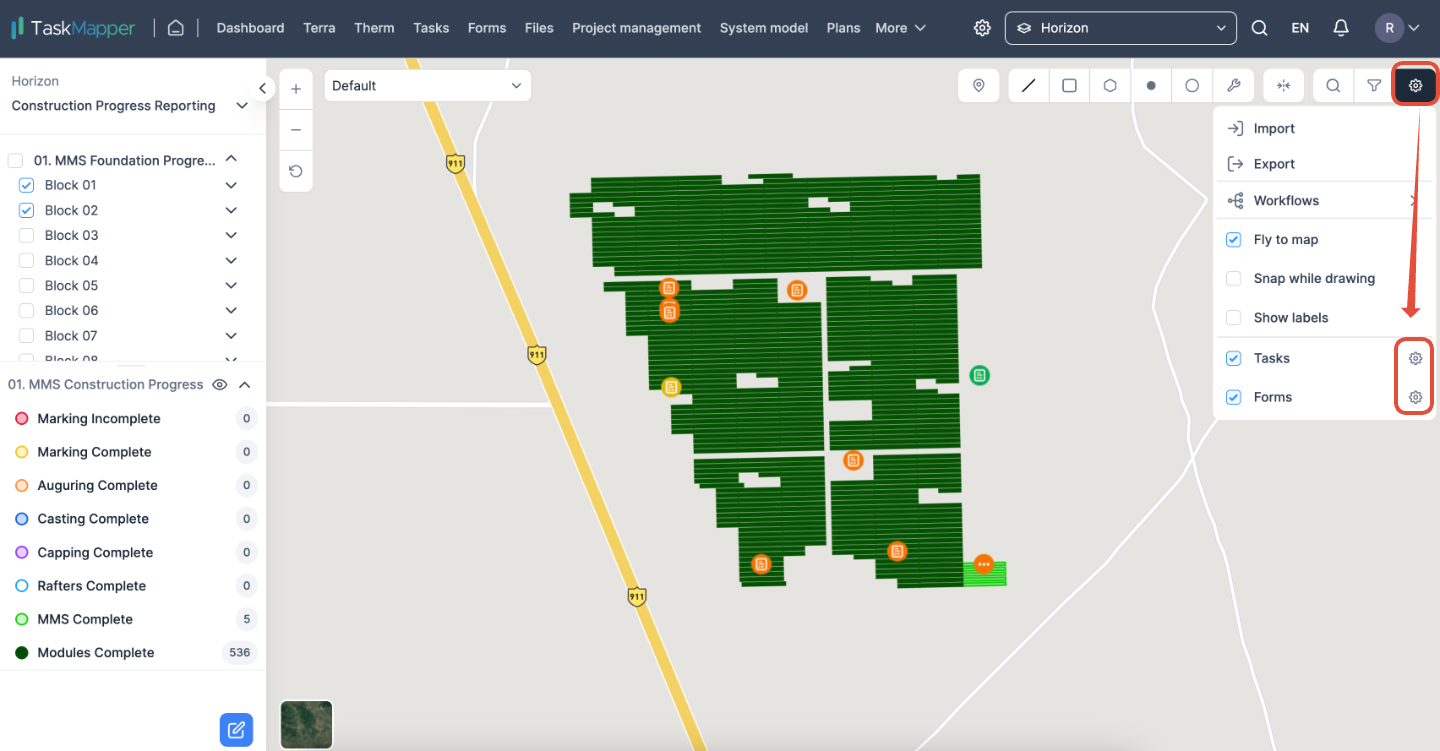
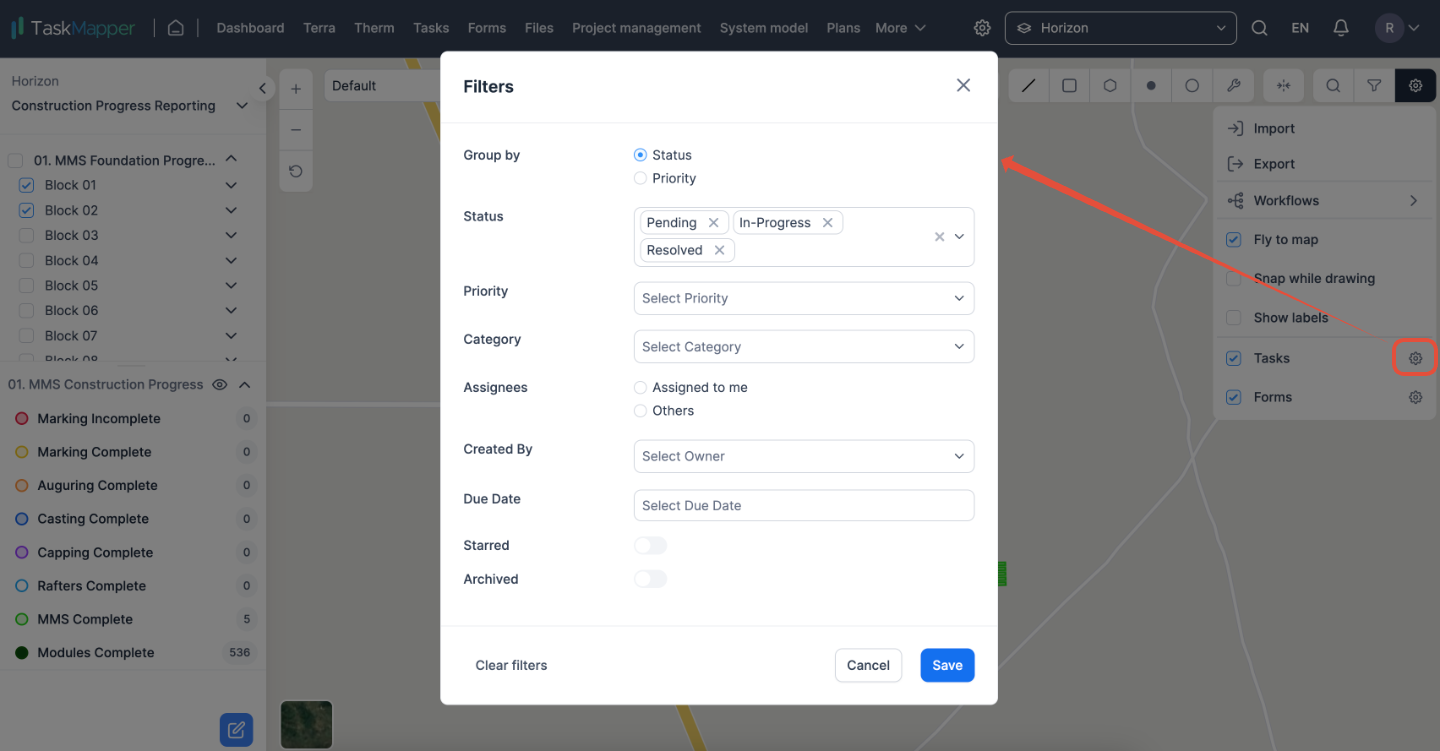
To filter tasks/forms on the map view, click on the gear icon next to tasks and forms.
FIGURE 15(a): FILTERS
Set the required filter and click on save to view the filtered tasks on the map view.
FIGURE 15(b): FILTERS
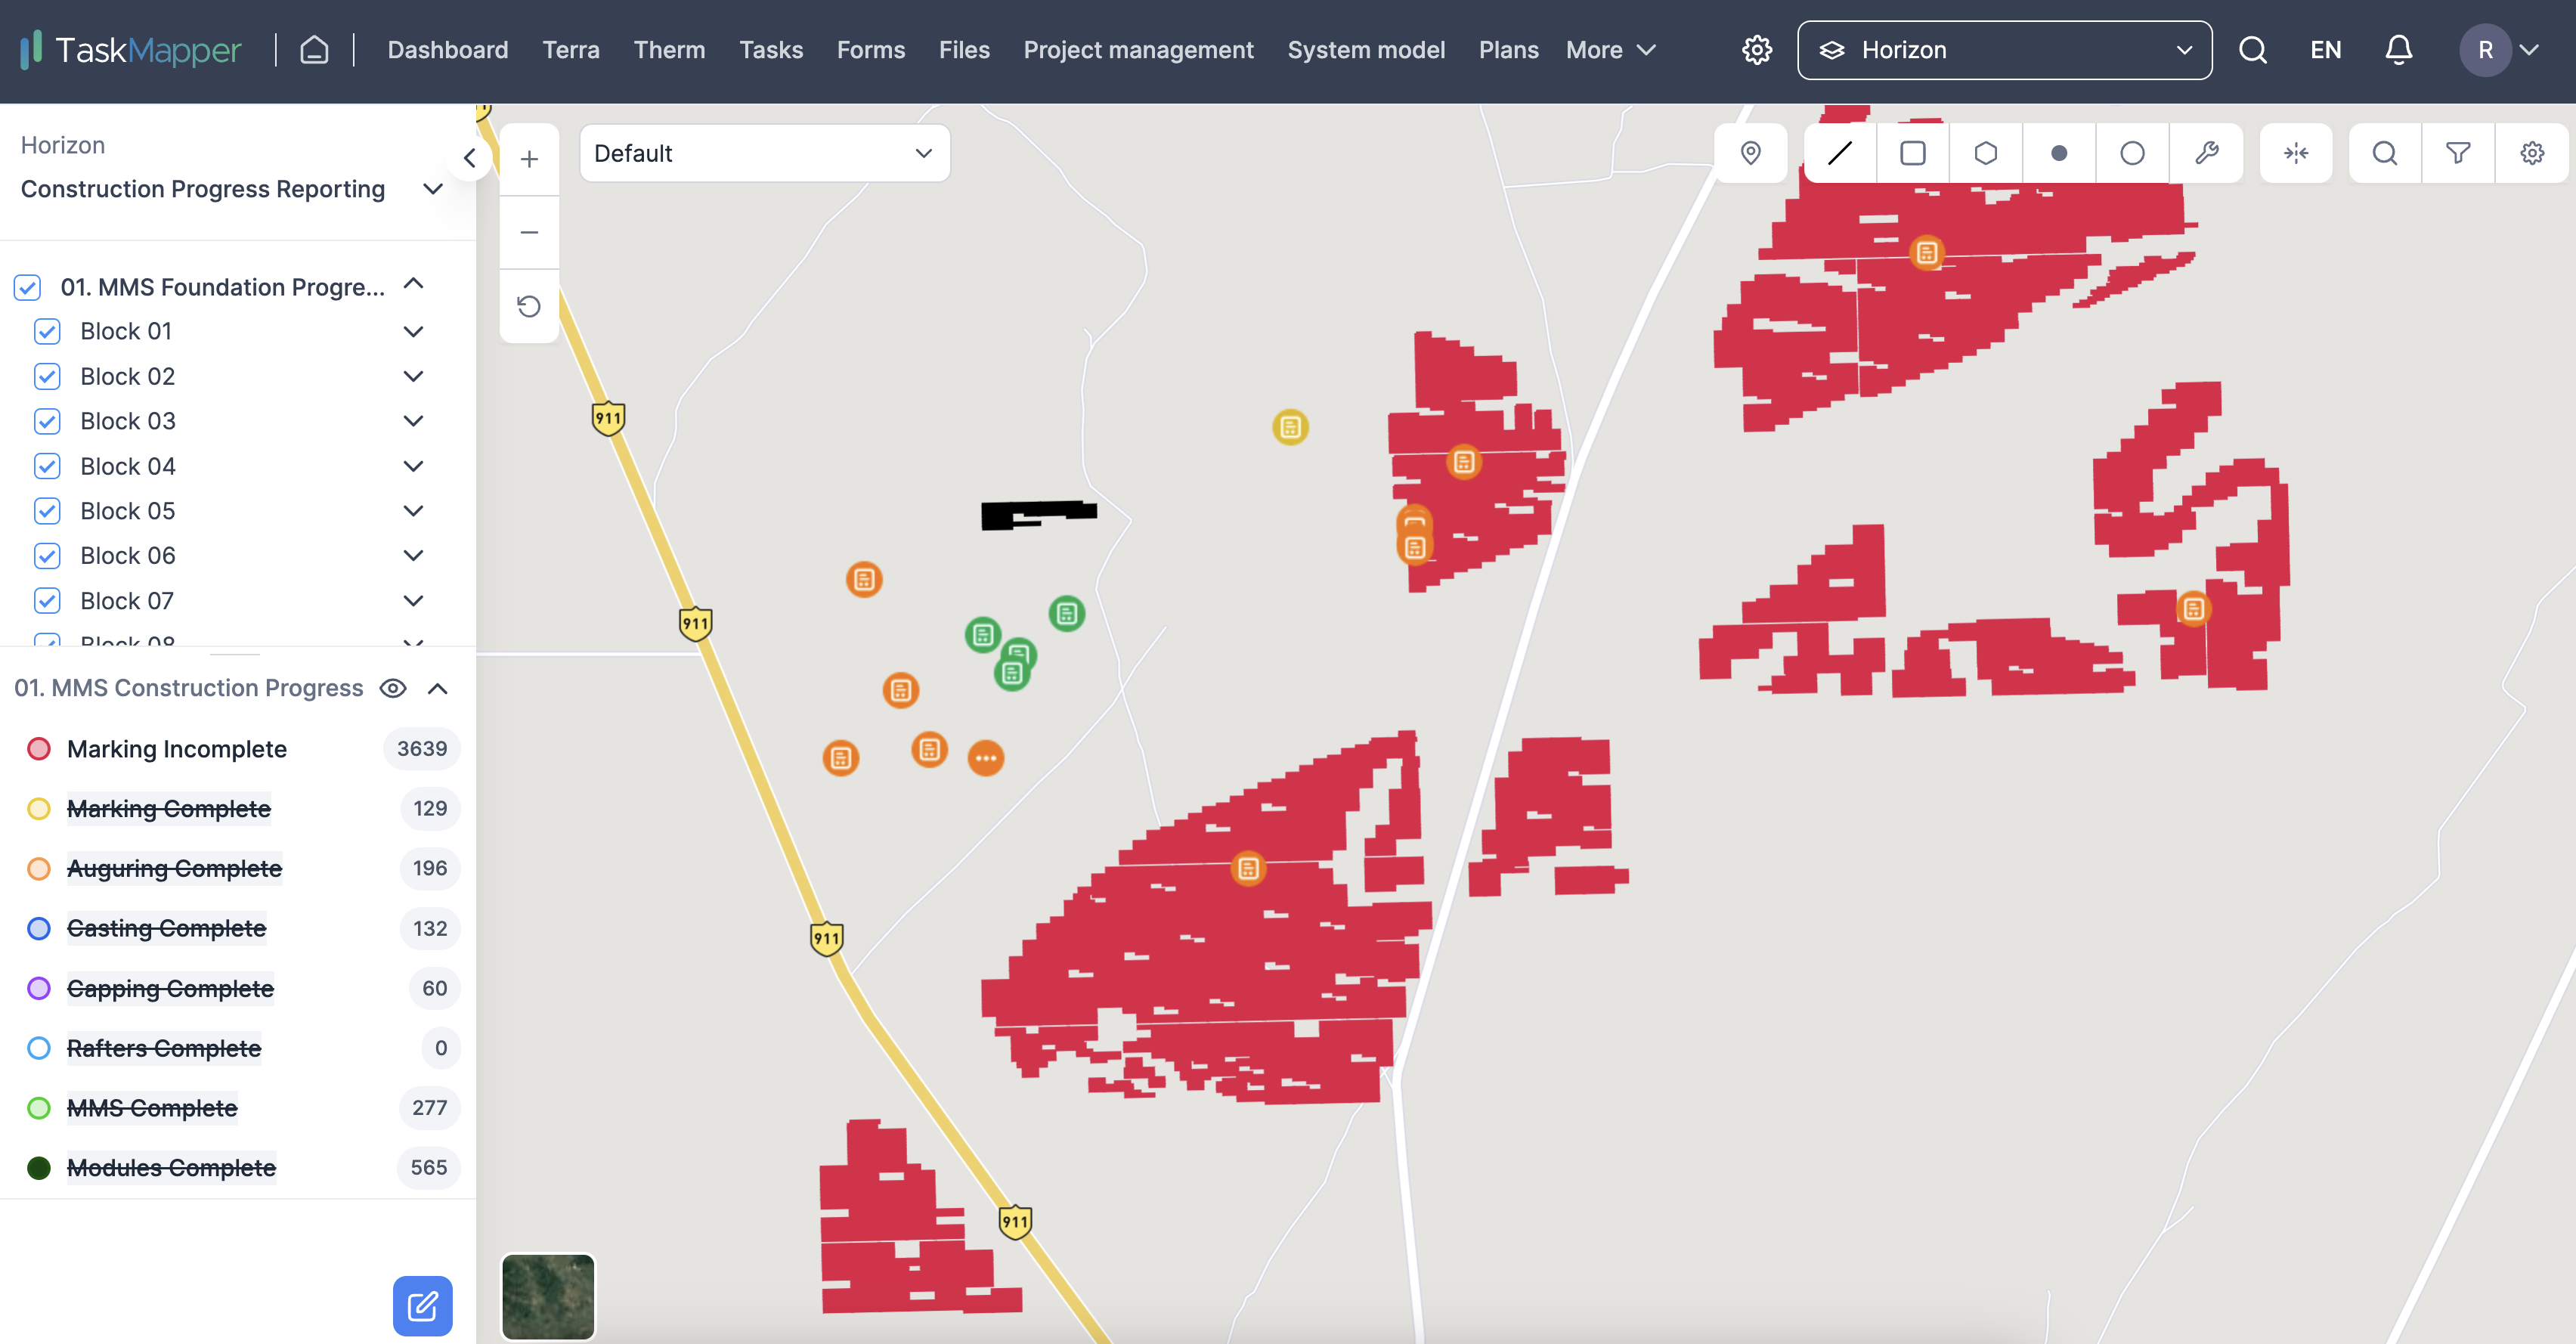
How to filter vectors that are visible on the map by colour?
If you want to filter vectors on the map, click on the legend on the screen's left side. By clicking on the number displayed in the legend, you can view only the selected vector on the map.
FIGURE 16(a): VECTOR FILTERS
FIGURE 16(b): VECTOR FILTERS
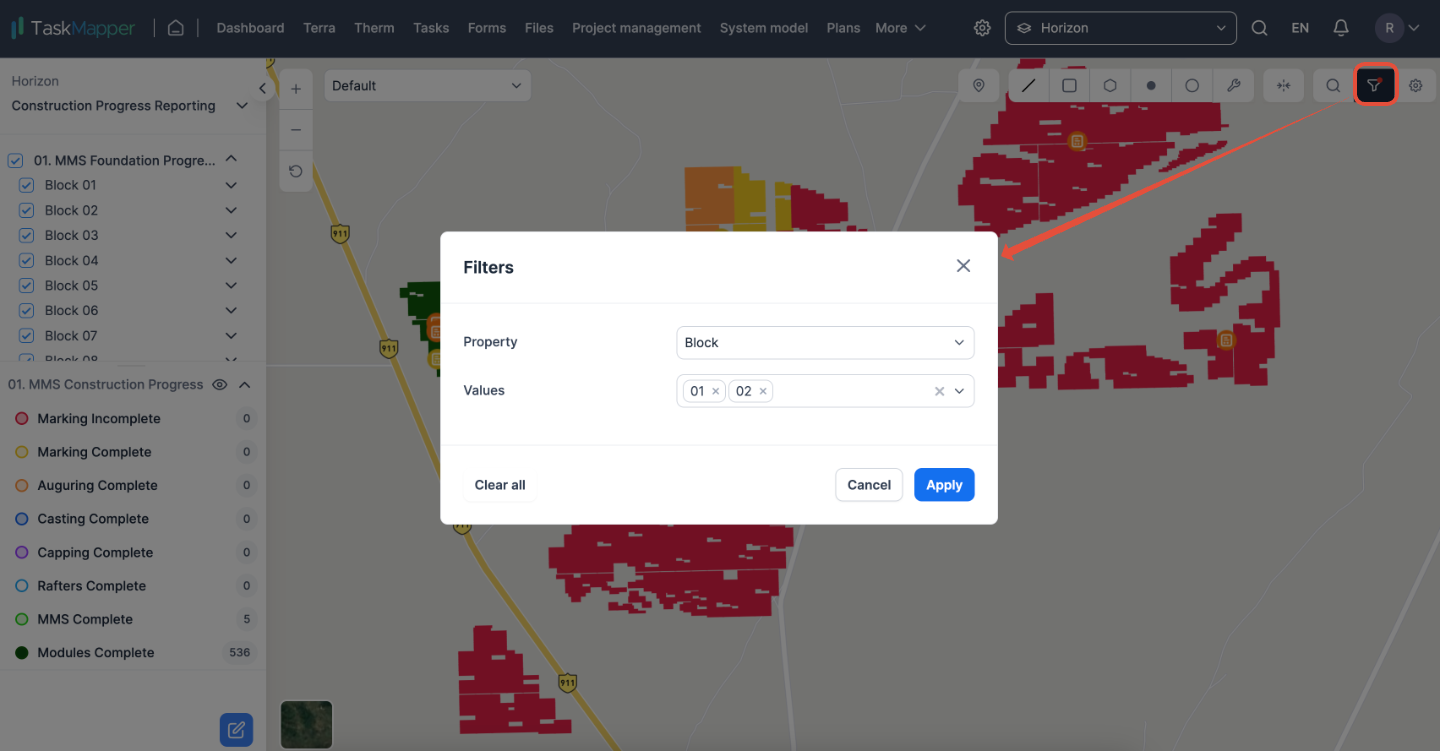
How to filter vectors that are visible on the map by attribute?
To filter by attribute/property, simply click on the filter icon, choose the attribute/property and its value, and then click on the apply button.
FIGURE 17: ATTRIBUTE/PROPERTY FILTERS
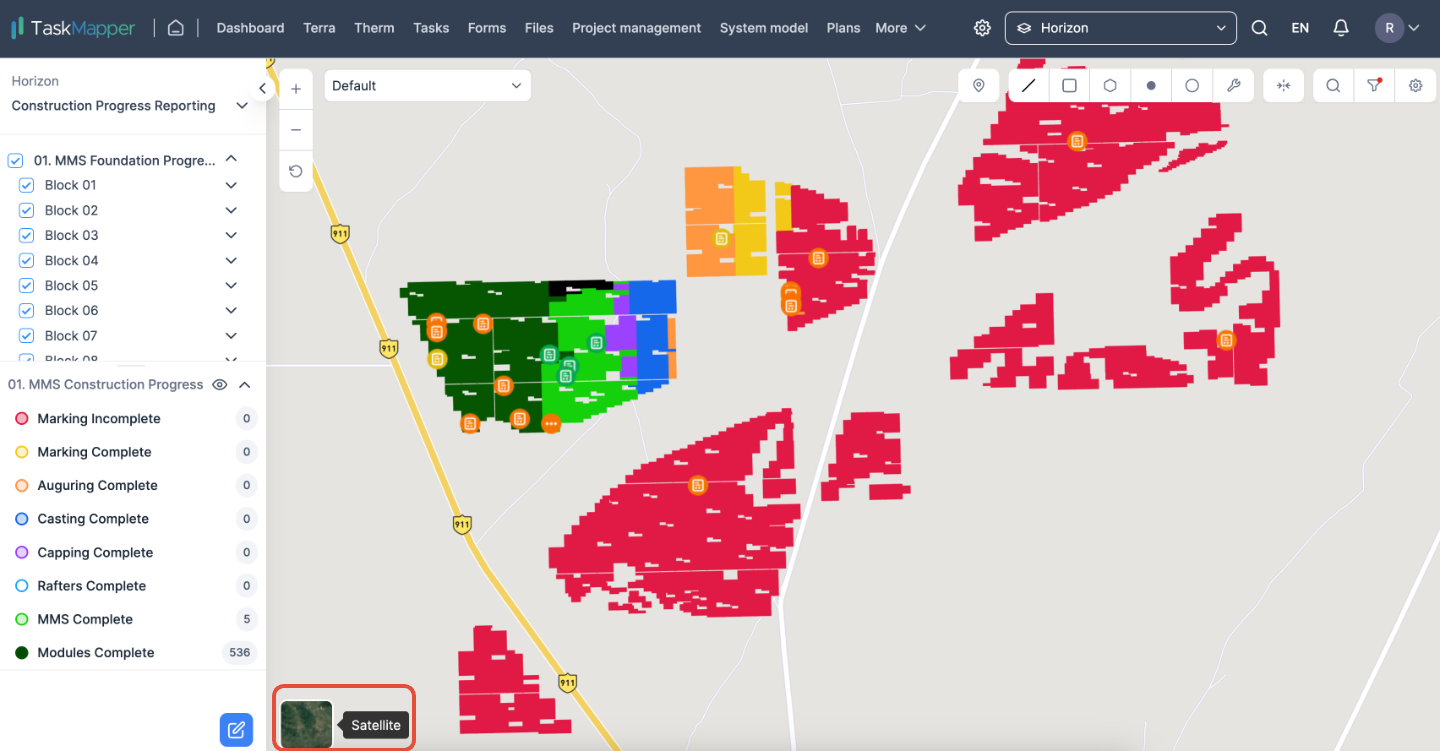
How to toggle map view between Street or Satellite?
To toggle map view between streen or satellite, click on the icon at the bottom left on the map view
FIGURE 18: VIEWS - STREET VIEW
FIGURE 18: VIEWS - SATELLITE VIEW
How to compare maps?
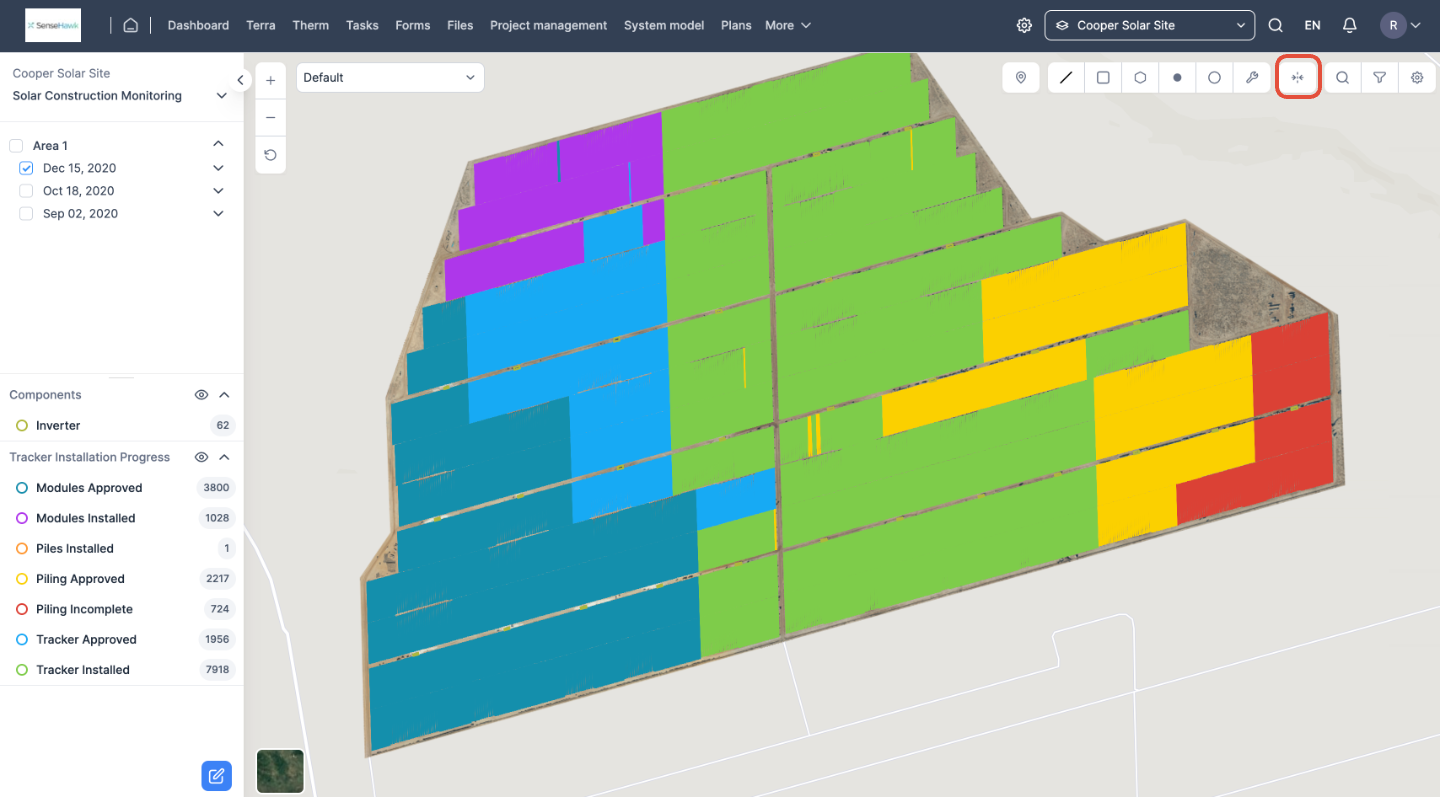
If there are multiple scan dates, the Compare feature will help you understand the progress. Comparing two scan dates will allow you to easily visualise the work progress based on the map's colour-coded feature types.
FIGURE 19: COMPARE
FIGURE 19(a): SCAN DATES SELECTION FOR COMPARISION
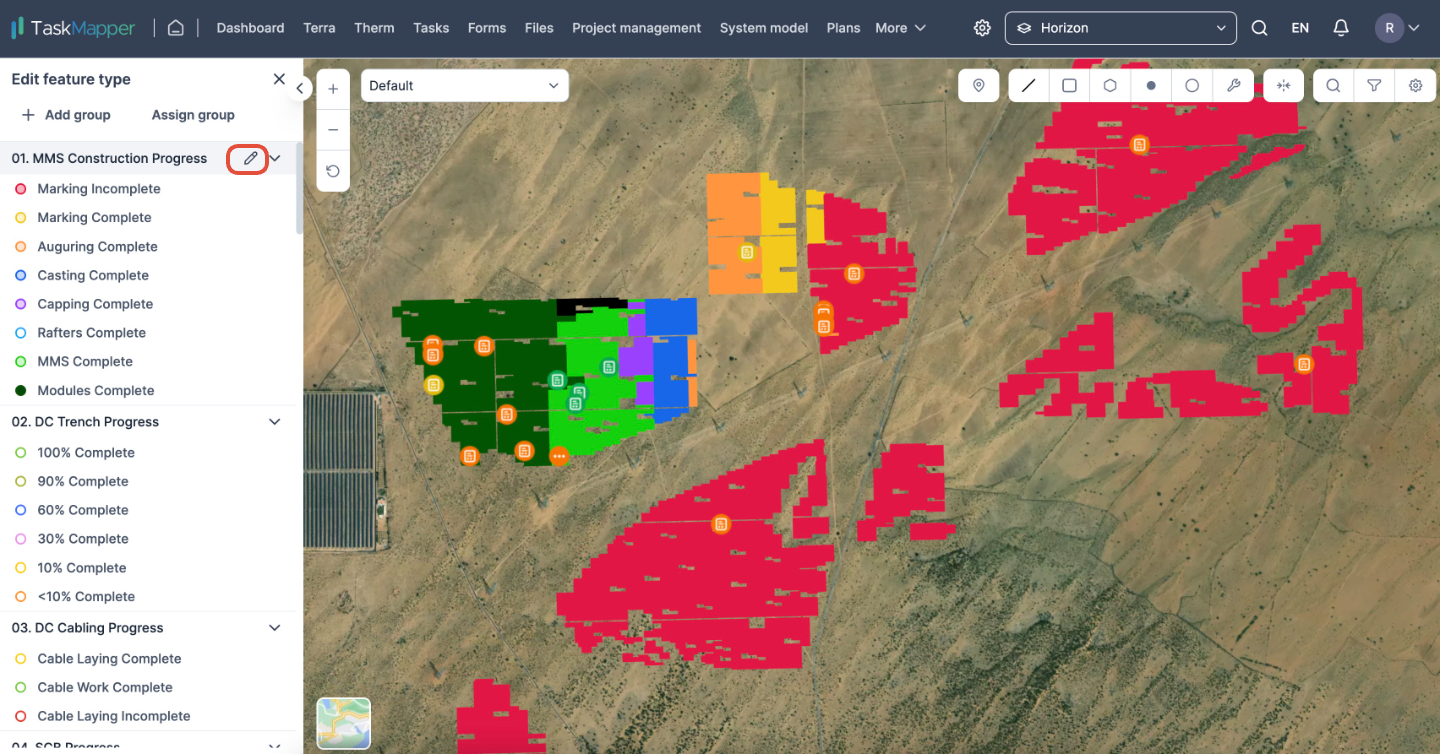
How to edit a feature type?
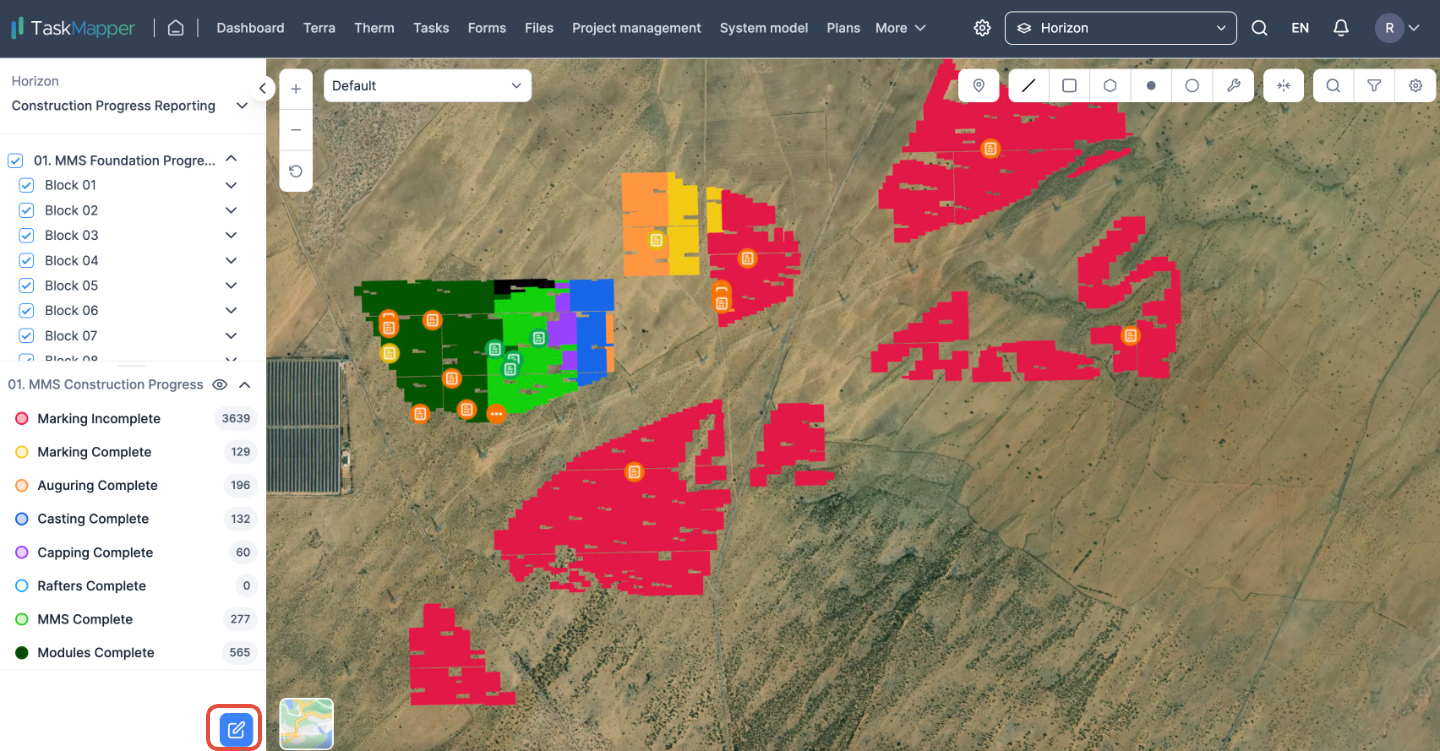
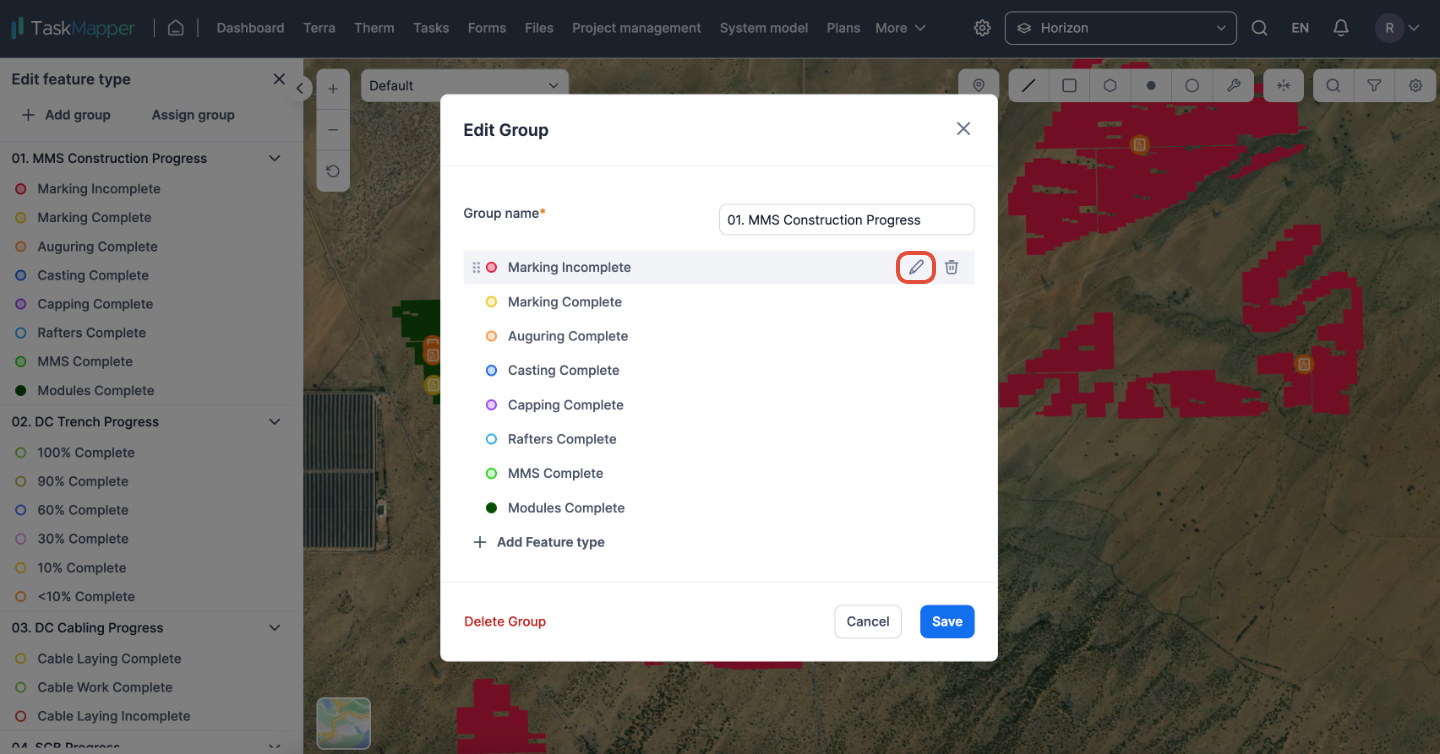
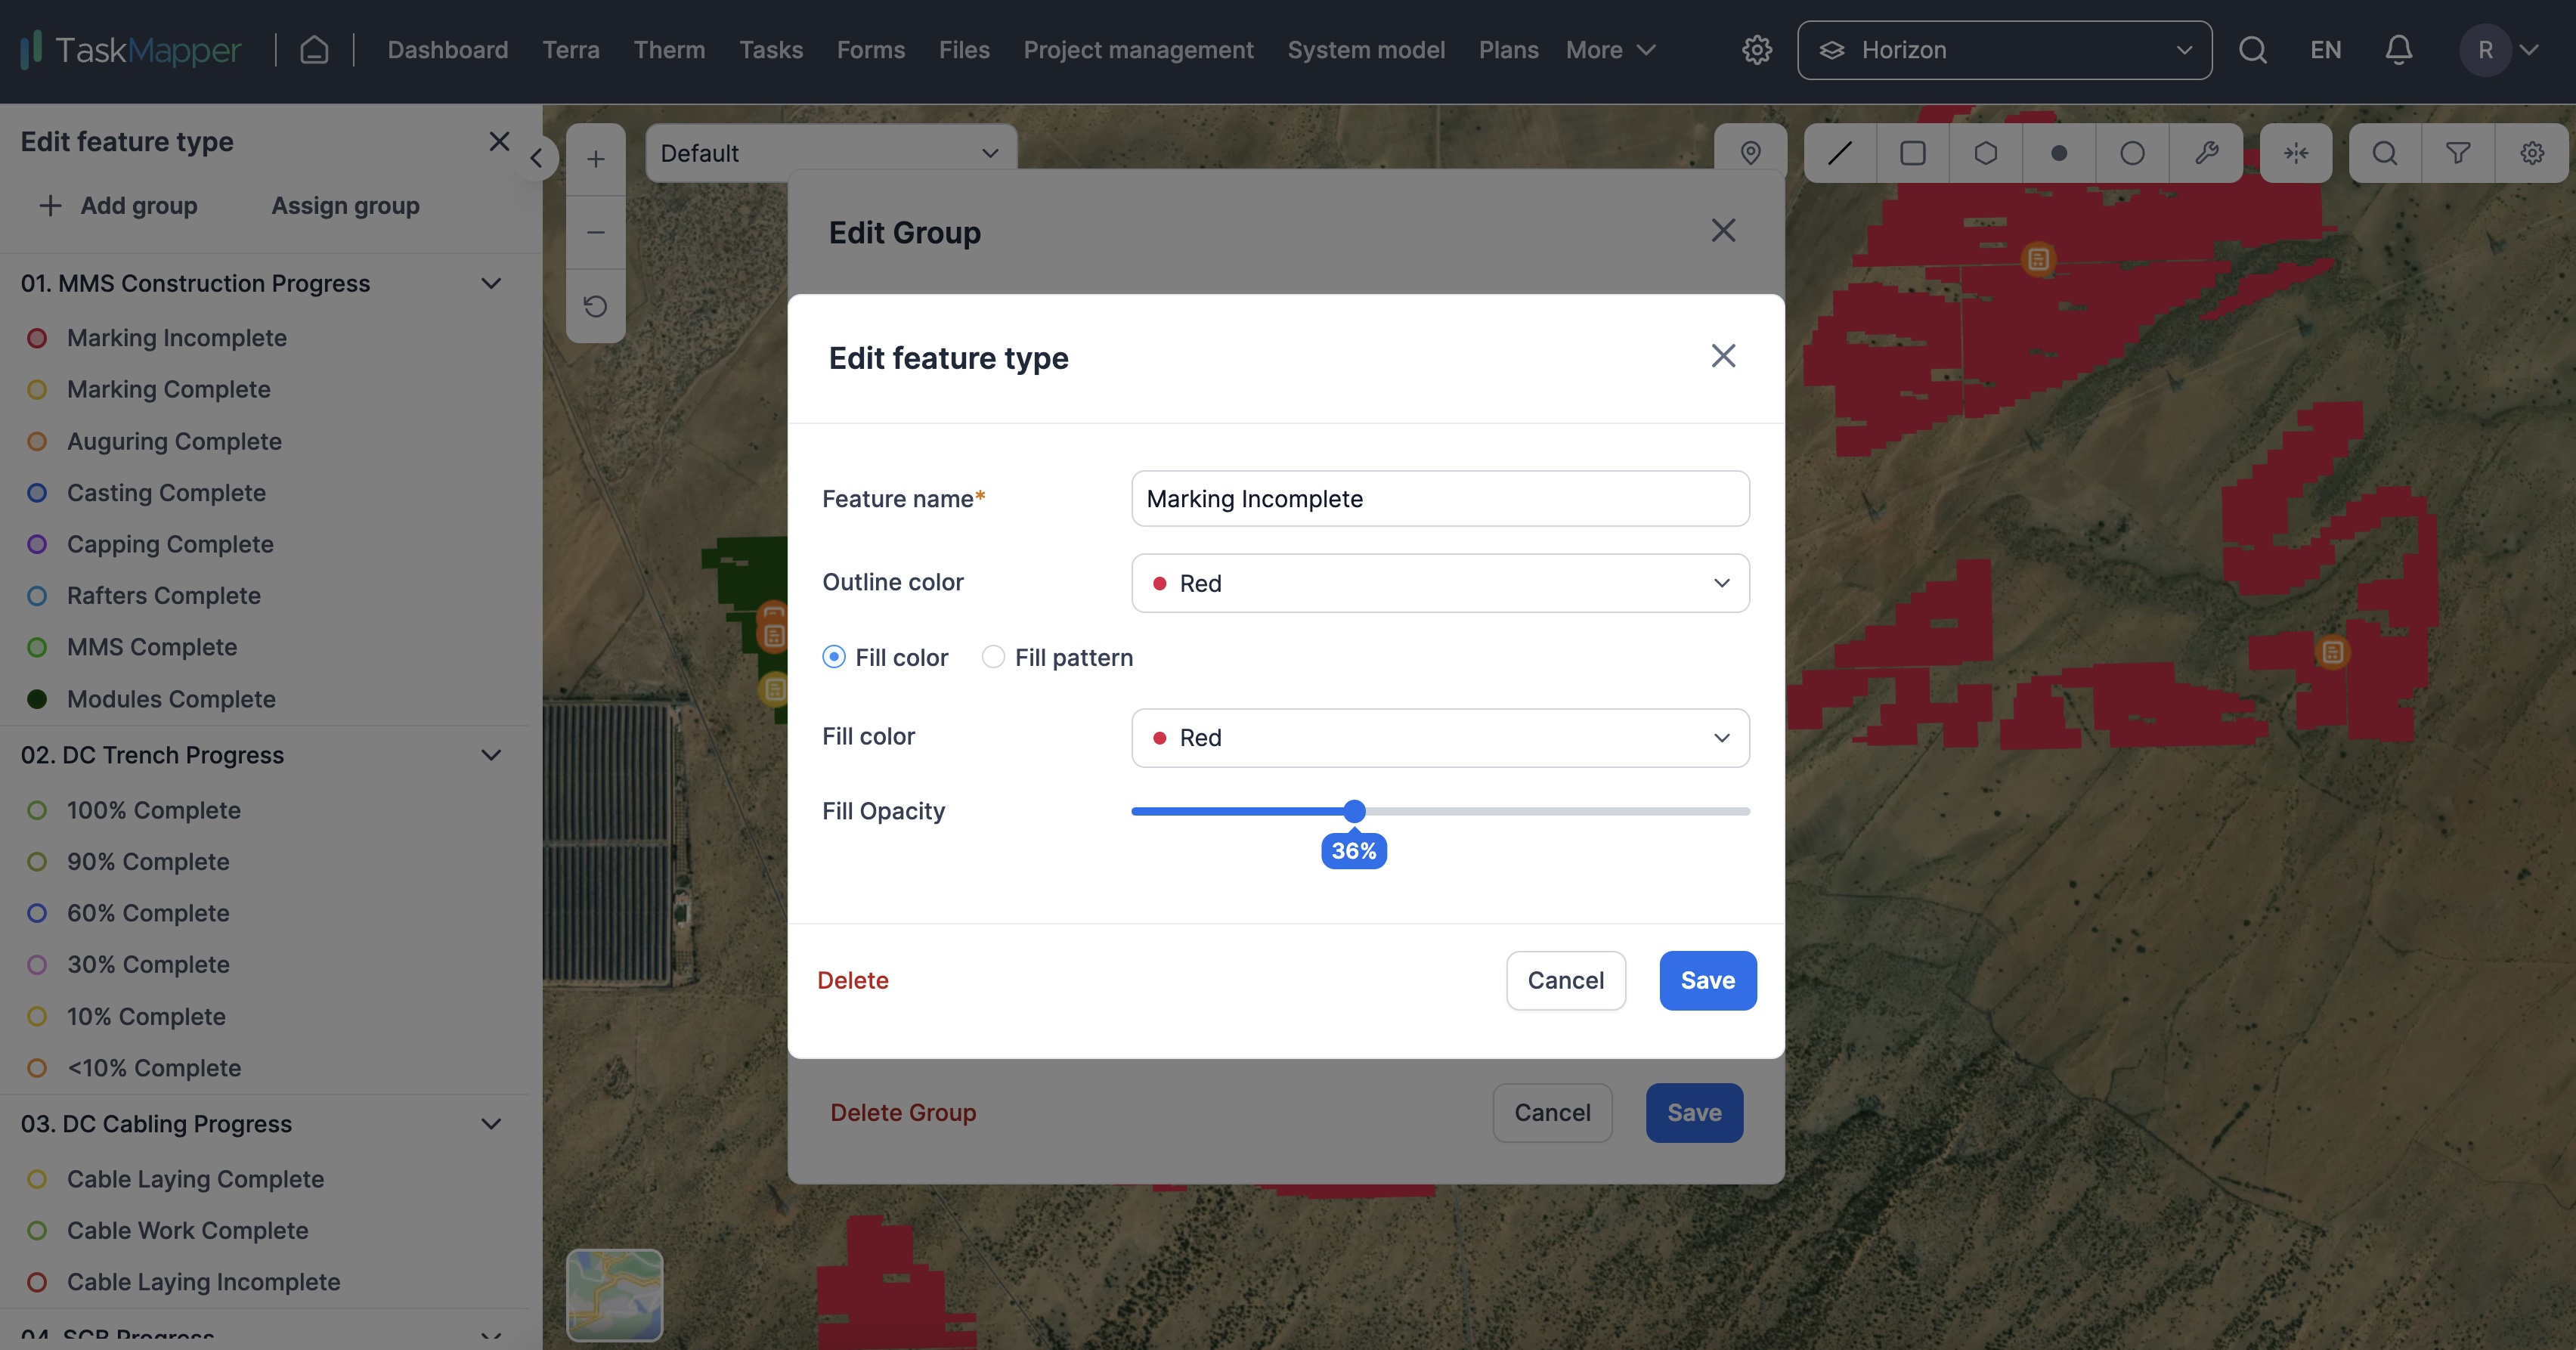
A feature type can be edited and the options available in the edit are name, choose options between fill colour or pattern and fill opacity. Below are the steps to edit
1) Click on the edit icon on the left-hand side of the screen
FIGURE 20(a): FEATURE TYPE EDIT
2) Edit the group in which the feature type needs changes
FIGURE 20(b): FEATURE TYPE EDIT
3) Edit the Feature type
FIGURE 20(c): FEATURE TYPE EDIT
4) Editable options are name, color (Fill or Pattern), and Opacity. Click on 'Save' when complete.
FIGURE 20(d): FEATURE TYPE EDIT


